Python Descriptive Statistics – Measuring Central Tendency & Variability
Python course with 57 real-time projects - Learn Python
1. Objective
In our last tutorial, we studied Python Charts. Today, we will learn about Python Descriptive Statistics. In this Python Statistics tutorial, we will discuss what is Data Analysis, Central Tendency in Python: mean, median, and mode. Moreover, we will discuss Python Dispersion and Python Pandas Descriptive Statistics. Along with this, we will cover the variance in Python and how to calculate the variability for a set of values.
So, let’s begin the Python Descriptive Statistics Tutorial.
2. Data Analysis
With data analysis, we use two main statistical methods- Descriptive and Inferential.
- Descriptive statistics uses tools like mean and standard deviation on a sample to summarize data.
- Inferential statistics, on the other hand, looks at data that can randomly vary, and then draw conclusions from it.
Some such variations include observational errors and sampling variation.
Do you know about Python Collection Module
3. Descriptive Statistics in Python
Python Descriptive Statistics process describes the basic features of data in a study. It delivers summaries on the sample and the measures and does not use the data to learn about the population it represents.
Under descriptive statistics, fall two sets of properties- central tendency and dispersion. Python Central tendency characterizes one central value for the entire distribution. Measures under this include mean, median, and mode. Python Dispersion is the term for a practice that characterizes how apart the members of the distribution are from the center and from each other. Variance/Standard Deviation is one such measure of variability.
4. Python Descriptive Statistics – Central Tendency in Python
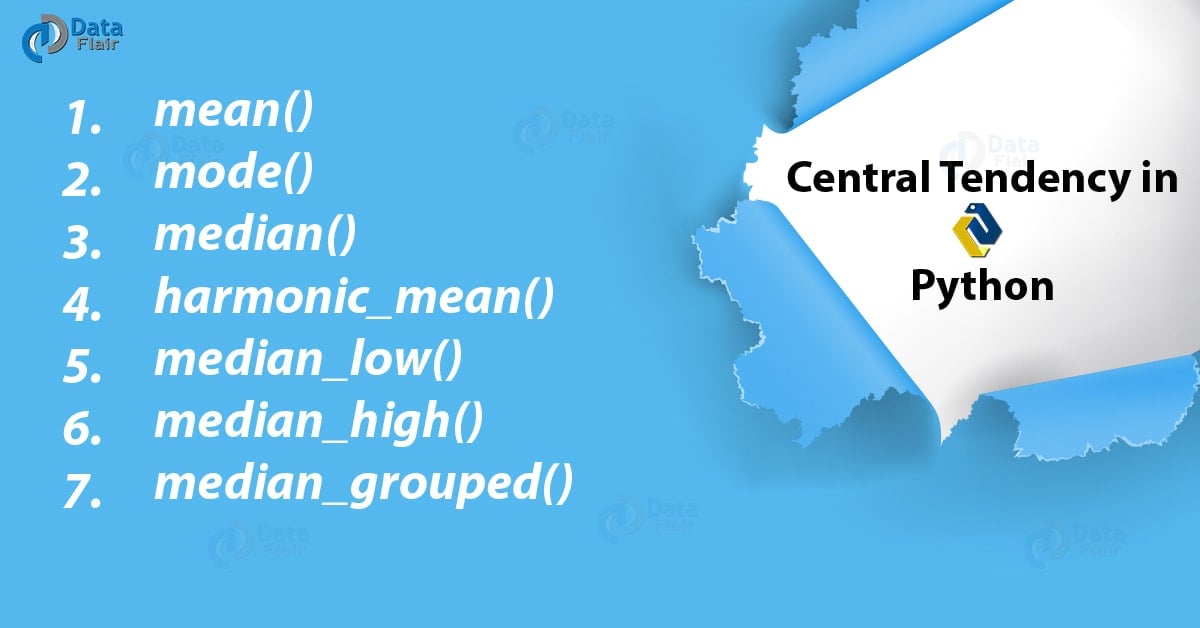
We have seen what central tendency or central location is. Now let’s take a look at all the functions Python caters to us to calculate the central tendency for a distribution. For this, let’s import the Python statistics module.
>>>import statistics as st
a. mean()
This function returns the arithmetic average of the data it operates on. If called on an empty container of data, it raises a StatisticsError.
>>> nums=[1,2,3,5,7,9]
>>> st.mean(nums)
4.5
>>> st.mean([-2,-4,7]) #Negative numbers
0.3333333333333333
>>> from fractions import Fraction as fr
>>> st.mean((fr(3,4),fr(5,7),fr(2,1))) #Fractions
Fraction(97, 84)
>>> st.mean({1:"one",2:"two",3:"three"}) #Keys from a dictionary2
Do you know the difference between Python Modules vs Packages
b. mode()
This function returns the most common value in a set of data. This gives us a great idea of where the center lies.
>>> nums=[1,2,3,5,7,9,7,2,7,6]
>>> st.mode(nums)
7
>>> st.mode(['A','B','b','B','A','B'])
‘B’
c. median()
For data of odd length, this returns the middle item; for that of even length, it returns the average of the two middle items.
>>> st.median(nums) #(5+6)/2
5.5
d. harmonic_mean()
This function returns the harmonic mean of the data. For three values a, b, and c, the harmonic mean is-
3/(1/a + 1/b +1/c)
It is a measure of the center; one such example would be speed.
>>> st.harmonic_mean([2,4,9.7])
3.516616314199396
For the same set of data, the arithmetic mean would give us a value of 5.233333333333333.
e. median_low()
When the data is of an even length, this provides us the low median of the data. Otherwise, it returns the middle value.
>>> st.median_low([1,2,4])
2
>>> st.median_low([1,2,3,4])
2
f. median_high()
Like median_low, this returns the high median when the data is of an even length. Otherwise, it returns the middle value.
>>> st.median_high([1,2,4])
2
>>> st.median_high([1,2,3,4])
3
Let’s Learn CGI Programming in Python with Functions and Modules
g. median_grouped()
This function uses interpolation to return the median of grouped continuous data. This is the 50th percentile.
>>> st.median([1,3,3,5,7])
3
>>> st.median_grouped([1,3,3,5,7],interval=1)
3.25
>>> st.median_grouped([1,3,3,5,7],interval=2)
3.5
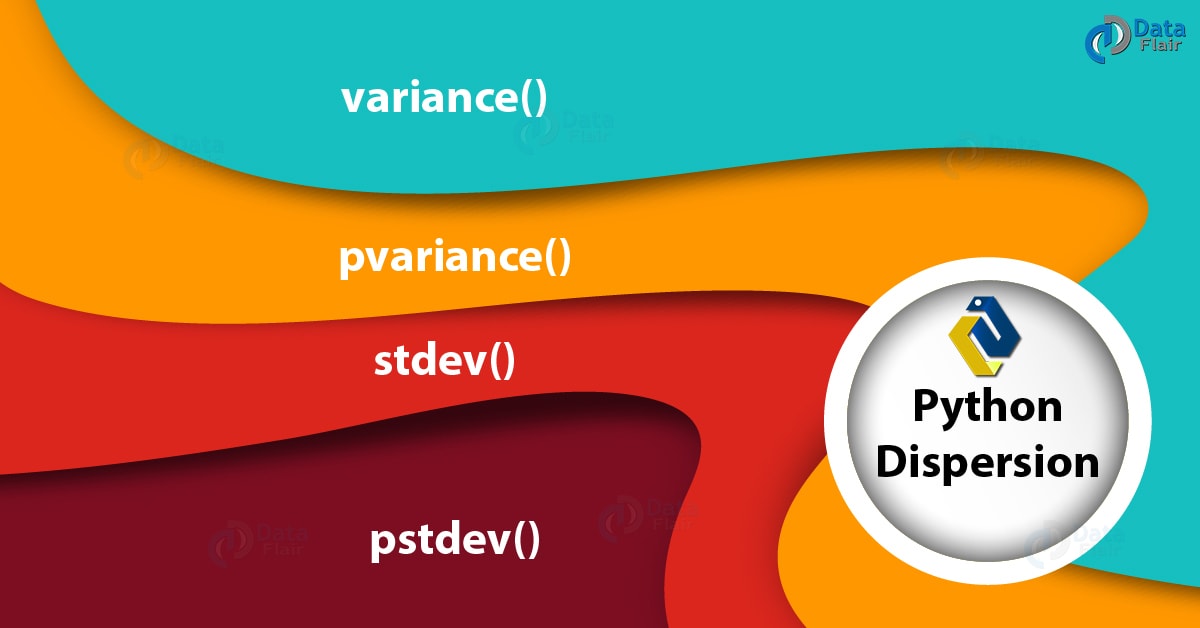
5. Python Descriptive Statistics – Dispersion in Python
Dispersion/spread gives us an idea of how the data strays from the typical value.
a. variance()
This returns the variance of the sample. This is the second moment about the mean and a larger value denotes a rather spread-out set of data. You can use this when your data is a sample out of a population.
>>> st.variance(nums)
7.433333333333334
b. pvariance()
This returns the population variance of data. Use this to calculate variance from an entire population.
>>> st.pvariance(nums)
6.69
c. stdev()
This returns the standard deviation for the sample. This is equal to the square root of the sample variance.
>>> st.stdev(nums)
2.7264140062238043
Read about Python Namespace and Variable Scope – Local and Global Variables
d. pstdev()
This returns the population standard deviation. This is the square root of population variance.
>>> st.pstdev(nums)
2.5865034312755126
The statistics module defines one exception-
exception statistics.StatisticsError
This is a subclass of ValueError.
6. pandas with Descriptive Statistics in Python
We can do the same things using pandas too-
>>> import pandas as pd
>>> df=pd.DataFrame(nums)
>>> df.mean()
0 4.9
dtype: float64
Follow this to know more about Python Pandas
>>> df.mode()
0 7
>>> df.std() #Standard deviation
0 2.726414
dtype: float64
>>> df.skew()
0 -0.115956 #The distribution is symmetric
dtype: float64
A value less than -1 is skewed to the left; that greater than 1 is skewed to the right. A value between -1 and 1 is symmetric.
So, this was all about Python Descriptive Statistics Tutorial. Hope you like our explanation.
7. Conclusion
Hence, we studied Python Descriptive Statistics, in which we learned Central Tendency & Dispersion used in Python Statistics Module. In addition, we used the statistics and pandas modules for this. Did you find it easy to grasp? Leave your suggestions below.
Related Topic- Python NumPy Tutorial
For reference
Did you like our efforts? If Yes, please give DataFlair 5 Stars on Google


