Create Python Scatter Plot & Python BoxPlot (Using Matplotlib)
Python course with 57 real-time projects - Learn Python
1. Python Scatter & BoxPlot
In our Last tutorial, we discussed Python Charts – Bubble & 3D Charts. Today, we will talk Python Scatter Plot. In addition, we will learn how to draw a Scatter Plot in Python Programming. Moreover, we will cover how to create Python Box Plot using Matplotlib.
Let’s begin the Python Scatter Plot.
How to Create Python Scatter Plot & Python BoxPlot
2. How to Create Python BoxPlot Using Matplotlib?
Python box plot tells us how distributed a dataset is. Another use is to analyze how distributed data is across datasets. Such a plot creates a box-and-whisker plot and summarizes many different numeric variables. Let’s first take an example so we can explain its structure better.
>>> import matplotlib.pyplot as plt
>>> np.random.seed(10)
>>> one=np.random.normal(100,10,200)
>>> two=np.random.normal(80, 30, 200)
>>> three=np.random.normal(90, 20, 200)
>>> four=np.random.normal(70, 25, 200)
>>> to_plot=[one,two,three,four]
>>> fig=plt.figure(1,figsize=(9,6))
>>> ax=fig.add_subplot(111)
>>> bp=ax.boxplot(to_plot)
>>> fig.savefig('boxplot.png',bbox_inches='tight')
Top 35 Python Interview Questions and Answer
This saves the following figure-

Creating Python BoxPlot (Using Matplotlib)
Structure-
- The box denotes the dataset’s quartiles.
- The whiskers extend and denote the rest of the distribution.
- A function of the inter-quartile range determine the points that are outliers.
The input to this can be a list, a NumPy array, a pandas Series object, an array, a list of vectors, a long-form DataFrame, or a wide-form DataFrame.
Let’s take another example.
>>> ax = sn.boxplot(x="day", y="total_bill", hue="smoker",data=tips, palette="Set3")
>>> plt.show()

Creating Python BoxPlot (Using Matplotlib)
3. How to Create a Python Scatter Plot?
Python Scatter Plot, let us denote how two or more objects related to each other.

How to Create Scatter Plot in Python?
It also lets us identify outliers- values that stray from all others.
>>> np.random.seed(19680801)
>>> N=50
>>> x=y=colors=np.random.rand(N)
>>> area = (30 * np.random.rand(N))**2
>>> plt.scatter(x, y, s=area, c=colors, alpha=0.5)
<matplotlib.collections.PathCollection object at 0x095BB6D0>
Do you know how to Implement Python Switch Case Statement
>>> plt.show()

Creating Scatter Plot in Python using plt.plot
a. Python Scatter Plot using plt.plot
>>> x=np.linspace(0,10,30)
>>> from scipy import sin
>>> y=np.sin(x)
>>> plt.plot(x,y,'o',color='purple')
[<matplotlib.lines.Line2D object at 0x080D3890>]
>>> plt.show()

Creating Scatter Plot in Python using plt.plot
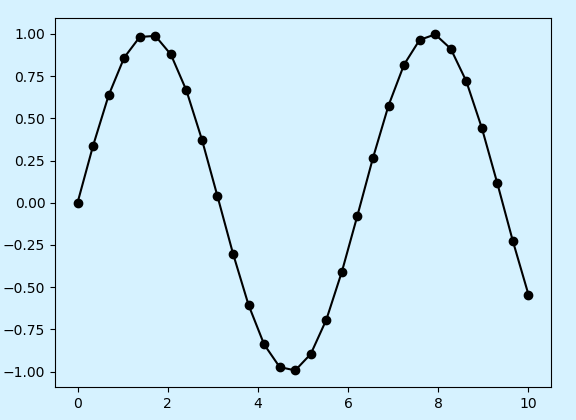
>>> plt.plot(x,y,'-ok')
[<matplotlib.lines.Line2D object at 0x08094F30>]
>>> plt.show()
Python Scatter Plot using plt.plot
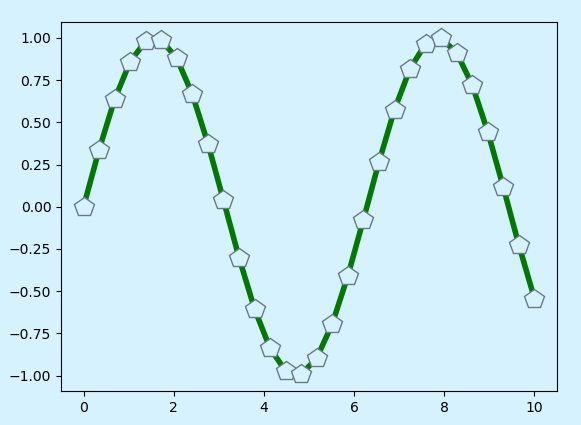
>>> plt.plot(x,y,'-p',color='green',
     markersize=15,linewidth=4,
     markerfacecolor='white',
     markeredgecolor='gray',
     markeredgewidth=1)
[<matplotlib.lines.Line2D object at 0x0811A4B0>]
Do you know how to Python Rename File – Single & Multiple Files
>>> plt.show()
Draw Python Scatter Plots | Python BoxPlot (Using Matplotlib)
b. More than one plot
>>> plt.plot(np.random.rand(20),'*')
[<matplotlib.lines.Line2D object at 0x08158A30>]
>>> plt.plot(np.random.rand(20),'o')
[<matplotlib.lines.Line2D object at 0x08158D90>]D
>>> plt.show()
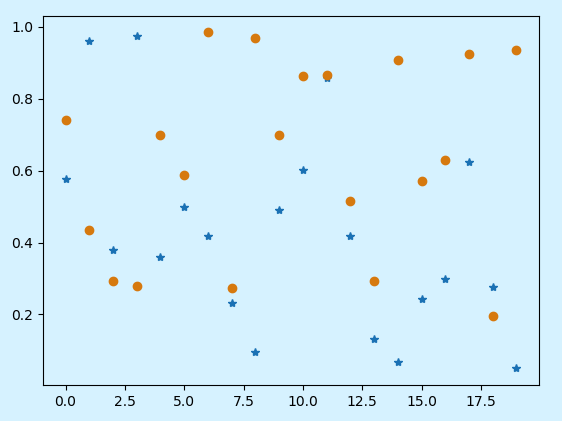
Draw More than one Scatter Plot in Python
So, this was all about Python Scatter Plot. Hope you like our explanation.
4. Conclusion
Hence, we learned how to create Python box plots and scatter plot with matplotlib. Stay tuned for more charts. Leave your opinions in the comments below.
Related Topic- Python Stemming and Lemmatization
For reference
Did we exceed your expectations?
If Yes, share your valuable feedback on Google


your explanation and material are up to date. It’s awesome course self-explanatory!