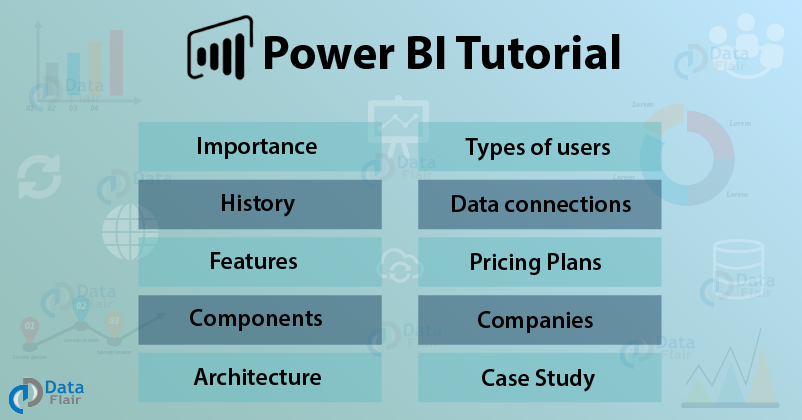
Power BI Tutorial – A Complete Guide on Introduction to Power BI
Job-ready Online Courses: Dive into Knowledge. Learn More!
Welcome to the Power BI tutorial by DataFlair. Before we begin this journey of learning a new BI technology called Microsoft Power BI, we must learn some basics about it. In this introductory tutorial of Microsoft Power BI, we will give you some interesting information and insights on this BI technology. We request you to take some time out and explore this thoroughly as it will act as a building block for learning Power BI technology.
We can confidently presume that not many of you here are not aware of business intelligence and data visualization. Especially in today’s world, where data is the Robin of every business and organization. And, without this Robin, there is no Batman! Data is a treasure of knowledge and valuable information which is used by the ones helming a business to make lucrative and effective decisions at the right time.
“BI is about providing the right data at the right time to the right people so that they can take the right decisions”
– Nic Smith with Microsoft BI Solutions Marketing
Power BI Tutorial
Before diving into the Power BI introduction, let’s have a quick look at Business intelligence (BI). It refers to taking raw data from a data source, transforming it into usable data and utilizing it to make reports and informative graphics for data analysis.
Graphically representing tabular data is known as data visualization. It enables a user to visualize important information through charts, graphs, KPIs, maps, etc. to attain valuable insights just by looking at them. Well Microsoft Power BI is a tool having business intelligence and data visualization capabilities.
Before we begin with this journey of learning a new BI technology called Microsoft Power BI, we must learn some basics about it. We request you to take some time out and explore this Power BI tutorial thoroughly as it will act as a building block for learning Power BI technology.
What is Power BI?
Power BI is a cloud-based business analysis and intelligence service by Microsoft. It is a collection of business intelligence and data visualization tools such as software services, apps and data connectors.
We can use the datasets imported in Power BI for data visualization and analysis by making sharable reports, dashboards, and apps. Power BI is a user-friendly tool offering impressive drag-and-drop features and self-service capabilities.
Microsoft offers three types of Power BI platforms:
- Power BI Desktop (A desktop application)
- Power BI Service (SaaS i.e., Software as a Service)
- Power BI Mobile (For iOS and Android devices)
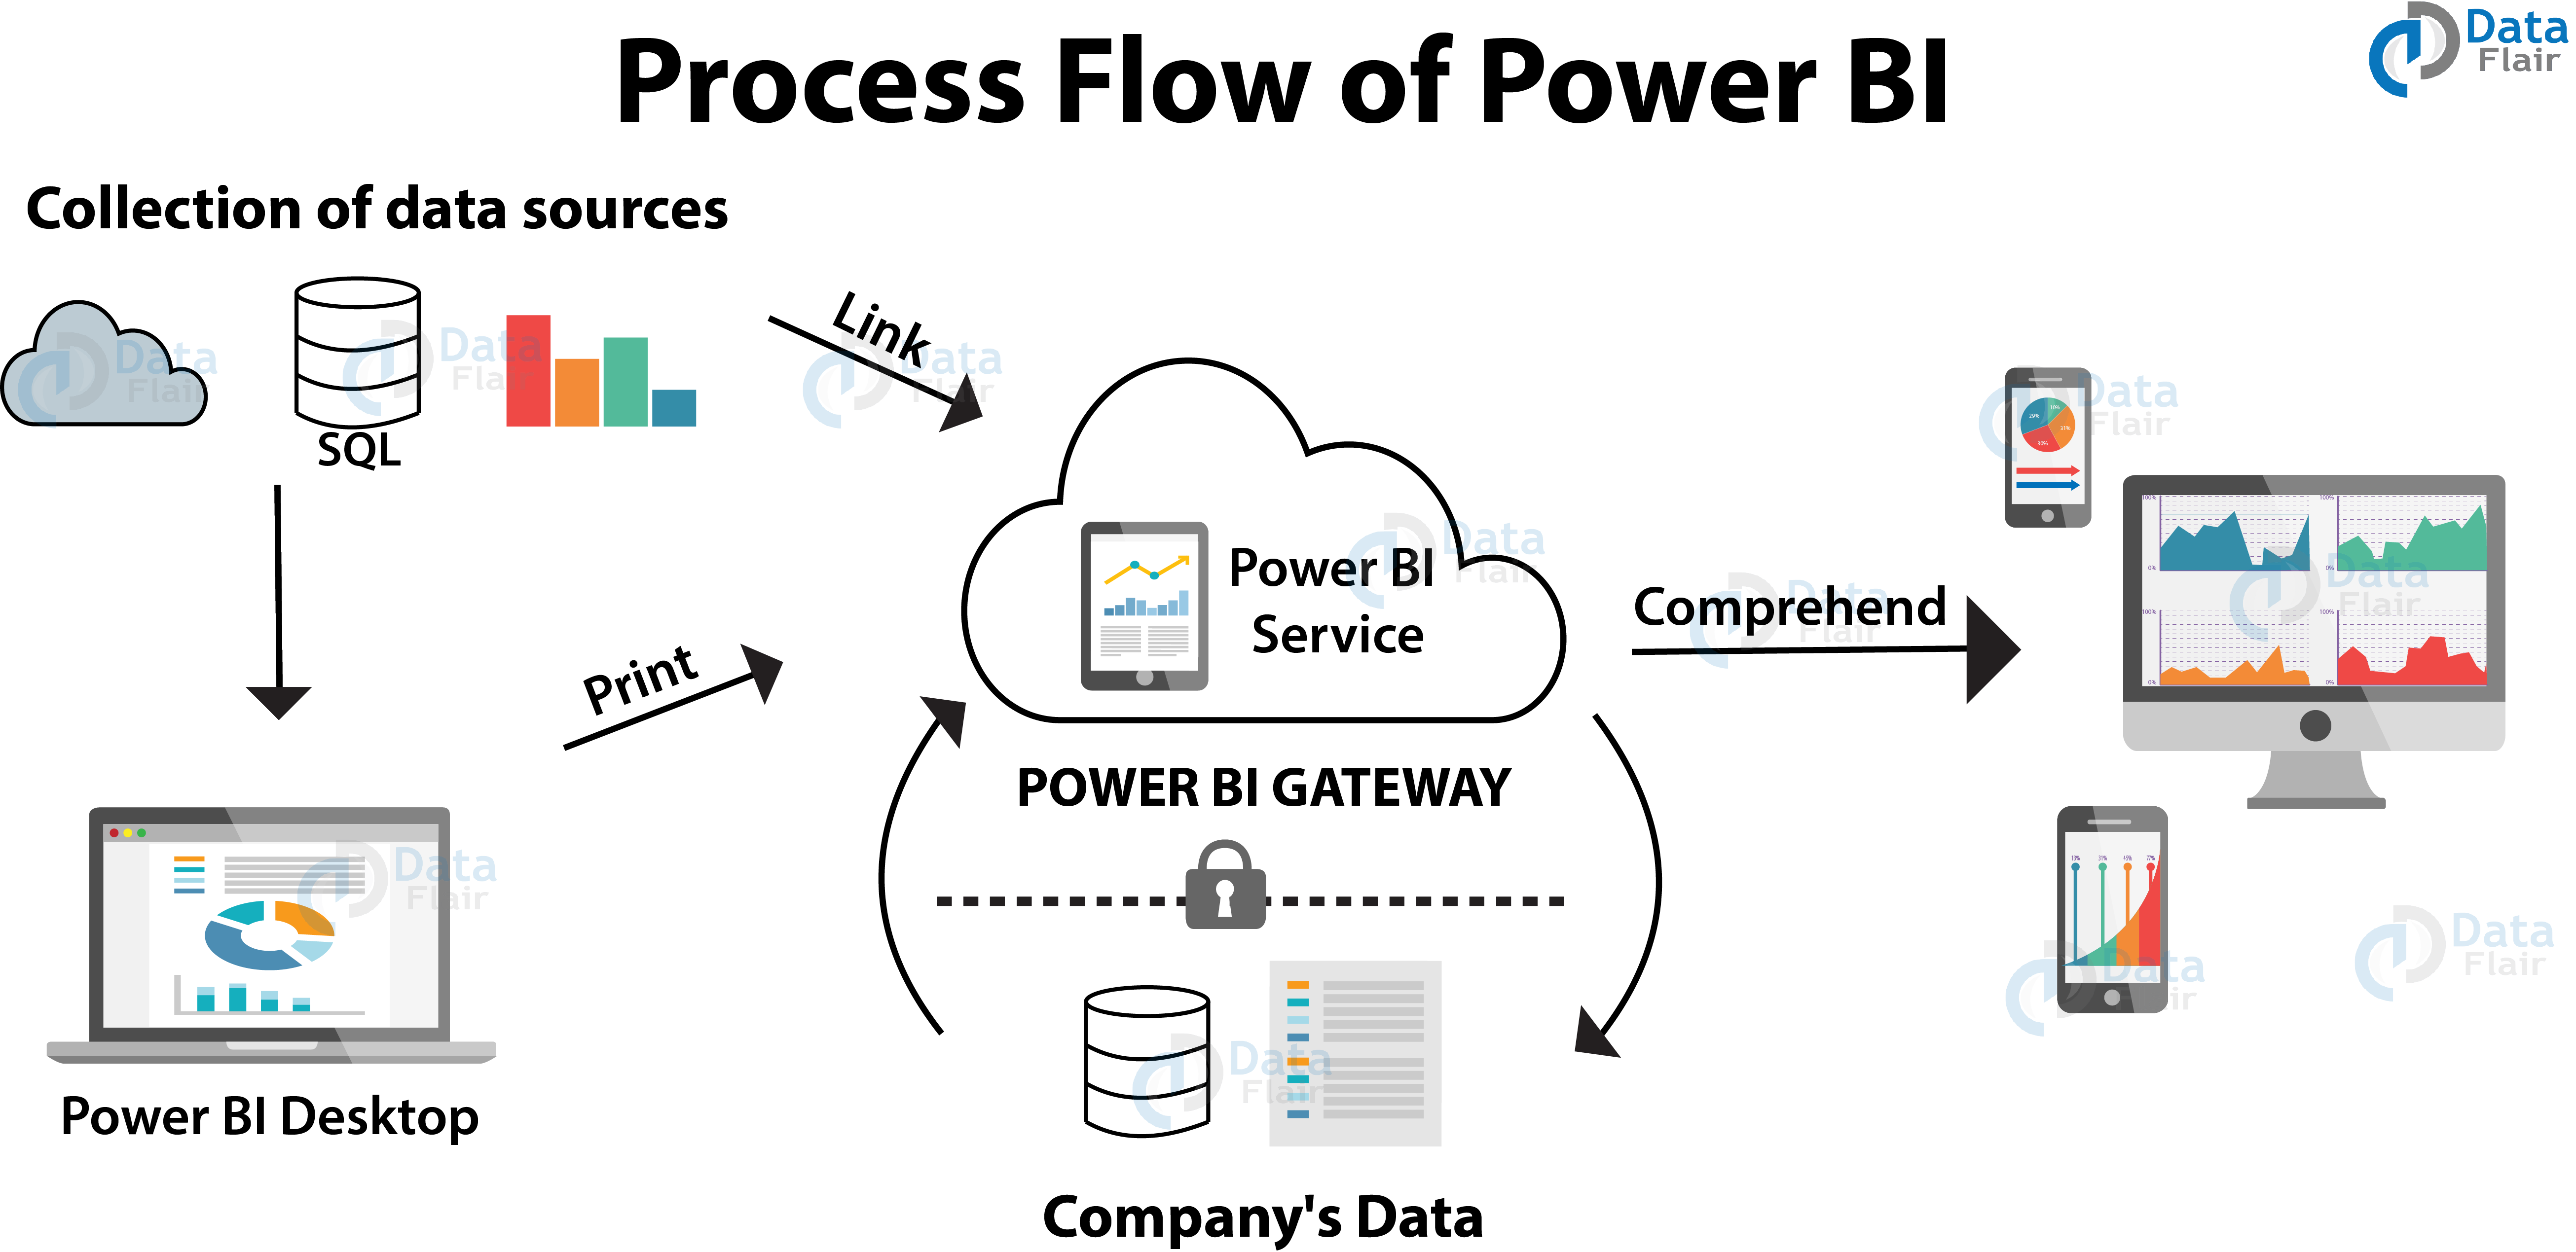
Also, we can deploy Power BI on both on-premise and on-cloud platforms.
In the image given below, have a look at the process flow in Power BI.
Why Power BI?
As we learned in the previous section of Power BI tutorial that, Power BI is an umbrella term having several different kinds of services under its tutelage.
1. There is a cloud-based BI service called Power BI Services used to view and share dashboards.
2. A desktop-based reporting interface known as Power BI Desktop.
3. Another useful service is Power BI Embedded that runs on an Azure cloud platform and we can use it for report creation, ETL and data analysis.
Further, let us discuss a few points regarding why Power BI is an important tool in today’s time and why do we need it.
- Real-time analysis in Power BI can be done by establishing direct connections to the data sources. Also, it keeps data updated to the latest second by data refreshing.
- You can use custom visualizations from a custom visuals gallery. Custom visuals are divided into many options and categories.
- You can quickly search for important insights and datasets within your data by using the Quick Insights option.
- Establish a live or non-live connection to on-premises data sources like SQL Server, and use a secure channel to access data through data gateways. This makes Power BI enterprise-ready as on-premises connections make data transfer secure and the technology scalable and reliable.
- You can connect to other services through Power BI such as SQL Server Analysis Services (SSAS), Microsoft Excel, etc.
- Power BI is a new age software using the latest technologies such as HTML 5.0, column store databases, cloud computing, mobile apps, etc. This helps in keeping Power BI on the top and popular as it is constantly getting updated with the latest features.
History of Power BI
Power BI is a Microsoft’s product initially released on 11th July 2011. It was originally designed and created by Ron George in 2010, who released it with the name “Project Crescent”. Later in September of 2013, Microsoft changed the name to Power BI and launched it for the public.
This release was a Power BI for Office 365 and had Microsoft Excel add-ins, Power Pivot, Power View, Power Query in it. In later versions, Microsoft added advanced features like natural language Q&A, enterprise-level data security and connectivity, Power data gateways, etc.
Power BI’s first general public release was on July 24th, 2015. As of 2019, Power BI has been officially declared as one of the leading BI tools by 2019 Gartner Magic Quadrant for Analytics and Business Intelligence Platform.
Power BI Features
There are some of the most important and interesting features of Power BI:
- Attractive Visualizations/ custom visualizations
- GetData (Data sources)/data connections
- Datasets
- Dashboards
- Filters
- Ad hoc analysis
- Reports/ ad hoc reporting
- Trend indicators
- Online Analytical Processing (OLAP)
- Navigation pane
- Natural language Q & A box
- DAX functions and formula
- Office 365 app launcher
- Content packs
- Authoring interactive reports
You must learn about these features in detail from our separate tutorial on features of Power BI
Power BI Components
Power BI is a business intelligence and data mining software suite which is a collection of different kinds of services by Microsoft. These services play a specific role and work in coordination with each other, to make Power BI function as a whole. In this section of the Power BI tutorial, we will learn about each of these Power BI services or components and their roles.
- Power Query: We use this service to access, search and transform data from public or local/internal data sources.
- Power Pivot: This service provides tools to model data taken from the in-memory data source to use it for analytics.
- Power View: This service has many tools to graphically represent data using visuals and use them for analysis.
- Power Map: It comes with tools and capabilities to visualize Geo-spatial data or information in the 3D model in a map. You can use these maps in a Power BI report.
- Power BI Desktop: It is a companion development tool for Power View, Power Query, and Power Pivot. You can import data from a data source, prepare and transform it and use it in visualizations to create reports in Power BI Desktop.
- Power BI Website: It is a web platform to view and share Power BI apps or solutions. Using Power BI Website, you can create dashboards from reports, share the dashboards with other Power BI users and slice and dice data within a report.
- Power Service: The Power Service enables the sharing of workbooks and data views with other users. The data gets refreshed at regular intervals from the on-premises or/and cloud-based data sources.
- Power Q&A: Using the Power Q&A option, you can search for your data or discover insights by entering queries in natural language. It instantly understands your query and returns relevant results.
- Power BI Mobile apps: Business users view and interact with the reports and dashboards published on a cloud service through mobile hosted Power BI instances. Android, Windows and iOS mobile devices support the Power BI mobile apps.
- Data Catalog: The Data Catalog option offers the capability to search and reuse queries.
- Data Management Gateway: This component manages the periodic data refreshes, data feed viewing and table exposing.
Power BI Architecture
To have a better understanding of Power BI, we can divide the architecture into three parts or phases:
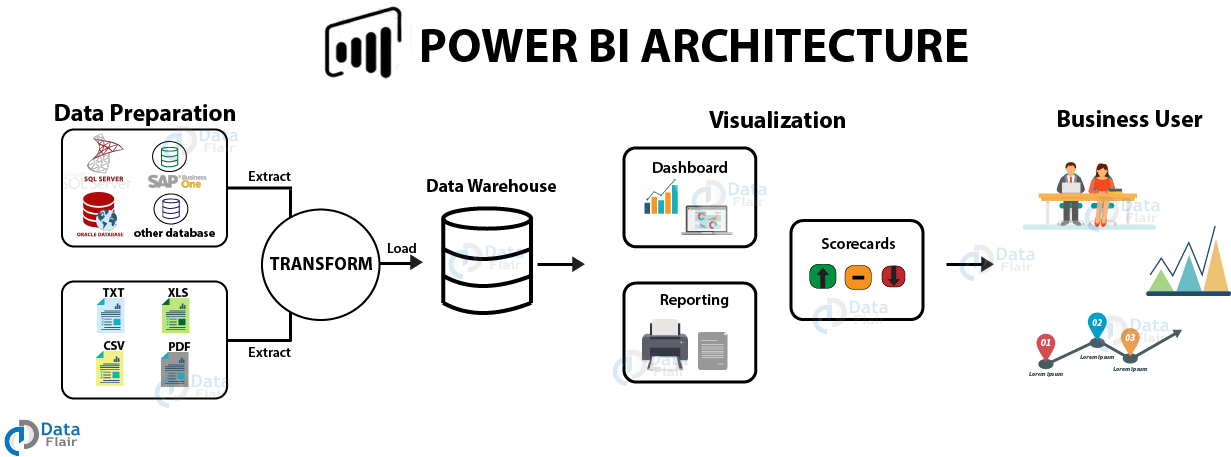
1. Data Integration
In Power BI, we can import data from different kinds of data sources in different formats. In the data integration step, Power BI brings data together (extracted) from different data sources and converts it into a standard format. After data is integrated into Power BI, it is stored in a common storage area known as the staging area.
2. Data Processing
Once Power BI integrates and stores data at a secure place, the raw data requires some processing. Several processing or cleansing operations transform the raw data such as removing redundant values, etc. Later, we apply relevant business rules on the processed data that transforms it according to our business needs. This transformed data is loaded into the data warehouses. This completes a full process of ETL.
3. Data Presentation
In this final phase, the processed data moves from the warehouse and goes into the Power BI platforms like Power BI Desktop to create reports, dashboards, and scorecards. Power BI offers a wide range of visualizations. We can also import custom visualization from the marketplace. From the report development platforms, we can publish the reports on the web or mobile apps to share it with other business users.
Get a thorough understanding of Power BI Architecture
Users of Power BI
Power BI users are categorized into four sections according to the purpose of the usage of Power BI. These four types of users are Analysts, Business users, IT professionals and Developers. Let’s learn some more about them.
1. Analysts
Analysts use Power BI to develop reports, dashboards, data models and study them to discover valuable insights in the data. Power BI offers a wide range of data sources from which an analyst can extract data, make a common dataset, cleanse and prepare that data to make reports and conduct analysis.
2. Business Users
The business users are the common users who study the reports and dashboards available to share with them on the Power BI website or mobile app. Business users remain updated with the latest information which helps in taking important decisions in time. They can also set an alert notification for any change or abnormality in data (if occurs).
3. IT professionals
The IT professionals are mainly concerned with the scalability, availability, and security of data. They also centrally manage all the Power BI services and users.
4. Developers
Developers are responsible for all the technical work. Their key roles are to create custom visuals to be used in Power BI, embedding Power BI into other applications, creating reports, etc.
Data Connections in Power BI
There are a plethora of data sources from which you can extract data into Power BI. You can connect to data files on your local system, Excel files, Azure SQL Database, Facebook, Google Analytics, Power BI datasets, etc.
You can connect to cloud-based sources, on-premises data sources using gateways, online services, direct connections, etc. We have listed some commonly used data sources below.
- File: Excel, Text/CSV, XML, PDF, JSON, Folder, SharePoint.
- Database: SQL Server database, Access database, Oracle database, SAP HANA database, IBM, MySQL, Teradata, Impala, Amazon Redshift, Google BigQuery, etc.
- Power BI: Power BI datasets and Power BI dataflows.
- Azure: Azure SQL, Azure SQL Data Warehouse, Azure Analysis Services, Azure Data Lake, Azure Cosmos DB, etc.
- Online Services: Salesforce, Azure DevOps, Google Analytics, Adobe Analytics, Dynamics 365, Facebook, GitHub, etc.
- Others: Python script, R script, Web, Spark, Hadoop File (HDFS), ODBC, OLE DB, Active Directory, etc.
Power BI Pricing
Now, we are sure you must have started liking Power BI after learning what all it has to offer. And so, you would also want to know its pricing and licensing costs. We will let you know about the prices of different versions with their features in this Power BI tutorial. Microsoft has put out three pricing plans for Power BI:
- The basic version, Power BI Desktop is free of cost and includes tools for data visualization, data preparation, data modeling, data cleansing and publishing reports to Power BI Service.
- Power BI Pro is available at a subscription price of $9.99 per user per month. You can try a 60 days free trial before purchasing the subscription. This plan for Power BI Pro includes tools for data collaboration, a 360 real-time view for dashboards, data governance, and the freedom to publish reports anywhere.
- The Power BI Premium is available at a price of $4,995 per month for one dedicated storage resource and cloud computing facility.
Power BI Certifications
- Microsoft Power BI Desktop Specialist
- Microsoft Data Visualization Expert
- Microsoft Certified Solutions Associate
- Microsoft Power BI for Office 365
- Microsoft Power BI Pro
- Microsoft Power BI Expert
Companies using Power BI
Power BI is a relatively new business analytics software in the market and is gaining popularity very fast. It has gathered a huge customer base worldwide already and is rapidly expanding. Here is a list of a few big names that use Power BI as their business analysis software:
- DELL
- Capgemini
- Nuevora
- Accenture
- Agile BI
- Data Bear
- Acuity Training
Power BI Case Study on Rolls-Royce
In this section, we will briefly walk through a case study of Power BI. This will help us understand the role of Power BI in a real-life scenario. The case in the spotlight here is Rolls-Royce. This 20-year-old company needs no introduction.
As of this year, it is making more than 13,000 engines for commercial aircraft used around the world. This speaks for its massive and ever-increasing customer base. Now let us move further and see the challenges the company faced and how Power BI proved to be useful.
The problem
The most fundamental challenge of the company was to optimize maintenance costs, operational costs, fuel expenses, etc. This is only possible when the company can record, access, and analyze the data produced by all the systems and equipment of the aircraft.
With the advancing technology, the systems can record more and more signals which are the data from different aircraft sensors. This has resulted in a constant increase in data volumes. So, the company needed a good data management and analysis system that filter important signals or data and use them to generate insights.
In addition to this, Rolls-Royce launched a customer service and maintenance model known as “TotalCare Services”. It was a very successful initiative that involved engine maintenance services for the customer. For this also, the company needed proper insights into data so that they can establish a bond with their customers.
The change
Rolls-Royce chose the Microsoft Azure platform and Power BI to manage and analyze terabytes of data coming from the engines and maintenance systems. With the help of Microsoft Azure, the company was able to aggregate data from varied locations and sources. And with the help of Microsoft Power BI, they were able to carry out analysis on the extracted data.
With Power BI, they designed and created dashboards and reports having informative visuals and charts. Earlier, creating informative reports to gain insights into data was time-consuming. But with Power BI, it is the easiest step in the entire process. Thus, Power BI plays a crucial role in providing valuable insights into data so that the company can focus on improving operational efficiencies and establish long-lasting relationships with their customers.
Summary
This brings our introductory tutorial on Microsoft Power BI to an end. We hope it helped you lay a solid foundation about the technology. In the tutorials to come, we will expand on more interesting topics and tools of Power BI.
We work very hard to provide you quality material
Could you take 15 seconds and share your happy experience on Google


