Power BI Report Server – An Informative Guide for Beginners!
Placement-ready Courses: Enroll Now, Thank us Later!
Continuing with our Power BI DataFlair tutorial series, now, we will learn about Power BI Report Server. As we know, Power BI as a technology is a collection of several other technologies and services. Power BI Report Server is one such crucial technology. Here, we will learn about its different aspects:
- Basic Features
- Installation
- Working/architecture
- Components
- Features of Latest Version
What is Power BI Report Server?
Power BI Report Server is an on-premises report server that is used to host Power BI reports. The reports hosted on the on-premises report server are displayed to the users via a web portal. You can also host paginated reports, mobile reports, and KPIs on the report server because it is built upon SQL Server Reporting Service’s (SSRS) architecture. You can access and view all the types of reports on report server using a web browser, mobile device or via email.
There are many advantages of using an on-premises report server to host Power BI reports. It is compatible with the Power BI Service and you can easily integrate it with your existing Reporting Services. Also, on-premises report server is preferred by many organizations from a security point of view. Organizations find it safer to host important reports on a secure on-premises solution rather than on the cloud.
Do you know – How to Create KPI in Power BI Desktop?
Power BI Report Server Features
As we know, report server runs on SSRS framework and so we can call it a subset of SSRS. Being a subset, it has some key features and an important role to play. We have discussed some key features below:
- The report server hosts Power BI reports on-premises. One can share reports and collaborate with other users by using the on-premises report server. Also, it has the unique capability to deploy and use mobile reports (.rsmobile), paginated reports (.rdl) and KPIs.
- It can render custom visualizations. Users hosting their Power BI reports on this on-premises server gets an added 100 custom visuals to the default ones.
- Users can connect to the this from Power BI Mobile. They can access reports from the report server easily. Presently, the report server is supported by iOS, Android, Windows mobile platforms.
- From the on-premises report server, users can access and interact with reports on a web platform. They can use and apply actions like cross-filtering, tooltips, slicers, data exploration, etc.
- Users can export data from reports hosted on a Report Server to a CSV format file.
Must Learn – Ways and Steps to Import Custom Visuals in Power BI
How to Install Power BI Report Server
System Requirements
To install the report server, your system must be compatible with the system specifications given below:
- You must have any one of the following platforms – Windows 10/Windows 8/Windows 8.1/Windows Server 2012/ Windows Server 2012 R2/Windows Server 2016.
- .NET Framework 4.5.2 or later.
- SQL Server Database Engine (2008 or later). This is for storing a report server database.
- SQL Server Analysis Services (2012 SP1 CU4 or later). It is needed for your Live Analysis Services data sources.
Steps to Install Power BI Report Server
Now, let us move forward and learn the process of installing the report server.
Step 1: Go to the Microsoft Download Center from the link given below:
Download Power BI Report Server
Then, click on the Red Download button.

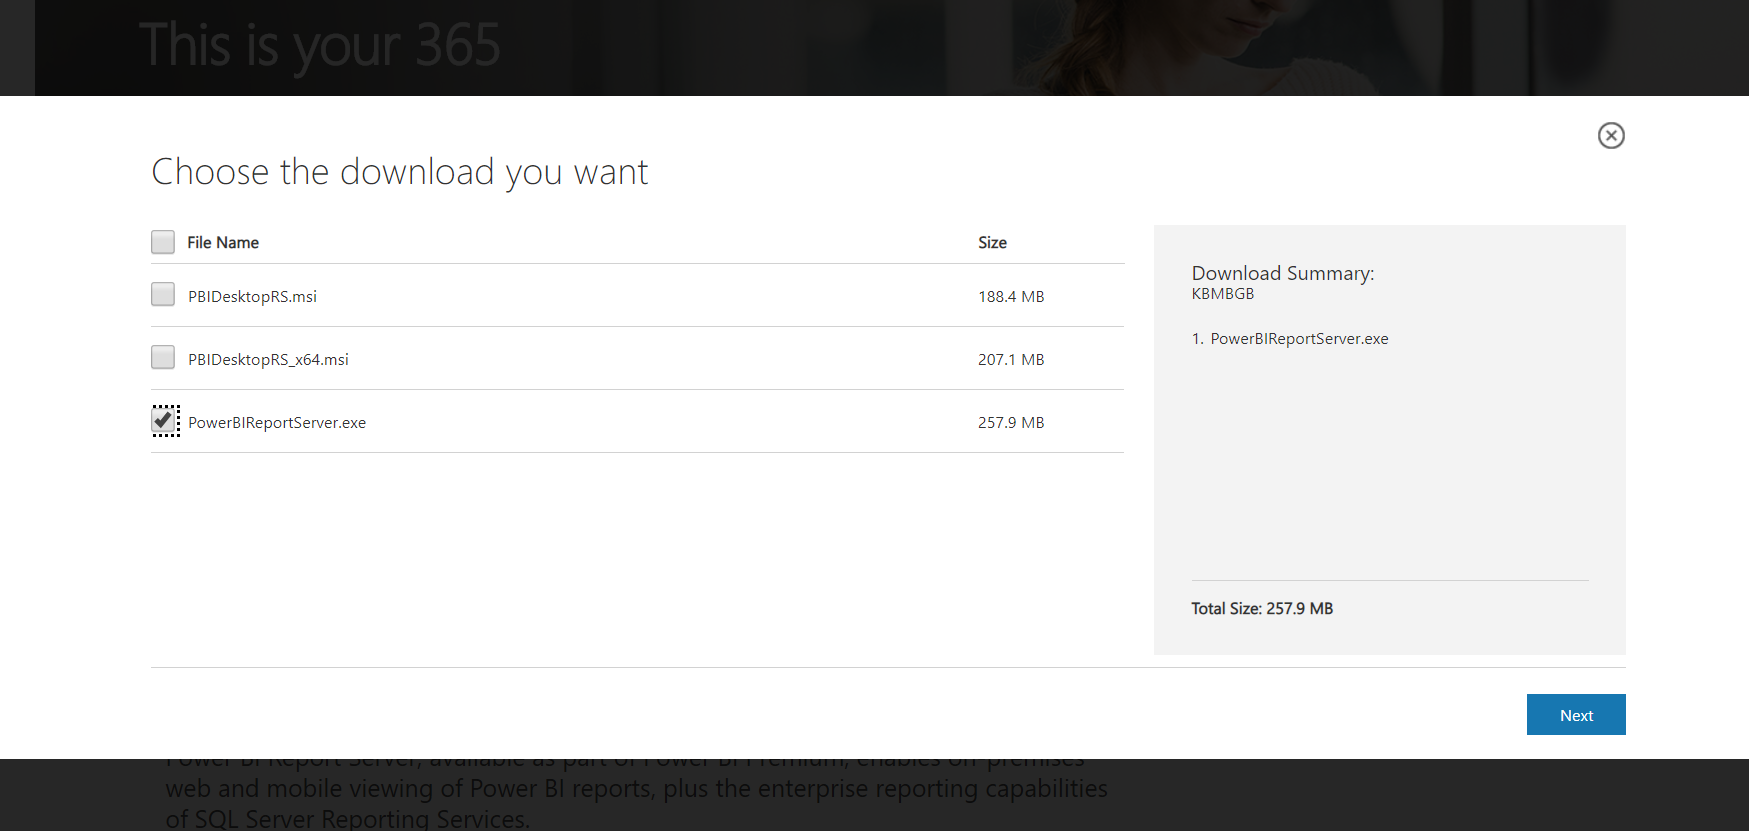
Step 2: Select the download file and click on Next.
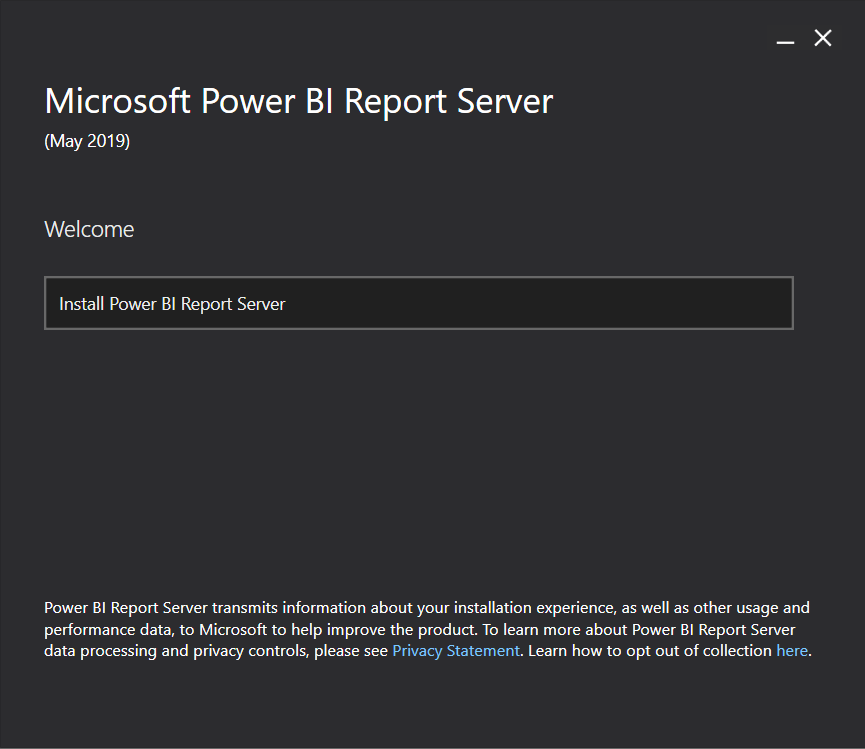
Step 3: The install wizard will start. Click on Install Power BI Report Server.
Step 4: Next, choose the edition you wish to install. You will get a free edition and a premium edition.
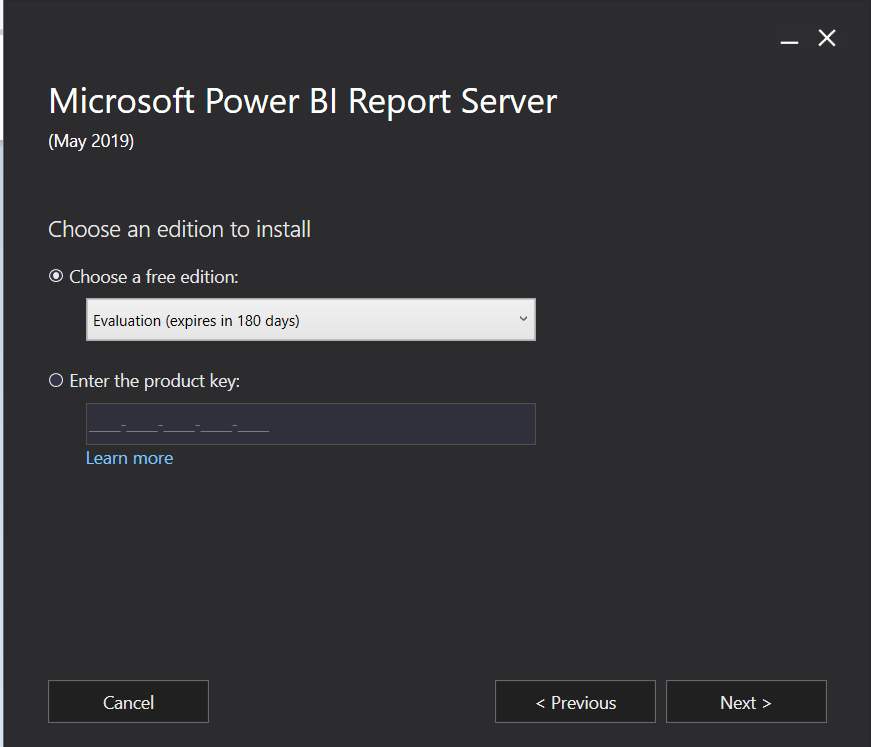
For the premium edition, you need to enter a product key. You can find the premium product key from the settings of Power BI Premium.
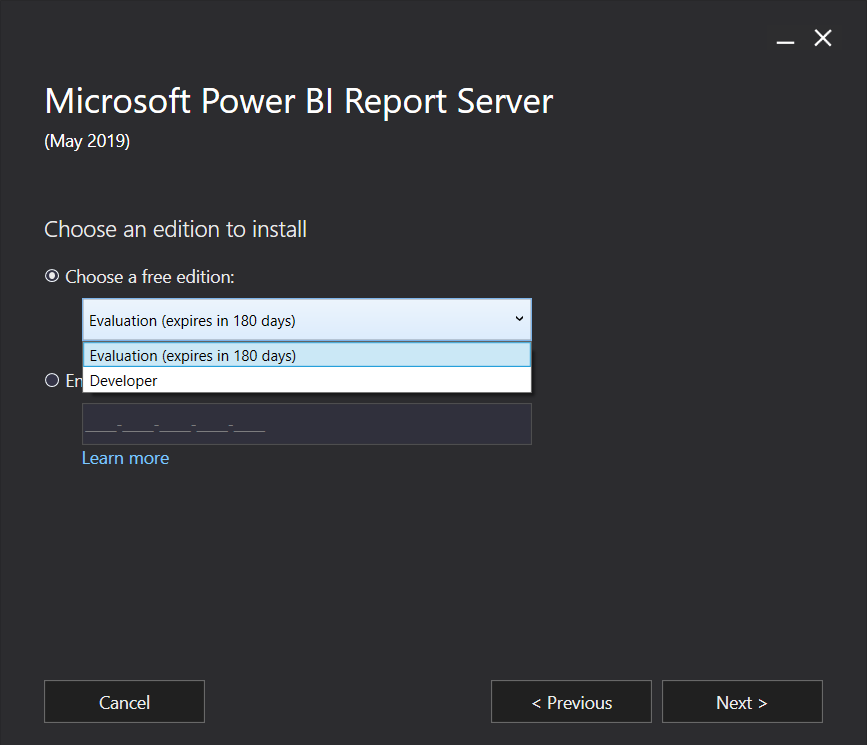
Also, there are two types of free edition; Evaluation (expires in 180 days) and Developer.
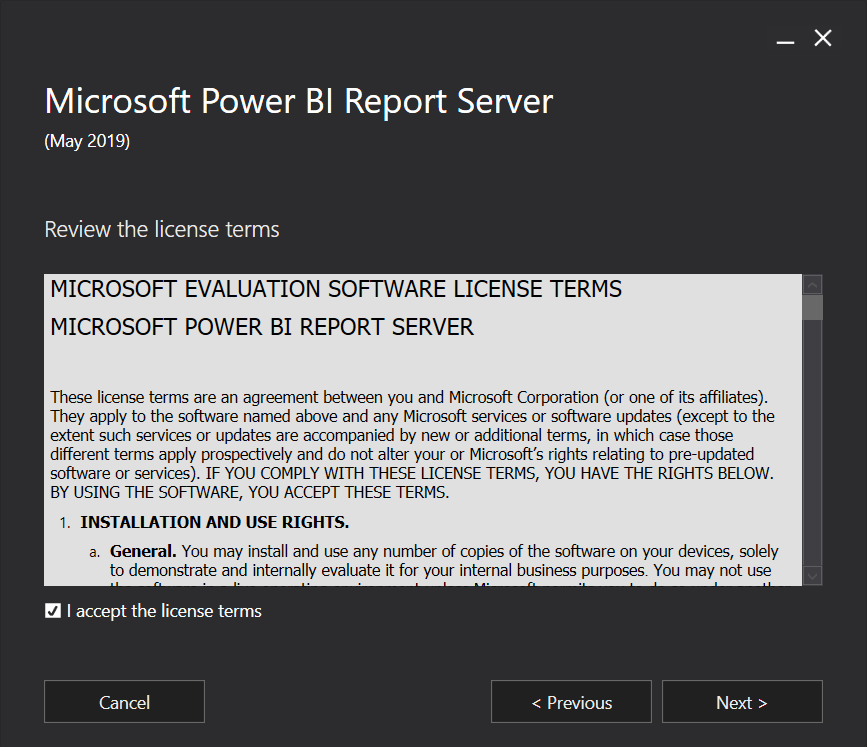
Step 5: The next window will show the license terms. Take a look, check the “I accept the license terms” and click on Next.
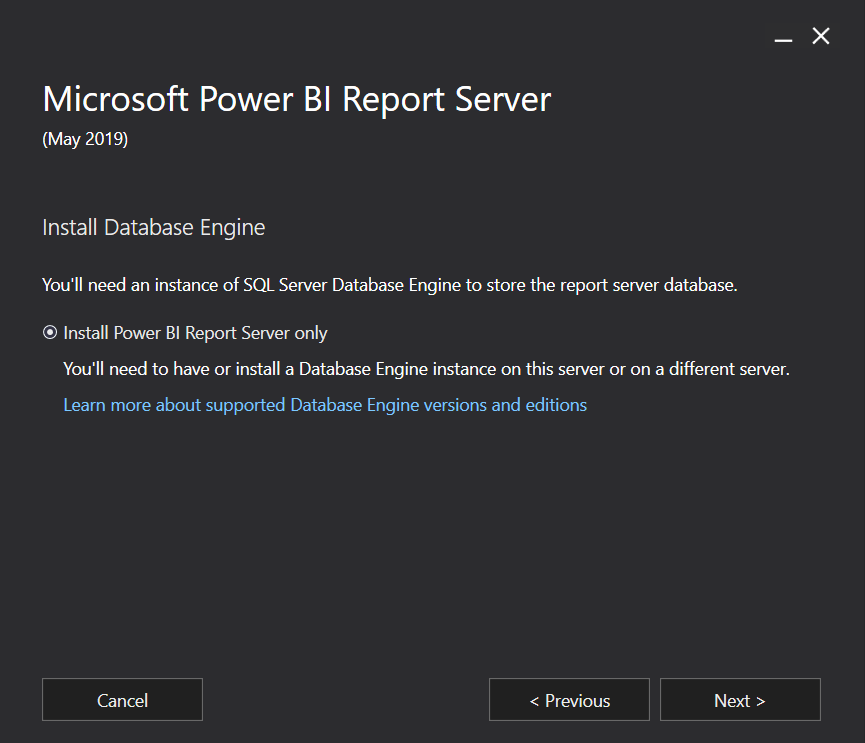
Step 6: You will require an instance of the SQL Server Database Engine. Click the radio button for “Install Power BI Report Server only” and click Next.
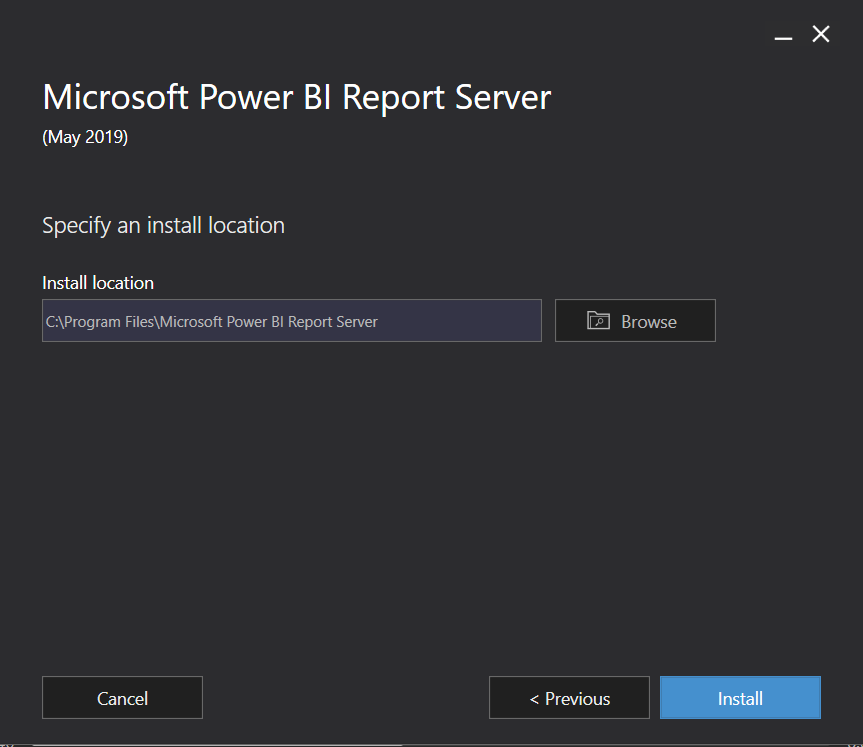
Step 7: Next, specify the install location and click on Install. The path is C:\Program Files\Microsoft Power BI Report Server.
Step 8: Click on Configure once your setup is completed.

Power BI Report Server Architecture
Have a look at the workflow diagram below to understand the architecture and working of report server better.
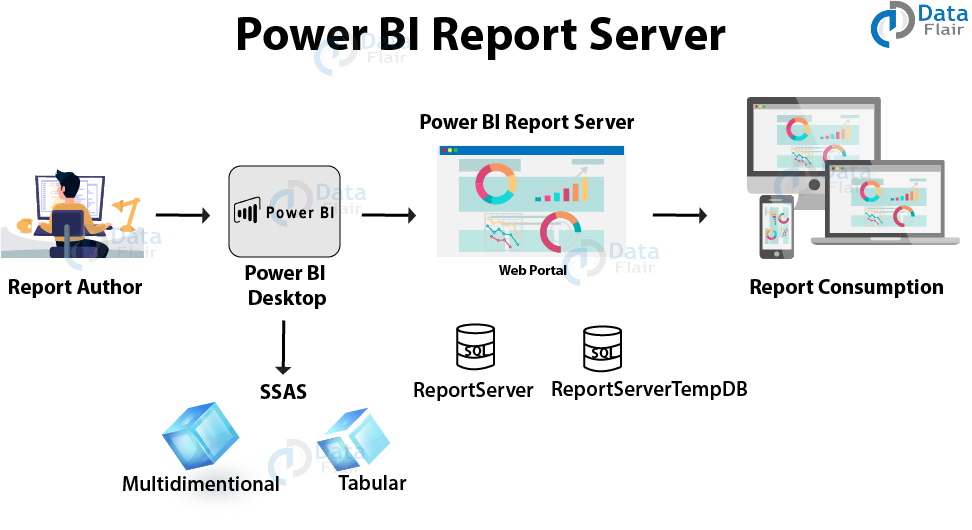
The report authors work on Power BI authoring tools such as Power BI Desktop to create reports. The reports are developed using data from data sources available to connect with Power BI. Once the reports are ready, you then go to the Report Server. The server hosts the reports and its web portal is displayed. Users can consume the reports hosted on the report server via the web portal. They can use the web portal from any device that supports it such as a desktop, laptop, tablets, and phones.
Components of Power BI Report Server
There are several important components related to the report server. Read in detail about them in the sections below:
1. Web Portal
The web portal is to display reports that are hosted on the Power BI Report Server. You can access the web portal from any latest browser. The web portal has all the reports and KPIs loaded on to the report server. You can perform several activities using the web portal such as on-demand report access, take a subscription for published reports, apply custom brandings to the web portal, and schedule report processing. There is varied content on the web portal such as Power BI reports, mobile reports, paginated reports, KPIs and Excel workbooks. These different report types are arranged in the same order in a traditional folder hierarchy. Reports are grouped by report types as mentioned earlier. You can also access shared datasets and shared data sources via separate folders in the portal.
2. Power BI Reports
The most important part of the entire concept is the Power BI reports. Power BI reports are multi-paged informative file representing a data model through visualizations. Power BI Desktop has loads of visualization types which you can use to create the report. You can have as many pages in a report with as many visualizations, you want to use.
You can create reports (.pbix) on a Power BI Desktop (optimized for report server). Later you can publish these Power BI reports on the web portal for others to view and use. Business users and other types of users can extract essential knowledge and insights from these reports.
There are two more types of reports hosted in the report server and they are:
- Paginated Reports
- Mobile Reports.
- Paginated Reports
A paginated report is an organized, document style page to page report. The extension used for a paginated file is .RDL. Paginated reports are saved as paged documents where you can expand the document vertically and horizontally to view the complete data. Such reports are pixel-perfect with a fixed layout. They can be the best options when you want to print a report from a PDF or Word file.
- Mobile Reports
Another type of reports that the server hosts and shares on its web portal are the mobile reports. These are like Power BI Reports but adaptable to the screen of the mobile device you are viewing them on.
Don’t forget to check – How to apply Filters to Power BI Reports
Latest Power BI Report Server Features – January 2019 Update
The latest version of the report server is the January 2019 update. We have listed a few good and new features of its latest version here:
- Row-level security
- Scatter charts supporting dot plot layout
- Built-in report themes
- Filter cards in search
- Improves report accessibility
- Helps in improving DAX editor
- Improve modeling accessibility
- New DAX functions such as NonVisual functions, IsInScope function.
- New transport layer security settings
- Better keyboard shortcuts dialog
Features like expanding and collapsing matrix row headers, copy values and selections from table and matrix, set tab order, the tooltip for button visuals, etc. are also added.
Summary
This was all you need to learn about the Power BI Report Server. In this article, we took a brief look at its core concepts such as features, installation process, architecture, and components. We hope our explanation helped you learn in detail about it.
It’s time to explore the next article – Power BI DAX Tutorial
In case of any query or suggestion, share your views in the comment section below.
Did you like this article? If Yes, please give DataFlair 5 Stars on Google


