Power BI Architecture – 7 Components Explained with Working
Placement-ready Courses: Enroll Now, Thank us Later!
In order to learn technology, you must be handy with its architecture. If you are not aware of the architecture of the technology, you won’t be able to become a master of it. Under this Power BI architecture tutorial by DataFlair, we’re going to learn from the basics then we will gradually move upwards, learn about its components and how it works. We’ll also understand how does the front end and back end of Power BI work to provide all its unique functionalities and features for data analysis.
Let’s start and have a thorough understanding of the concept.
Power BI Architecture
Power BI is a business suite that includes several technologies that work together. To deliver outstanding business intelligence solutions, Microsoft Power BI technology consists of a group of components such as:
- Power Query (for data mash-up and transformation)
- Power BI Desktop (a companion development tool)
- Power BI Mobile (for Android, iOS, Windows phones)
- Power Pivot (for in-memory tabular data modeling)
- Power View (for viewing data visualizations)
- Power Map (for visualizing 3D geo-spatial data)
- Power Q&A (for natural language Q&A)
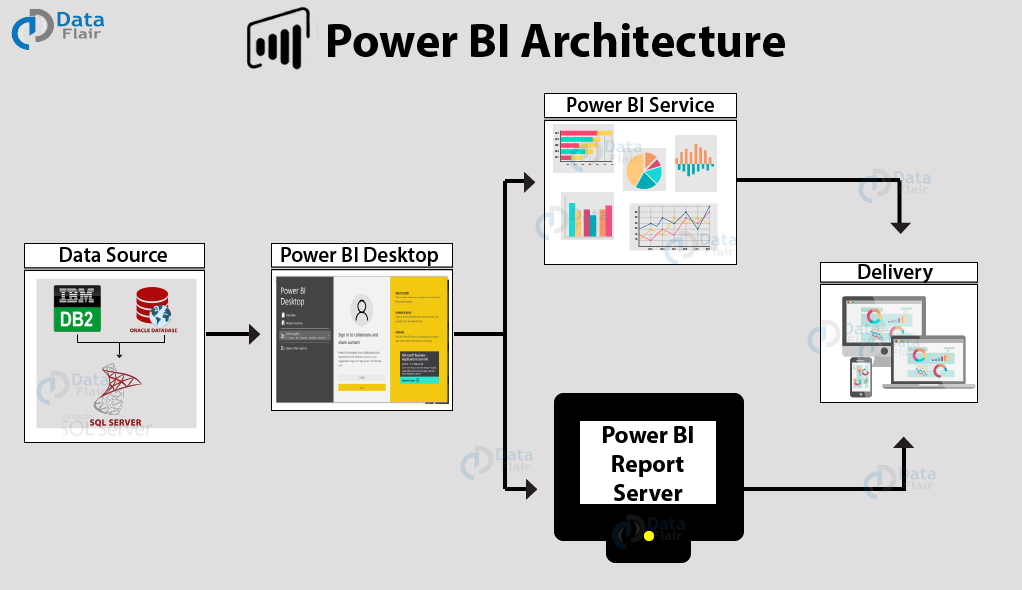
In simple terms, a Power BI user takes data from various data sources such as files, Azure source, online services, DirectQuery or gateway sources. Then, they work with that data on a client development tool such as Power BI Desktop. Here, the imported data is cleaned and transformed according to the user’s needs.
Once the data is transformed and formatted, it is ready to use in making visualizations in a report. A report is a collection of visualizations like graphs, charts, tables, filters, and slicers.
Moving on to the chain of processes, you can publish the reports created in Power BI desktop on two kinds of platforms; Power BI Service and Power BI Report Server.
Power BI Service is a cloud-based public platform whereas Power BI Report Server is an on-premise platform protected by firewall security.
You can create dashboards on these platforms by pinning visualizations from your published reports. Lastly, share your dashboards and reports and collaborate with other users from your organization or outside, using delivery options like a web-browser, Power BI on iPad, tablets, laptops, phones, etc.
Components of Power BI Architecture
Let us learn about the components of Power BI architecture in detail.
1. Data Sources
An important component of Power BI is its vast range of data sources. You can import data from files in your system, cloud-based online data sources or connect directly to live connections. If you import from data on-premise or online services there is a limit of 1 GB. Some commonly used data sources in Power BI are:
- Excel
- Text/CSV
- XML
- JSON
- Oracle Database
- IBM DB2 Database
- MySQL Database
- PostgreSQL Database
- Sybase Database
- Teradata Database
- SAP HANA Database
- SAP Business Warehouse server
- Amazon Redshift
- Impala
- Google BigQuery (Beta)
- Azure SQL Database
- Salesforce Reports
- Google Analytics
- GitHub
You must learn about Power BI Data Sources thoroughly
2. Power BI Desktop
Power BI Desktop is a client-side tool known as a companion development and authoring tool.
This desktop-based software is loaded with tools and functionalities to connect to data sources, transform data, data modeling and creating reports.
You can download and install Power BI Desktop in your system for free. Using Power BI Desktop features, one can do data cleansing, create business metrics and data models, define the relationship between data, define hierarchies, create visuals and publish reports.
3. Power BI Service
Power BI Service is a web-based platform from where you can share reports made on Power BI Desktop, collaborate with other users, and create dashboards.
It is available in three versions:
- Free version
- Pro version
- Premium version
Power BI Service is also known as, “Power BI.com”, “Power BI Workspace”, “Power BI Site” and “Power BI Web Portal”. This component also offers advanced features like natural language Q&A and alerts.
4. Power BI Report Server
The Power BI Report Server is similar to the Power BI Service. The only difference between these two is that Power BI Report Server is an on-premise platform. It is used by organizations who do not want to publish their reports on the cloud and are concerned about the security of their data.
Power BI Report Server enables you to create dashboards and share your reports with other users following proper security protocols. To use this service, you need to have a Power BI Premium license.
Want to learn more about it? Check out the Power BI Report Server Tutorial
5. Power BI Gateway
This component is used to connect and access on-premise data in secured networks. Power BI Gateways are generally used in organizations where data is kept in security and watch. Gateways help to extract out such data through secure channels to Power BI platforms for analysis and reporting.
Wait! Have you checked our Tutorial on Power BI Gateway
6. Power BI Mobile
Power BI Mobile is a native Power BI application that runs on iOS, Android, and Windows mobile devices. For viewing reports and dashboards, these applications are used.
7. Power BI Embedded
Power BI Embedded offers APIs which are used to embed visuals into custom applications.
Working of Power BI Architecture
Now that we have understood the individual components of Power BI, let us learn how do all of these components work in tandem. We will understand the Power BI architecture with the help of this diagram.
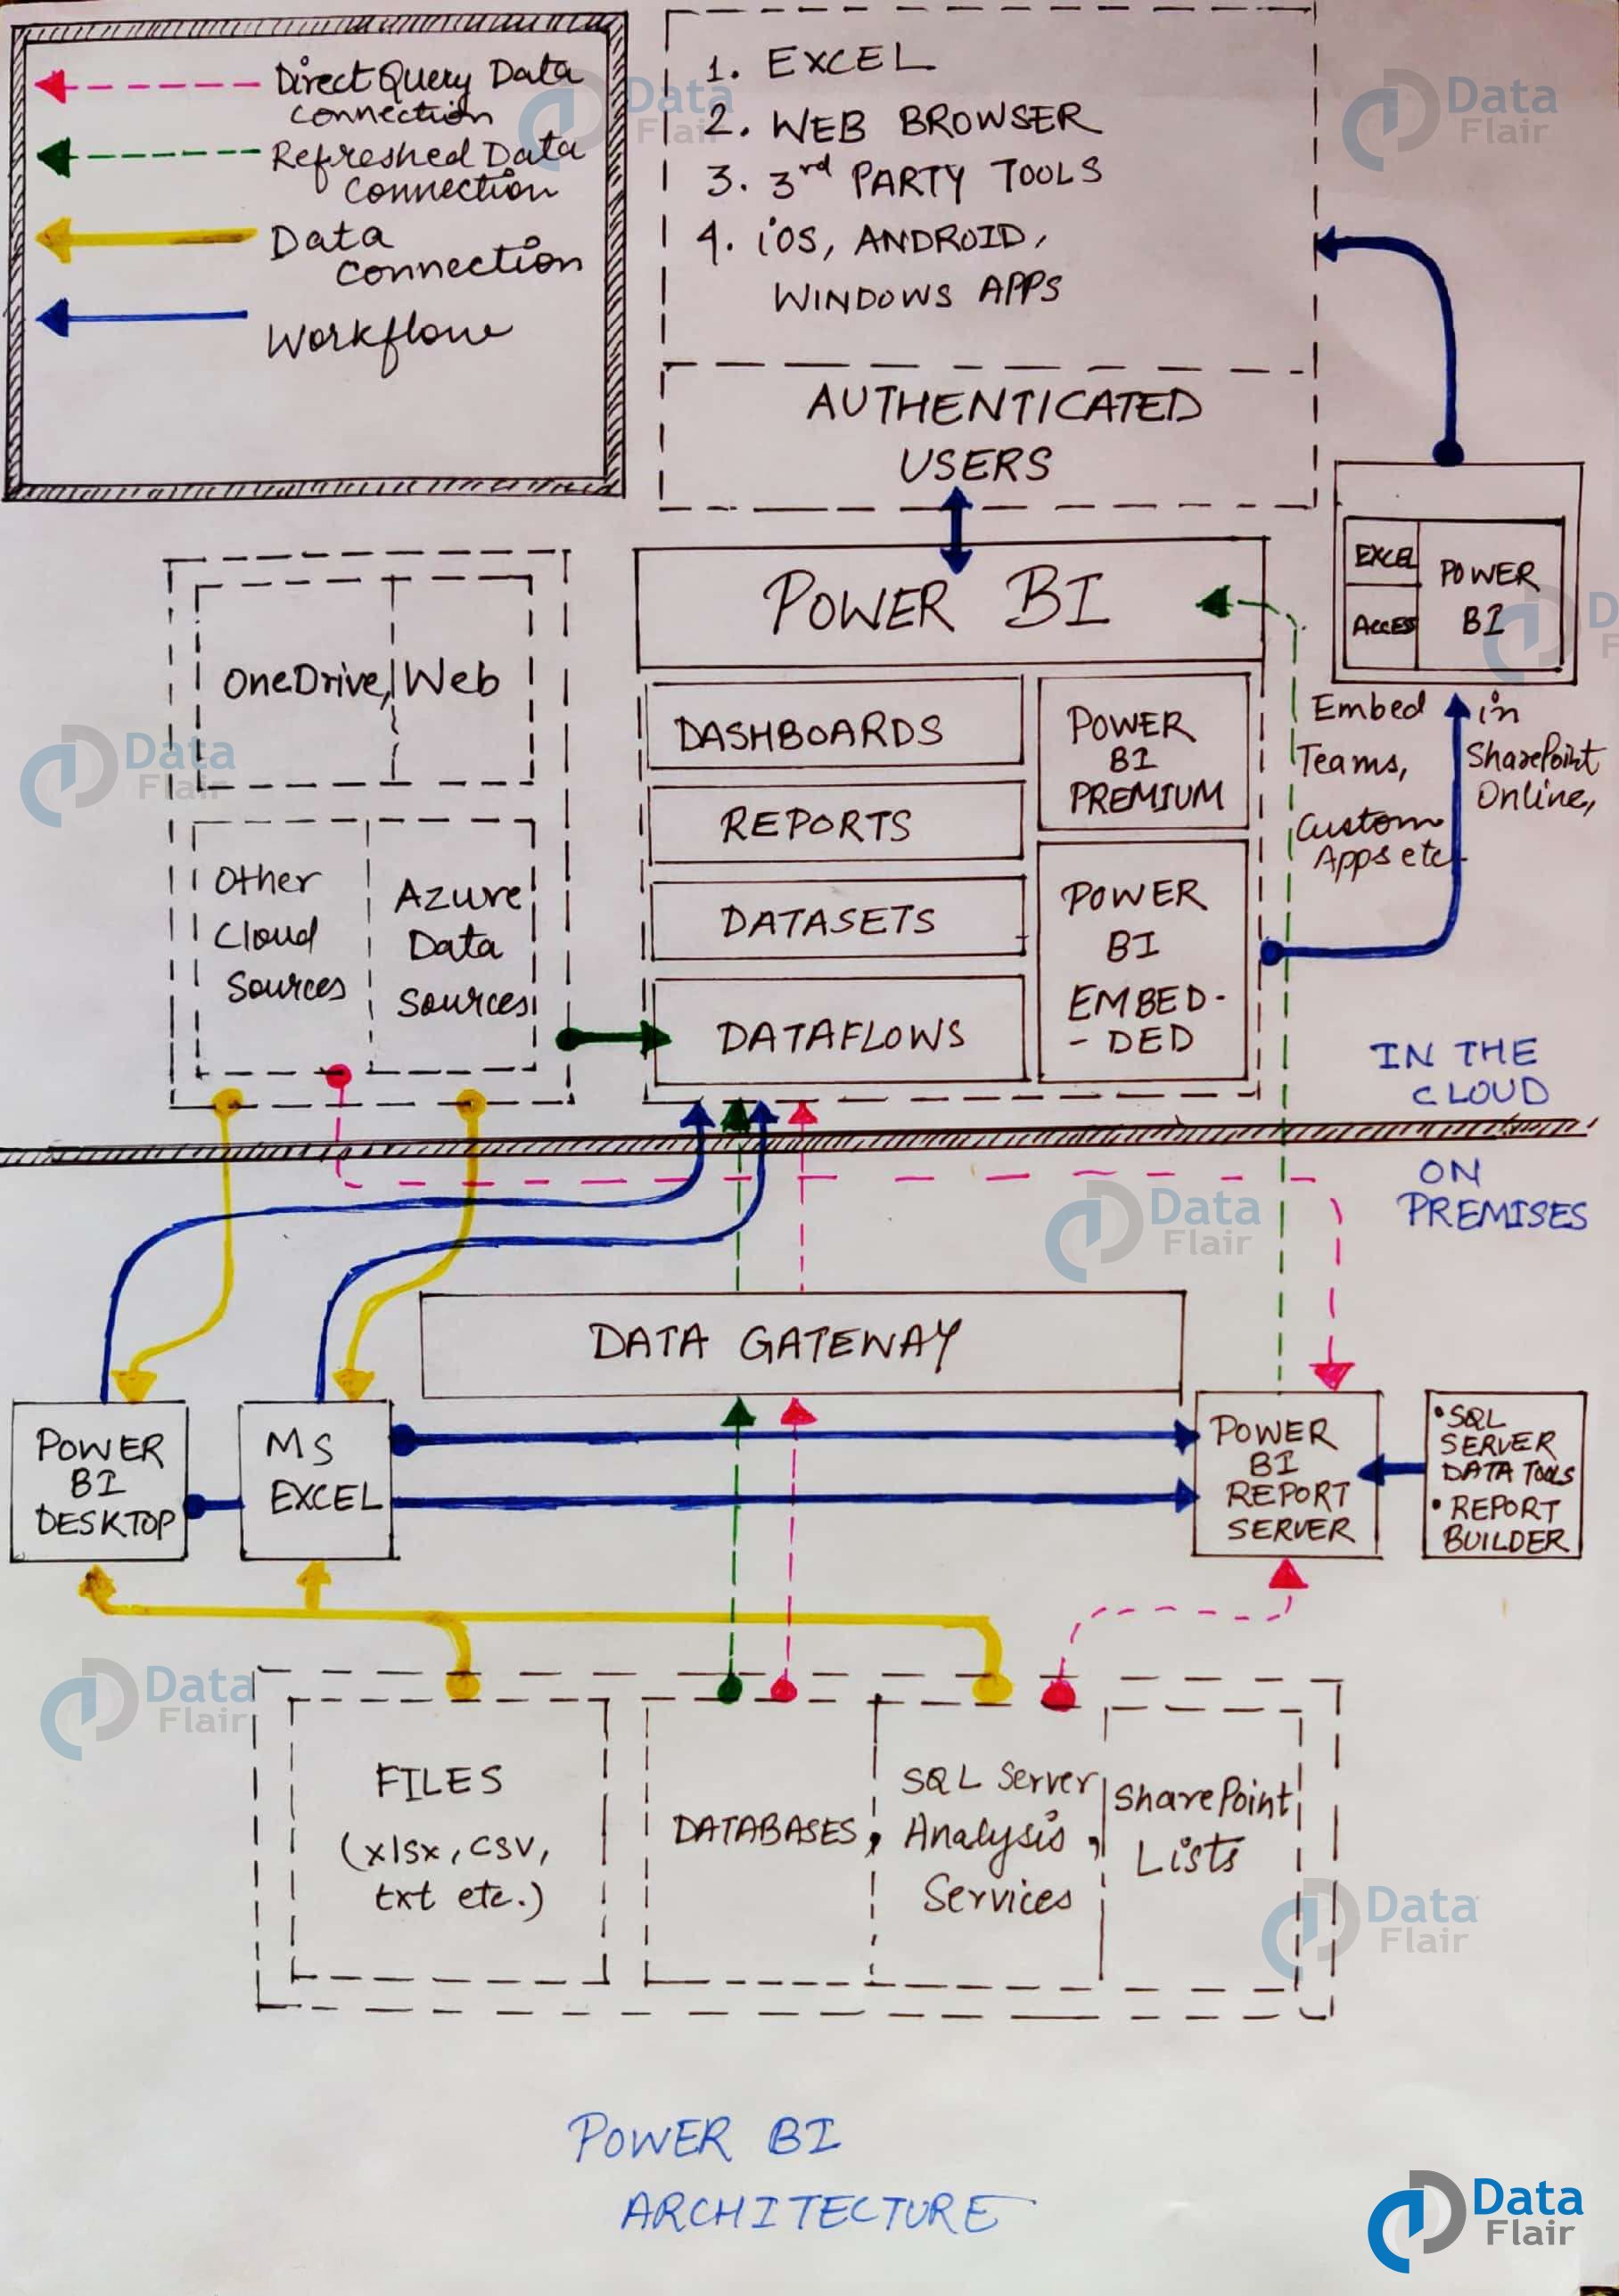
If you look closely, the diagram has numbering done on each component in the architecture. Also, note that the lower half part is the on-premise part and the upper half part depicts the on-cloud services.
To begin with, what forms the starting point or source of all the data flowing into Power BI components are the data sources. Power BI has the get data feature using which you can connect to different kinds of data sources like files, on-premise or on-cloud databases, direct connections, etc. Data connections are established from these data sources to authoring tools such as Power BI Desktop.
On-Premise
Power BI Desktop is a companion development, authoring, and publishing tool. You can import data from data sources to Power BI Desktop and use it to create reports and then publish them on a Power BI Service or Power BI Report Server.
You can also publish Excel workbooks directly using Power BI Publisher for Excel to the Power BI Report Server. The SQL Server Data tools and Report Publisher help in creating datasets, KPIs, mobile reports, paginated reports, etc. The reports from all kinds of reports are published to the Power BI Report Server from where they are distributed to the end-users.
On-Cloud
An important component in Power BI architecture is the Power BI Gateway. The Power BI Gateway acts as a secure channel to transport data from on-premise data sources to on-cloud apps or sites.
On the cloud side of the architecture, resides a lot of components. Like a complete Power BI suite having dataflows, datasets, dashboards, reports, Power BI Embedded, Power BI Premium, etc. You can embed your reports and dashboards into Teams, SharePoint, custom applications, etc. There are on-cloud data sources as well that connects to Power BI tools via direct connections.
At last, there is a layer of authenticated users who share the published reports and dashboard and collaborate with one another to make educated decisions based on the insights. There are different kinds of users who consume Power BI reports and dashboards and connect through web browsers, Excel, third-party tools, and mobile devices (iOS, Windows, Android apps).
Power BI Service
As we have learned in the earlier sections, all the reports that you create in Power BI Desktop are published on a cloud platform known as Power BI Service.
Users can access the reports and dashboards from Power BI Service using client platforms like websites, mobile devices, etc. This means that every client who wants to access content created on Power BI needs to interact with Power BI Service. And so, we must take a look under the hood and learn how Power BI Service works.
Power BI Service’s architecture consists of two parts:
- A front end
- A back end
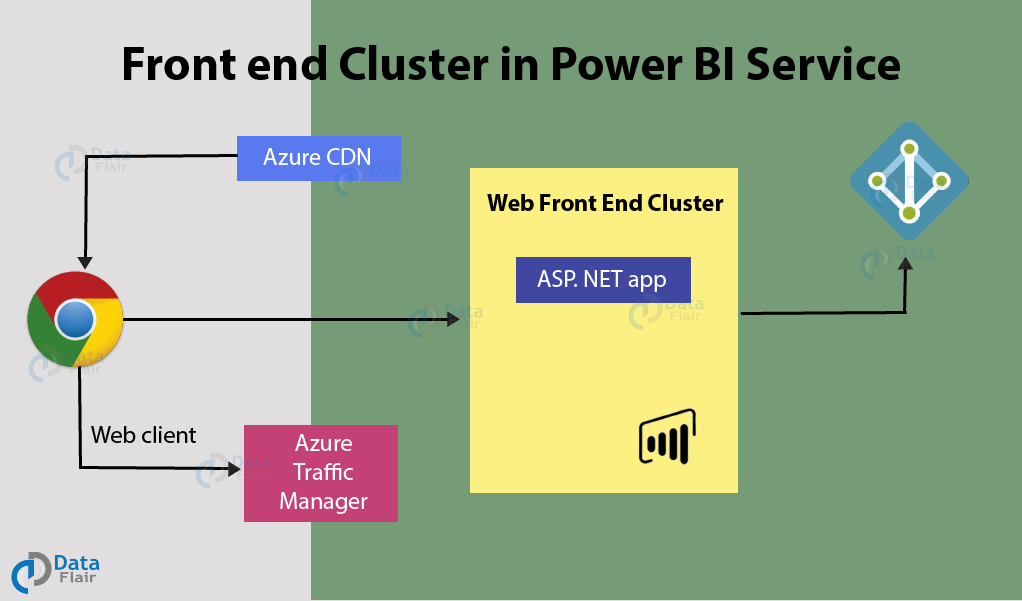
Front End cluster
The front end also called the web front-end cluster acts as an intermediary between clients and the back end. The front end services are used for establishing an initial connection and authenticating clients using Azure Active Directory. The Azure Active Directory stores user identities.
Along with this, Azure Traffic Manager is used to direct user requests to the nearest data center after authentication. Once a client/user is authenticated, the Azure Content Delivery Network (CDN) distributes static Power BI content/files to users.
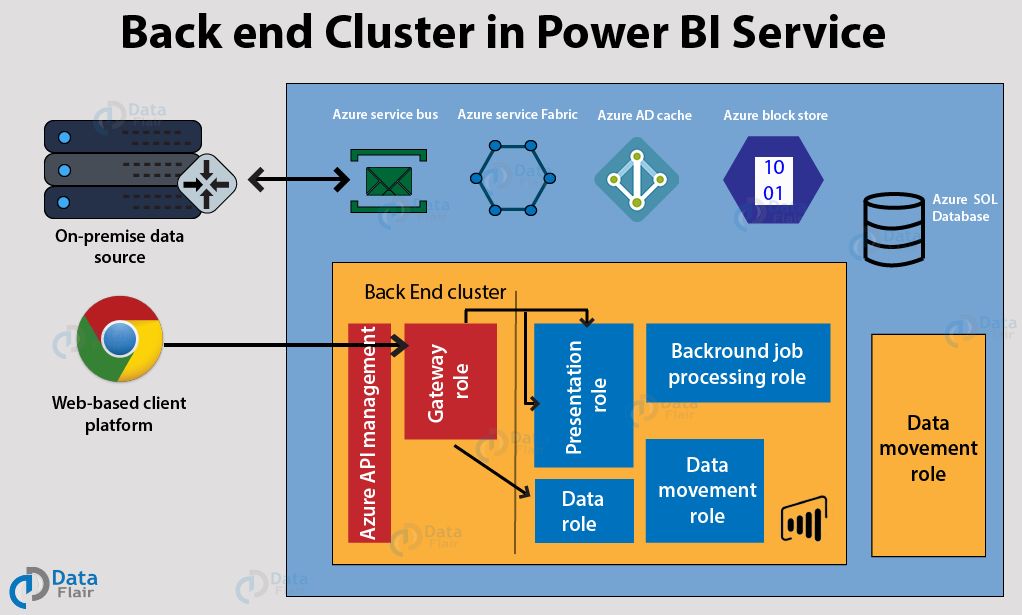
Back End Cluster
The Power BI services at the back end take care of visualizations, datasets, storage, reports, data connections, data refreshing, and other interactions with Power BI. At the back-end, a web client has only two direct points of interaction, Azure API Management, and Gateway Role. These two components are responsible for load balancing, authentication, authorization, routing, etc.
Working of Power BI Service
- Power BI stores its data in two main repositories; Azure block storage and Azure SQL database. Azure block storage stores the datasets uploaded by users and all the metadata and system-related data is stored in the Azure SQL database.
- After Azure API Management authenticates a user request, it is sent to the Gateway Role. The Gateway Role processes the requests and directs them to suitable components like Presentation Role, Background Job Processing Role, Data Role, and Data Movement Role.
- For instance, the Presentation Role handles all the visualization related queries like for dashboards and reports.
- For all the data related queries, the request is sent by the Gateway Role to the Data Role or Data Movement Role.
- Power BI Service back end uses Azure Service Bus to connect on-premise datasources with the cloud. Azure Service Bus receives all the requests to fetch data from the on-premise data source. Then it processes the request and executes the query on the on-premise data source to retrieve data from it to the cloud service.
- The Azure Service Fabric manages all the microservices and components associated with running Power BI.
- Azure AD Cache helps in real-time reporting using the data stored in the in-memory of the Power BI system.
Summary
This concludes our tutorial on Power BI architecture. Here, we learned about all the important components of Power BI architecture, saw how they work together. We also learned in detail about the functioning of the Power BI Service and understood its working.
Time to move ahead to the next article by DataFlair – Power BI Components
We hope this information was helpful. Do leave your valuable feedback in the comment section below. In case of any difficulties, our experts will help you in the best possible way.
We work very hard to provide you quality material
Could you take 15 seconds and share your happy experience on Google


Hi Team,
I can’t able connect oracle from Power bi report builder.
The before version of your blog was awesome. In this version I am troubling to find sub topics, also you removed the list which used to see left side so that shuffling was quite easy, but now it see difficult to find topics.