Microsoft Power BI Features – Reasons Why Power BI is a Leader in its Field!
We offer you a brighter future with industry-ready online courses - Start Now!!
Moving forward in our Power BI DataFlair tutorials series, let us explore some important features of Power BI thoroughly. Power BI is an efficient business intelligence tool loaded with data visualization and analytics rich features.
Let’s start with the basic concept behind Power BI.
What is Microsoft Power BI?
Microsoft Power BI is a suite that is a collection of business intelligence tools such as software services, apps and data connectors. It is a cloud-based platform used to consolidate data from varied sources into a single data set. These data sets are used for data visualization, evaluation, and analysis by making sharable reports, dashboards, and apps. Microsoft offers three types of Power BI platforms i.e. Power BI Desktop (a desktop application), Power BI Service (SaaS i.e., Software as a Service) and Power BI Mobile (for iOS and Android devices).
Power BI can be deployed both on-premise and on-cloud. It can also import data from local databases/data sources, cloud-based data sources, big data sources, simple Excel files, and other hybrid sources. Thus, Power BI, a leader amongst a lot of other BI tools proves to be an efficient and user-friendly tool for data analysis. It enables the users to consolidate data from multiple sources, make interactive dashboards, evaluate data, create informative reports and share it with other users.
Now, we will move on to features of Power BI.
Wait a Minute! Have you checked the Power BI Tutorial
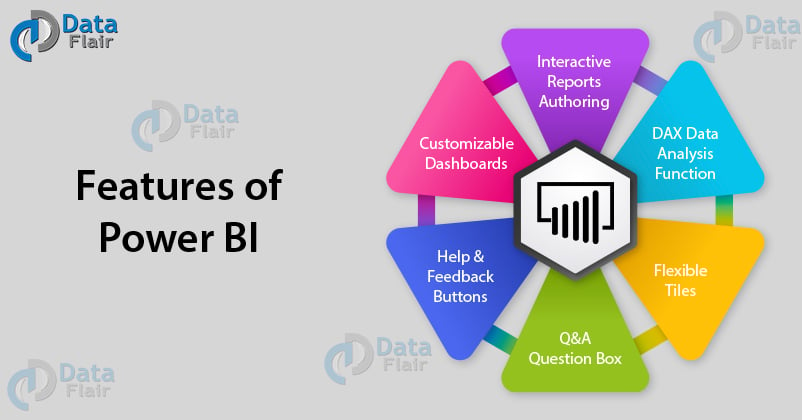
Features of Power BI
The unique features of Power BI are as follows:
1. Range of Attractive Visualizations
Visualizations i.e. the visual representation of data plays a central role in Power BI. It offers a wide range of detailed and attractive visualizations. You can create reports and dashboards using as simple or as complex visualizations as you want to represent your data set with. There is also a library available for custom visualizations.
In Power BI you can create visualizations such as:
- Stacked bar chart
- Stacked column chart
- Clustered bar chart
- Clustered column chart
- 100% stacked column/bar chart
- Line chart
- Area chart
- Stacked area chart
- Ribbon chart
- Waterfall chart
- Scatter chart
- Pie chart
- Donut chart
- Treemap chart
- Map
- Filled map
- Funnel chart
- Gauge chart, etc
2. Get Data (Data Source)
Get Data feature lets Power BI users to select from a range of data sources. The data sources are anywhere in the spectrum from on-premise to cloud-based, unstructured to structured. New data sources are added every month.
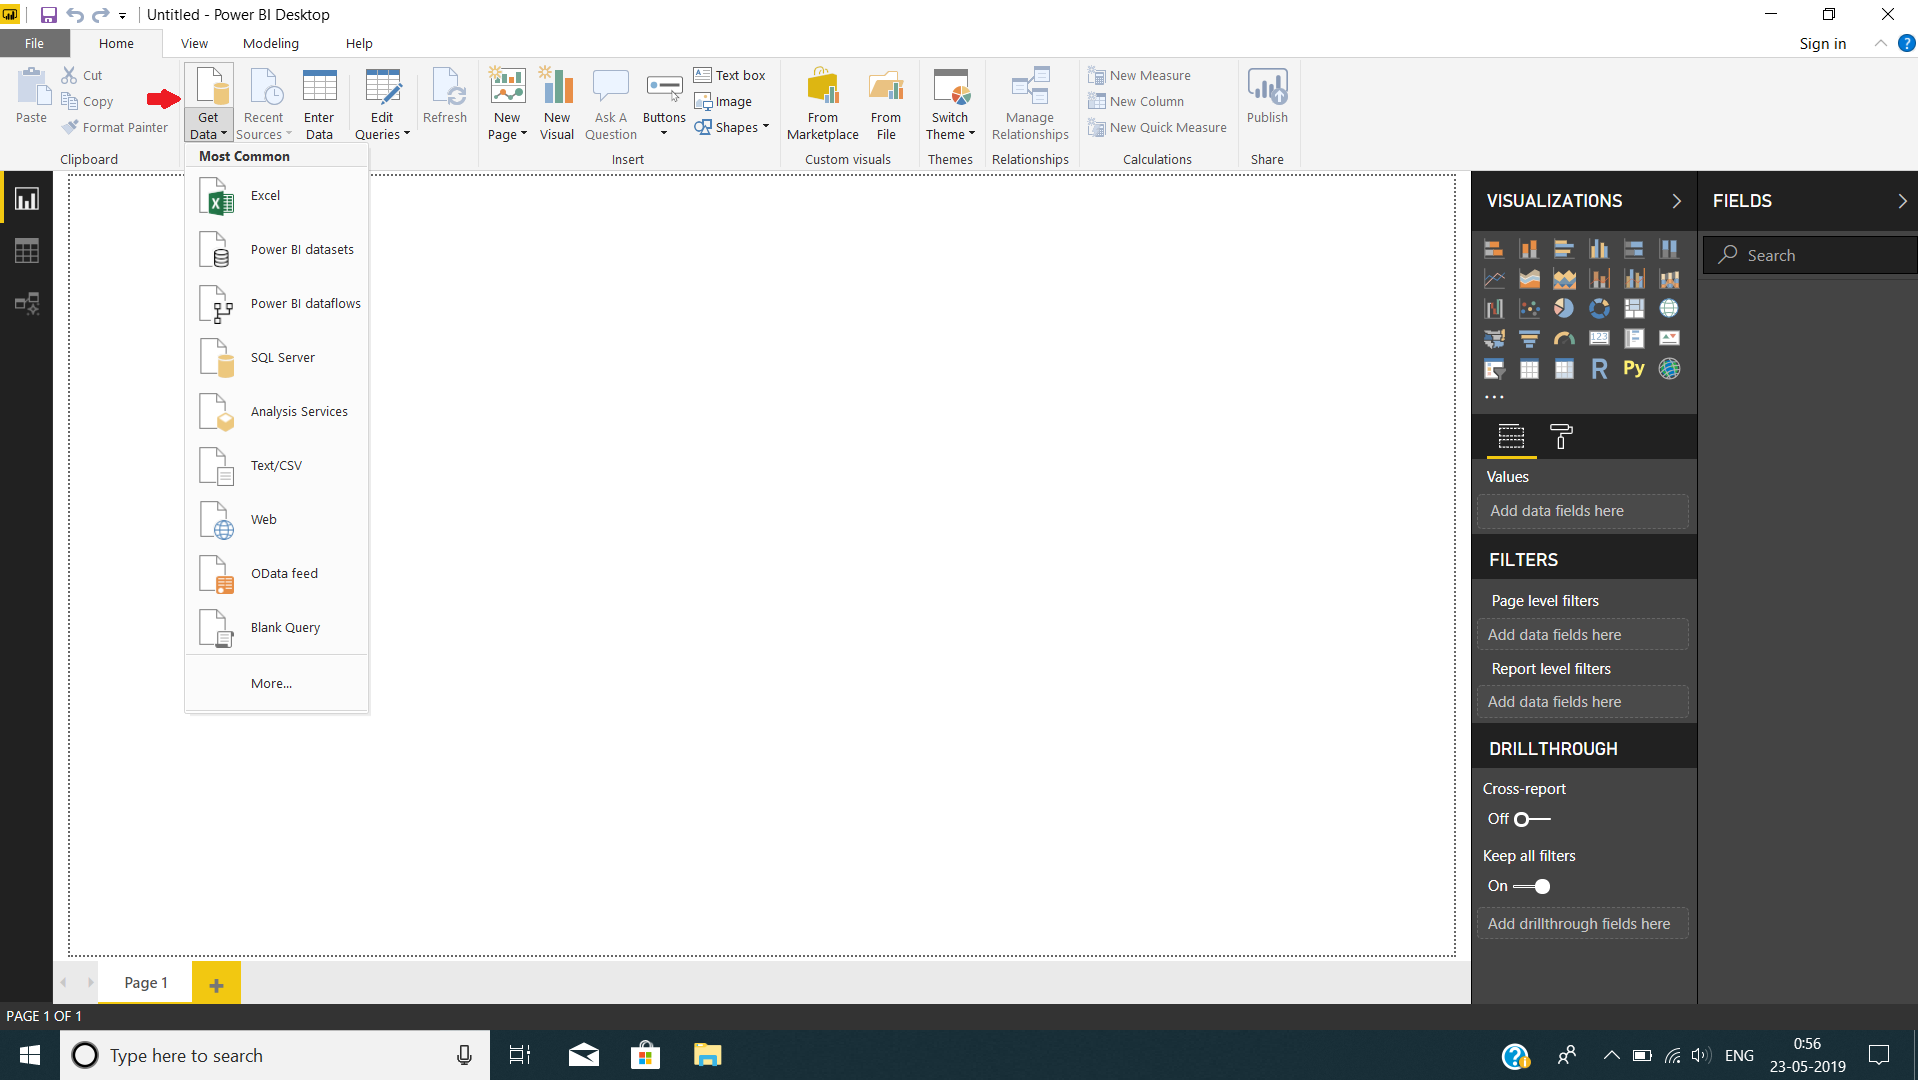
Some of the latest available data sources are as follows:
- Excel
- Power BI datasets
- Power BI dataflows
- SQL Server
- MySQL database
- Analysis Services
- Azure
- Text/CSV
- Oracle
- Access
- XML
- JSON
Don’t forget to check – Power BI Data Modeling
3. Datasets Filtration
Dataset is a single set of data created as a result of taking data from multiple data sources. You can use the datasets to create visualizations of different kinds. A dataset can be made of data taken from a single source like an Excel workbook or from more than a data source.
You can filter the datasets and have smaller subsets containing only the important data and contextual relevance. Power BI provides the users with a wide range of in-built data connectors such as Excel, SQL database, Oracle, Azure, Facebook, Salesforce, MailChimp, etc. Users can easily connect to such data sources and create datasets by importing data from one or more sources.
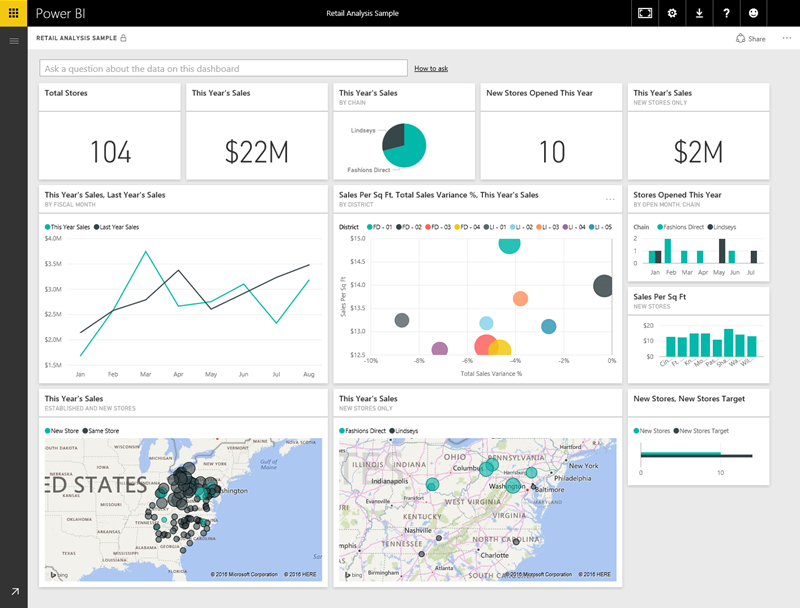
4. Customizable Dashboards
Dashboards are a collection of visualizations offering meaningful information or insights into data. Typical dashboards in Power BI are composed of multiple visualizations as tiles. They are single pages from the reports. The dashboards are shareable as well as printable.
Learn to create Power BI dashboard in 10 mins
5. Flexible Tiles
A tile is a single block containing a visualization in a Power BI dashboard. Tiles segregate each informative visualization properly to provide a clearer view. These tiles can be adjusted and the size can also be changed. Also, they can be placed anywhere on the dashboard as per the users’ convenience.
6. Navigation Pane
The navigation pane has options of datasets, dashboards, and reports. Users can conveniently work in Power BI and navigate between datasets, dashboard they are working on, and reports they are creating.
7. Informative Reports
Reports in Power BI are a combination of dashboards having a different kind of visualizations relevant to a particular business topic. A report shows a complete and structured presentation of data represented in different ways and revealing important insights from the data. Users can easily share reports created on Power BI with other users.
Explore the Power BI Report Server Programming Highlights
8. Natural Language Q & A Question Box
The Natural Language Q&A i.e. question and answer box is a unique feature of Power BI. Using the Q&A box, a user can ask questions in natural language to search for data and information available in Power BI system. The cognitive engines of Power BI will search for the data or visualization or a part of the report that is been searched for and return it to the user. The cognitive technology uses rephrasing, autofill, suggestions and other such techniques to fulfill the search requirements of users.
9. DAX Data Analysis Function
The DAX functions are the Data Analysis Expressions found in Power BI. These analysis functions are predefined codes to perform analytics specific functionalities on data. There are about 200 functions in the Power BI function library as of now. The creators keep on adding new ones.
10. Help & Feedback Buttons
Help & feedback buttons are used for multiple setting options such as downloading, asking for support and assistance, giving feedback to the Power BI support team, etc.
11. Office 365 App Launcher
Using this option, users can automatically launch Microsoft Office 365 apps.
12. Great Collection in Content Packs
Power BI offers content packs which contain dashboards, data models, datasets, embedded queries, etc. Users can directly use a collection of elements in content packs instead of looking for elements separately.
Summary
Have a quick look at the features of Power BI that we discussed and some extra ones.
- Customizable dashboards
- Datasets
- Reports
- Navigation Pane
- Q&A Question Box
- Help & Feedback Buttons
- Ad Hoc Reporting
- Ad Hoc Analysis
- Online Analytical Processing (OLAP)
- Trend Indicators
- Interactive Reports Authoring
- Complete Reporting & Data Visualization Tools
This concludes our tutorial on features of Power BI. We hope the information we provided was helpful enough for you. Keep exploring the new tutorials and concepts on Power BI in the coming days.
The secret formula to crack your Power BI interview in first attempt – Power BI Interview Questions
Did you know we work 24x7 to provide you best tutorials
Please encourage us - write a review on Google


it is super wonderful lesson thank you so much for your info
Well put knowledgeable content, thank you
I have studied and applied the skill in real world and really it is very constructive and knowledgable in which data insights shows the meaningful information.