Power BI Case Study – How the tool reduced hassles of Heathrow & Edsby
We offer you a brighter future with industry-ready online courses - Start Now!!
Power BI Case Study – In this article, we are going to throw some light on the usefulness of Power BI in different sectors and domains of the industry. We will discuss case studies of three companies namely, GE Healthcare, Heathrow and Edsby.
30+ Power BI Tutorials to ease your way of becoming a Power BI Expert
Let’s start!
Power BI Case Study
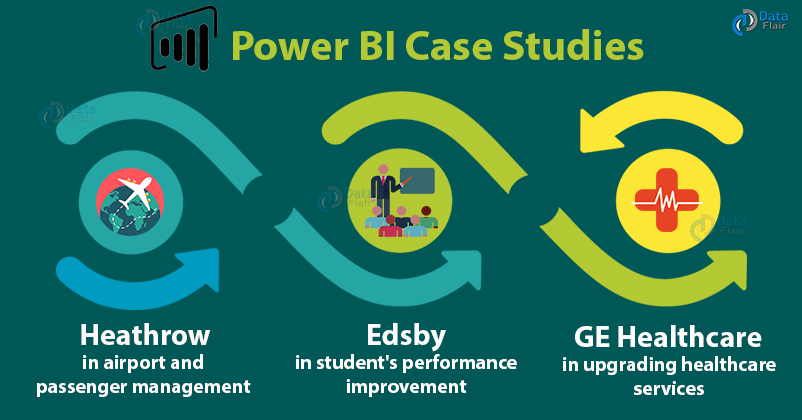
Here is the detailed information of all the case studies of Power BI. Let’s begin by GE Healthcare.
Power BI Case Study 1: Heathrow
Heathrow airport is an international airport in London. It is the second busiest international airport in the world after Dubai international airport. And, also the seventh-largest in terms of total passenger traffic.
The challenge
![]()
Being the world’s seventh busiest airport in overall passenger traffic, one can only imagine the level of efficiency and efforts expected from the airport’s ground management to keep the airport functioning properly. Managing over 2,00,000 passengers every day can be quite a challenging task for airport authorities and ground staff. Every department needs to be in absolute coordination and sync to be able to manage the passenger traffic and give them a smooth experience at the airport. At such busy airports, every day brings new challenges and uncertainties with it. Unexpected disruptions in the smooth workflow of operations at the airport disturb the entire functioning. Issues can arise due to stormy weather, delayed flights, canceled flights, shifts in jet streams, etc. disturbing the airport’s smooth functioning. Such problems send the passengers as well as airport employees into turmoil.
The airport needed a central digitalized management system as a solution to this problem. Such a system would use the large amounts of data being produced by operational systems at the airport and transform it into useful visual insights. The interpretations produced by the BI tool can be used by airport staff for better functioning and passenger management.
The change
Heathrow group went with Microsoft Power BI as their business intelligence software and Microsoft Azure for cloud services. The airport has deployed Microsoft Azure technology to collect data from back-end operational systems at the airport. These systems are check-in counters, baggage tracking systems, flight schedules, weather tracking systems, cargo tracking and many more.
The operational data from these systems are forwarded to business intelligence platforms like Power BI. In Power BI, users shape this data into useful information that the airport staff can use.
Power BI transforms the crude information into informative visuals showing different statuses and statistics of the airport systems. Then, the ground staff like baggage handlers, gate agents, air traffic controllers, etc. use this information to properly operate and manage passengers.
Services such as Azure Stream Analytics, Azure Data Lake Analytics, and Azure SQL Database are used to extract, clean and prepare operational data in real-time. This data is about flight movements, security queues, passenger transfers, and immigration queues. Ultimately, Power BI uses data from these Azure services for analysis and interpretation.
Operational data from different data sources come into Power BI. Then Power BI tools are used to transform that data into meaningful insights with the help of visual reports, graphics, and dashboards. About 75,000 airport employees have information on their fingertips by the virtue of Power BI.
Let us understand this with the help of a real-world example. If there is a change in the jet stream, it may delay about 20 flights in a day. This will result in about 6,000 passengers waiting at the airport at a given point of time. It will increase passenger traffic and density at the airport. Power BI works like the centralized information system. The airport uses it to inform about the sudden passenger influx. This information goes out to different sections such as food outlets, immigration, customs, gate attenders, baggage handlers at the airport. This will give them time to prepare themselves to attend the passengers.
With the presence of smart BI solutions like Power BI, airport staff is notified in advance about the probable delays and the sudden rush of passengers at the airport. This help management groups and other employees to take suitable actions in advance like increasing the food stock, adding extra passenger buses, increasing the ground staff, directing the passengers to the waiting area, etc. to avoid any last-minute hustle.
Thus, with the help of a powerful BI tool like Power BI, Heathrow has been benefited in more than one way. They are extremely happy and satisfied with the capabilities of Power BI helping them give a hassle-free airport experience to their passengers. Heathrow also is extending Power BI applications by trying to anticipate passenger flow at the airport to avoid any unexpected disruptions for the passengers.
Must Learn!! – How to Create Dashboard in Power BI
Power BI Case Study 2: Edsby
Edsby is a cloud-based software application providing services like management systems, analytics, social networking and data aggregation for educational setups. This technology aims to provide K-12 students with the best learning experience by the help of services like classroom management, content management, attendance systems, grade books, classroom interactions, parent communication active learning, etc. All of these services are provided as a part of the Edsby’s Learning Management System (LMS).
The challenge
![]()
Edsby had an efficient and widely used Learning Management System (LMS). In North America, nearly 11,000 schools were using LMS by approximately 2 million users. Those users were students, teachers, parents, and administrators. Generally, it’s use was to manage, assess and report student’s learning arc to teachers. It was made for all kind of students right from Kindergarten to 12th standard.
What the company needed was an advanced analytics system to improve and support the LMS. The company believed that having an advanced analytics system that works in close coordination with the existing student and learning management systems will prove to be helpful. It will tell them about the efficiencies and loopholes of the system’s functioning and customer behavior.
Implementation
Using Microsoft Power BI Embedded for advanced analytics into Edsby’s web portal, this advanced analytics software is to help Edsby’s Learning Management System (LMS) with data analysis and data visualization capabilities. Initially, the company was confused about building their own analytics and visualization layer on top of its LMS application or to purchase a third-party BI solution. After some thinking and considerations, Edsby decided to go with Microsoft Power BI Embedded as their advanced analytics solution.
The change
Using Power BI Embedded for advanced analytics along with the Learning Management Systems (LMS), Edsby has opened new possibilities for the better student learning experience and helping them shape a future they deserve.
Using Power BI, the company got benefited as it opened new revenue streams, new business opportunities, and improved student learning experience giving better results.
The integration of Power BI for advanced analytics is cost-efficient and easily affordable for end-users.
The developers at Edsby could connect to multiple data sources, create dashboards and reporting layers, save the content in .pbix files to use them later in Power BI for analysis.
Also, Power BI reduced 80% burden from the developers at Edsby by providing documentation, dashboards, and analytical capabilities to the users.
Schools and organizations can retrieve data from different sources like a student information system, test score records, etc. and use it to create dashboards and reports in Power BI. They can use this data to analyze and visualize the information related to student’s performance, grades, attendance, parent engagement, etc.
Edsby employees use the Power BI analytic applications to analyze data trends, student pattern, teachers and their study programs.
The data that Edsby uses in Power BI is secured using row-level security.
The visual representation of student’s information provides a chance of comparative analysis and assessment of student’s performance. That is, student’s grades can be analyzed in the context of their attendance, test scores, etc. With the help of this, both teachers and parents can detect patterns and loopholes in a student’s performance, through the informative visual analysis, they know what teachers and students need to work on in order to attain the better result.
Integrating Power BI into Edsby’s standard LMS solution has opened new revenue opportunities for them. The company approaches state, provincial and national departments of education to use their analytics and management services.
WAIT! Do you know – How to apply Filters in Power BI Reports
Power BI Case Study 3: GE Healthcare
The challenge
![]()
The company wanted to improve healthcare services by deploying advanced cloud computing technologies into their environment. The aim was to provide and empower the clinicians and patients associated with GE Healthcare with better systems and technologies at work.
Implementation
GE Healthcare chose Microsoft Azure and Power BI Embedded to create a Centricity™ Clinical Archive Analytics (CCA Analytics) service. CCA Analytics is a type of Vendor Neutral Archive (VNA) solution. It is a cloud-based service. Before finalizing Power BI Embedded as their BI solution for CCA service, the company evaluated several other BI tools having the potential to fetch and analyze data from its VNA system. The reason to choose Power BI Embedded was that it was much more flexible, user-friendly, interactive, with intuitive visualizations and efficient than other tools. GE Healthcare integrated Power BI into their working environment quickly.
Later, the solution was in a pilot testing phase at the IT department of a medical center. Then finally, GE Healthcare released ‘CCA Analytics solution powered by Power BI Embedded’ for users by mid-2018.
The change
CCA Analytics in GE Healthcare harbors cloud computing capabilities of Microsoft Azure and intuitive BI capabilities of Power BI Embedded. This makes CCA Analytics an efficient business intelligence and data analysis solution. With the help of Azure, professionals at GE Healthcare can easily plan to scale the solution as per the company’s requirement and work with enormous data volumes.
The aim of introducing CCA Analytics was to improve enterprise imaging operations and financial performance for the firm.
Power BI is a part of GE Healthcare’s CCA Analytics solution.
CCA is a type of VNA technology which stands for Vendor Neutral Archive (VNA). This technology is a medical imaging technology used to store patient’s scans and images. They are stored in a standard format so that one can access them from anywhere, anytime.
GE Healthcare decided to use Centricity Clinical Archive (CCA) system (as its VNA solution). It is used with CCA Analytics for data analytics and improved decision making.
The CCA Analytics solution has Microsoft Power BI Embedded as it’s BI platform that provides valuable insights on the use and operations of the CCA system.
Power BI capabilities strengthened GE Healthcare’s CCA analytics solution enabling users to study their data better. It also brings improvement at financial, operational and clinical front. It helps in analyzing customer interaction and behavior to improve customer/patient’s experience.
In 2017, GE Healthcare was declared the world’s number one VNA provider. By introducing Power BI in their new VNA analytics technology with cloud-computing capabilities, they wish to grow as a company and form ties with new companies.
The CCA Analytics system only gathers and uses correctly registered user information. It adds red flags for the user information that do not have proper metadata associated with it. The passed (green flagged) information is shown as “diagnosis ready”.
After exploring the Power BI Case Study article, it’s time to practice the Power BI Interview Questions by DataFlair
Summary
These were the case studies of three companies; Edsby, Heathrow Airport and GE Healthcare on Power BI. We saw in all of the three case studies how Power BI has helped these companies grow in terms of business and profits. The business intelligence capabilities of data analytics help companies see current and future trends and steer their business accordingly.
Any other Power BI case study that you would like to add? Share them with us in the comment section. And, for queries, you know that DataFlair is always there for you.
Did you like our efforts? If Yes, please give DataFlair 5 Stars on Google


Very informative and interesting case studies