Custom Visuals in Power BI – Hunt various Ways & Steps to Import them!
Expert-led Courses: Transform Your Career – Enroll Now
As we know from our tutorials on Power BI Desktop and Dashboard, that there are a lot of different kinds of custom visualizations that you can use to make a report. Power BI offers a good set of in-built visuals such as line chart, bar chart, funnel chart, KPI, map, pie chart, donut chart, etc. You can access and use these pre-packaged visuals from the Visualization pane in Power BI Desktop.
These pre-packaged visuals might prove to be enough in most cases and fulfill your requirements in creating a report in Power BI. However, there will be times when you’ll have a hard time finding the right fit to graphically represent your data. For this, Power BI offers a rich library of custom visuals from which you can select, import to Power BI Desktop and use as per requirement.
“Absorb what is useful, Discard what is not, Add what is uniquely your own”.
Developing Custom Visuals in Power BI
Custom visuals are created by developers using the custom visuals SDK. Developers use JavaScript libraries such as jQuery, D3, R-language scripts, etc. to create custom visuals from scratch. Once a custom visual is ready, it is then tested and debugged. After it is ready and secure, a developer packages it in the .pbiviz file and share it within an organization or upload it on AppSource as an open-source data visualization. From the AppSource, any Power BI user (author) can import the custom visual to use it in their report.
Generally, Power BI custom visuals are divided into three categories based on the way they are deployed.
- Custom visual files
- Organizational visuals
- Marketplace visuals
You must also learn – How to Create Measures in Power BI Desktop
1. Custom Visual Files
The custom visual files are the .pbiviz files that contain codes to run custom visual in your Power BI app. Developers create custom visual codes and package them in custom visual files having .pbiviz extension. The customers or report makers download these files into their system and use them in their Power BI reports.
However, there is one important thing to note, you must make sure that the custom visual you are importing is from a trusted source. The custom visual should be free from any kind of security and privacy risk.
2. Organizational Visuals
Organizational visuals are the visualizations, custom-made for use within an organization. Every organization has work-flows or business method unique to them. And therefore, they need tools and techniques to be used for their business requirements.
Power BI offers the option of creating custom visuals tailored specifically for organizational use. Developers within the organization can create specific visualizations to represent data trends and information crucial to the organization.
The Power BI admin (administrator) takes care of the deployment and management of the custom organizational visuals. The admin uploads selected custom visuals from the Power BI Admin Portal to the organizational visuals repository. Users or report authors take these custom visuals into Power BI Desktop for their use. In this way, these visualizations are finally ready for the data analyst to use them in reports and analysis.
3. Marketplace Visuals
Marketplace visuals are tested and approved custom visuals from Microsoft and its fellow community members. Such custom visuals are developed and uploaded on AppSource. This is done as community service to benefit Power BI users as they can explore new aspects of their data by using these custom visuals. In the coming sections,
we will learn how to import custom visuals from Marketplace and AppSource.
Microsoft subjects some selected visuals to even more rigorous quality and risk testing.
The visuals that pass such testing are called certified visuals. These visuals provide some additional functionality as well, such as email subscriptions, export to PowerPoint, etc.
Do you know about Power BI DAX
Downloading and Importing Custom Visuals from Microsoft AppSource
You can explore the vast collection of custom visuals from the Microsoft AppSource. Follow the steps given in this section to learn how to download and import custom visuals of your choice and need of Power BI Desktop.
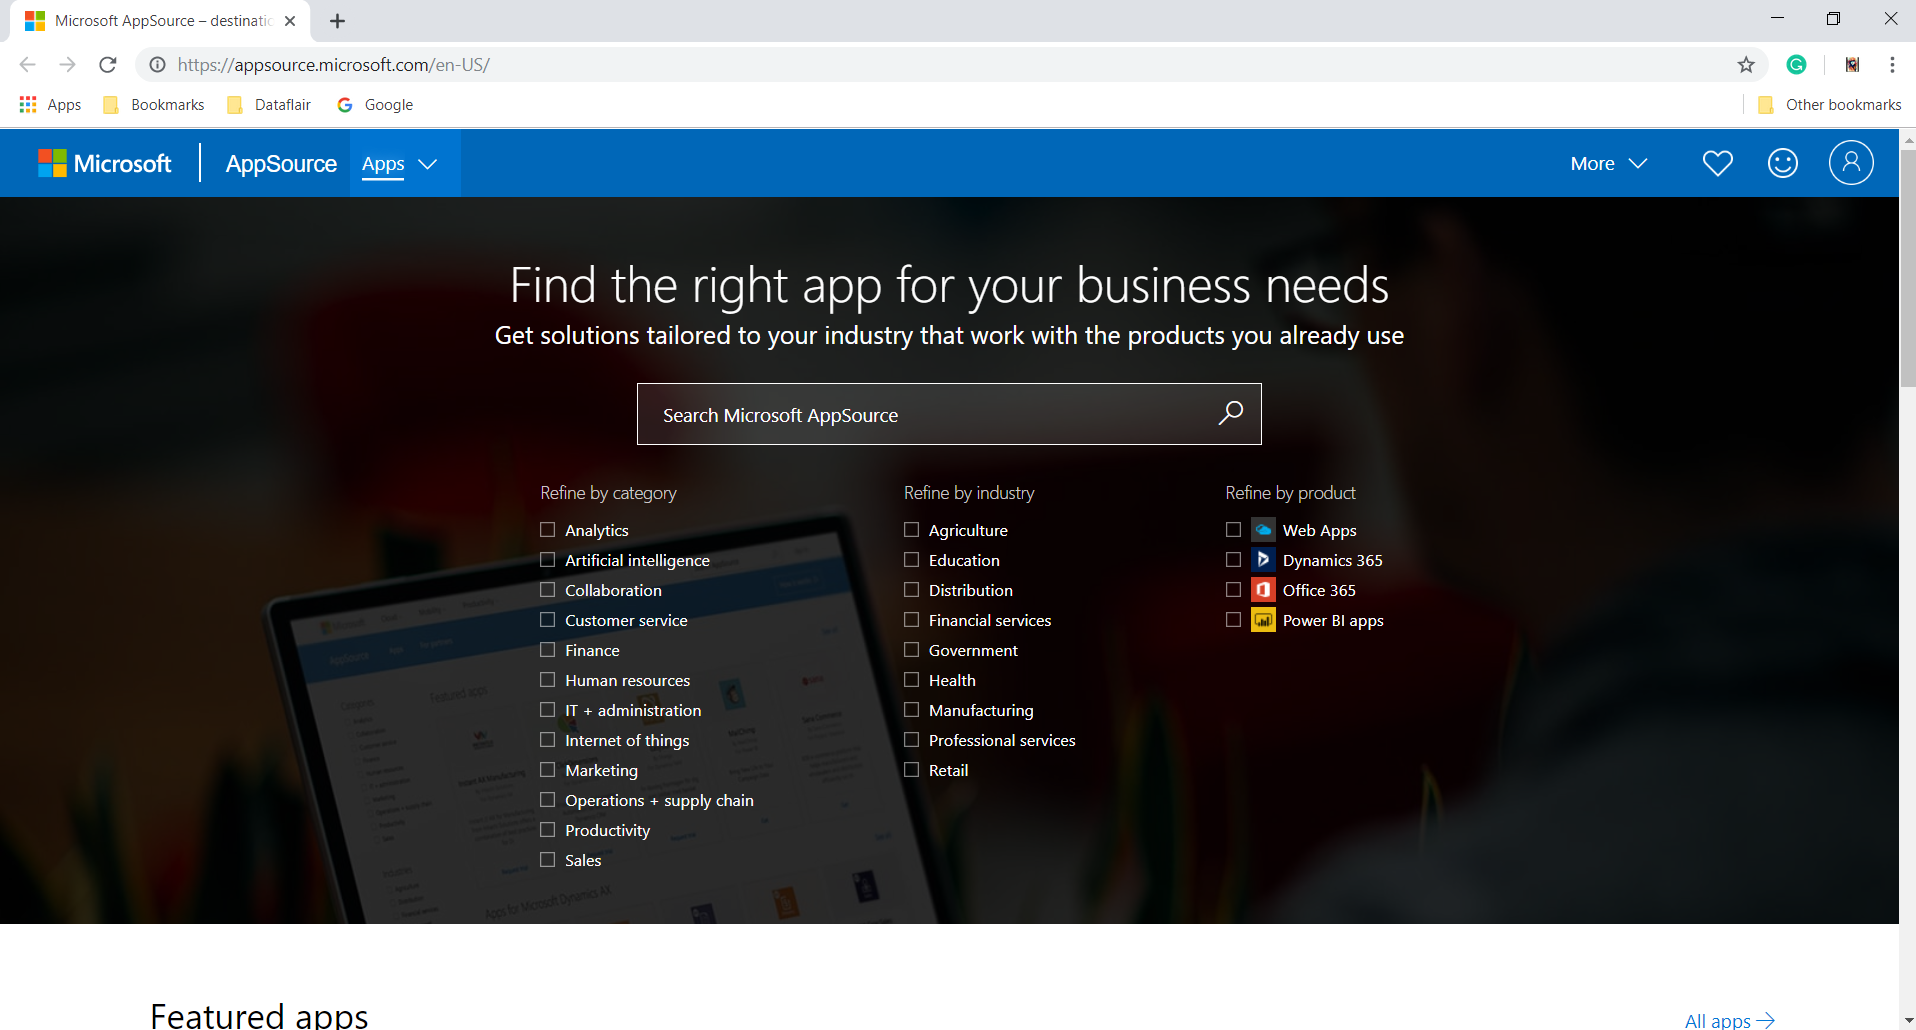
Step 1: Go to the Microsoft AppSource website. The AppSource home page will open.
Select the Apps tab from the bar on the top.
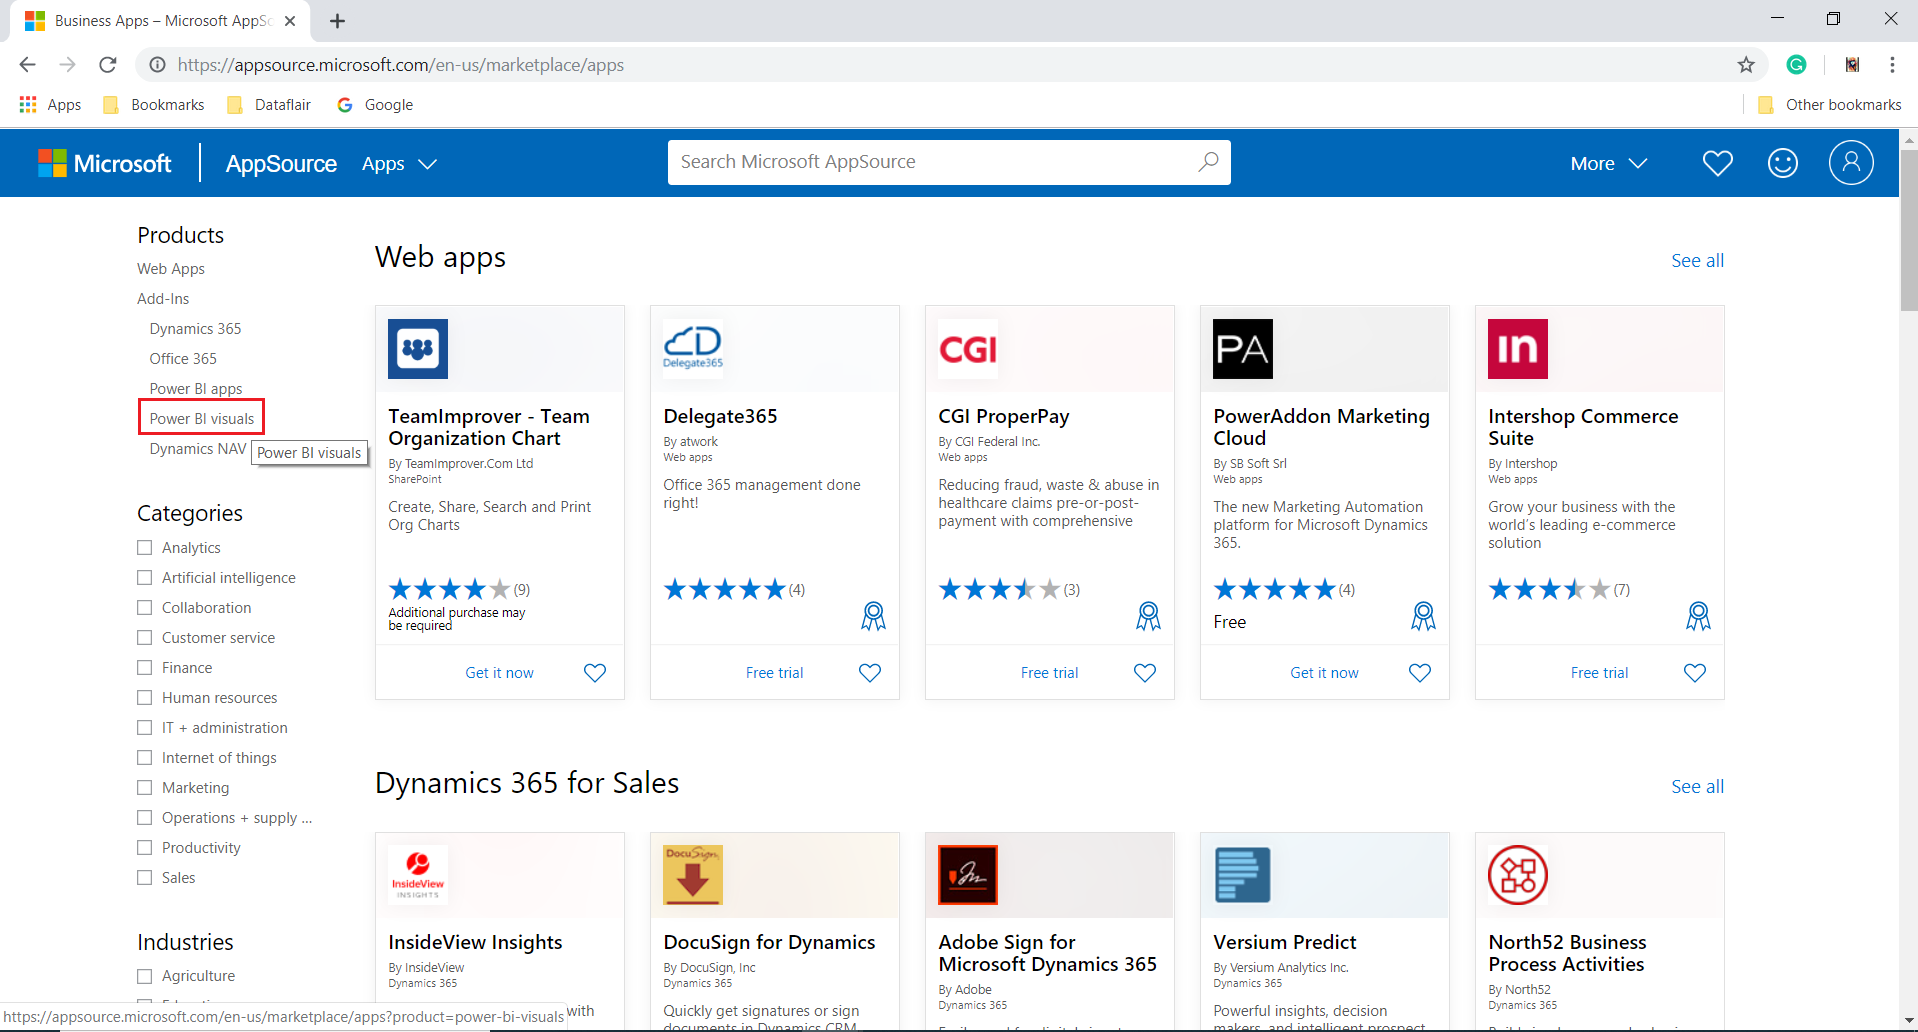
Step 2: Select Power BI Visuals options.
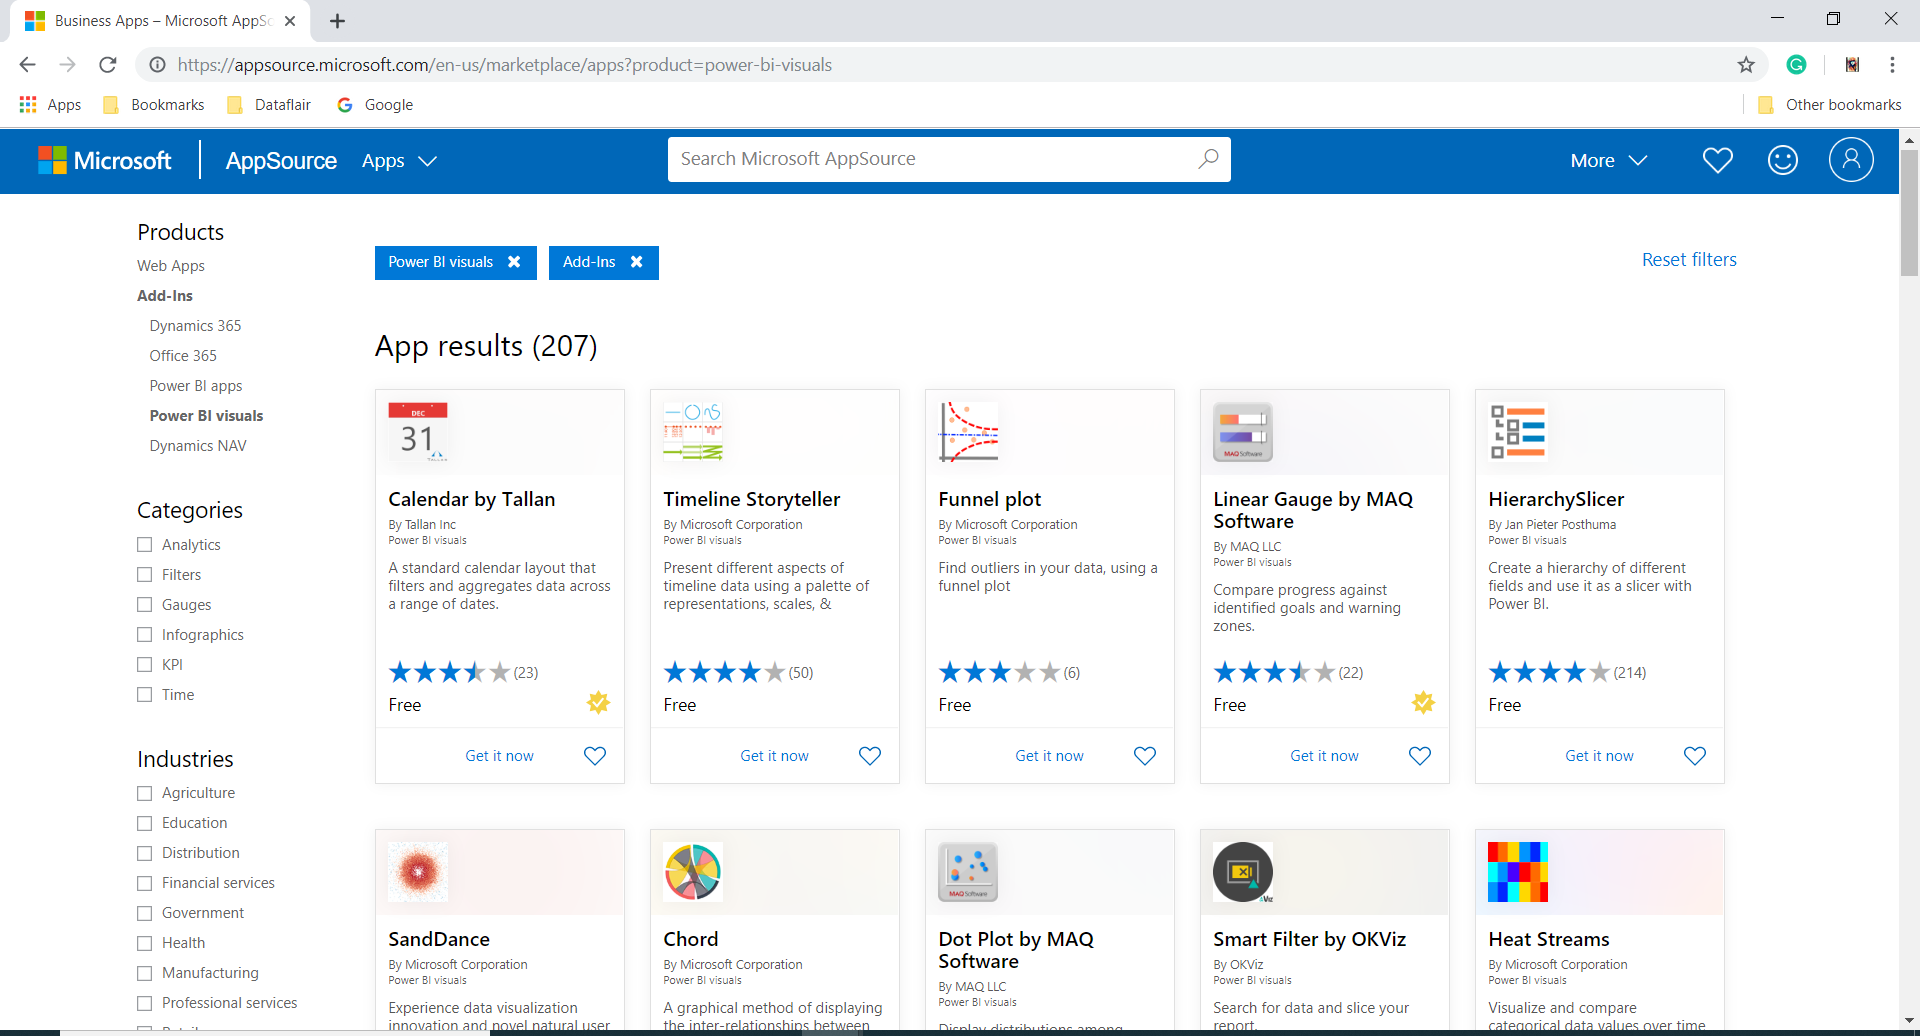
Step 3: The page will show more than 200 results of Power BI visuals. You can browse the list of available custom visuals.
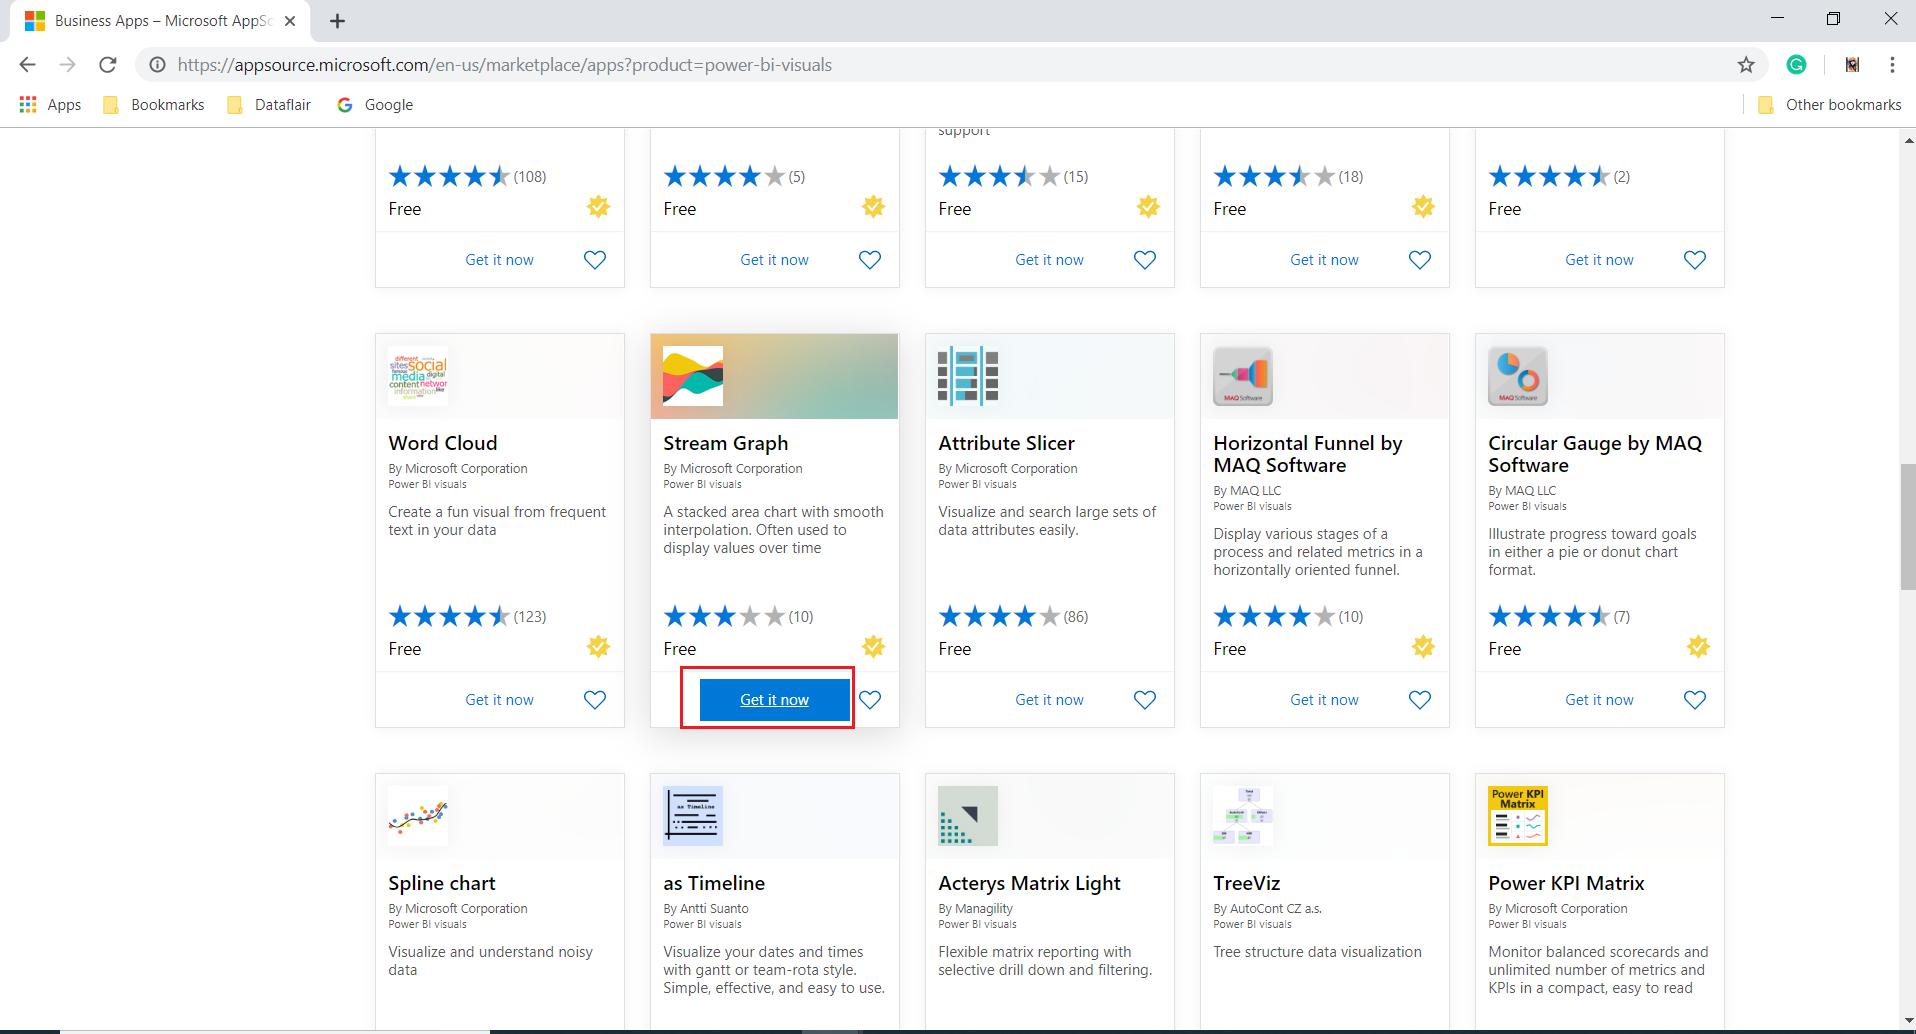
Step 4: Let’s say, we want to use the Stream Graph in our Power BI report. You can select what you require by reading the descriptions of each visual. Click on Get it now.
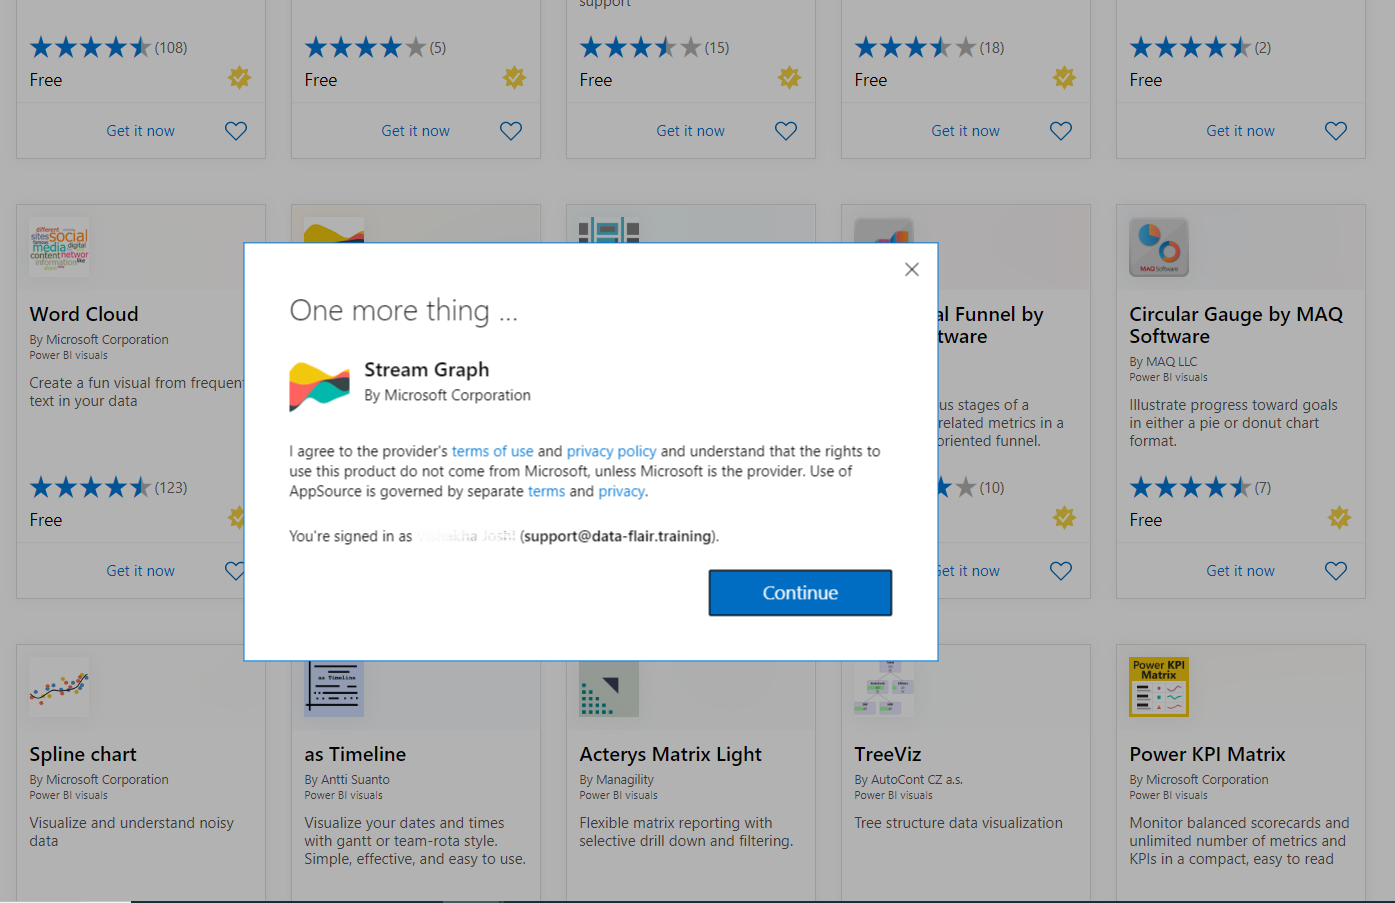
Step 5: Click on Continue in the next window.
Step 6: Then, click on Download for Power BI.
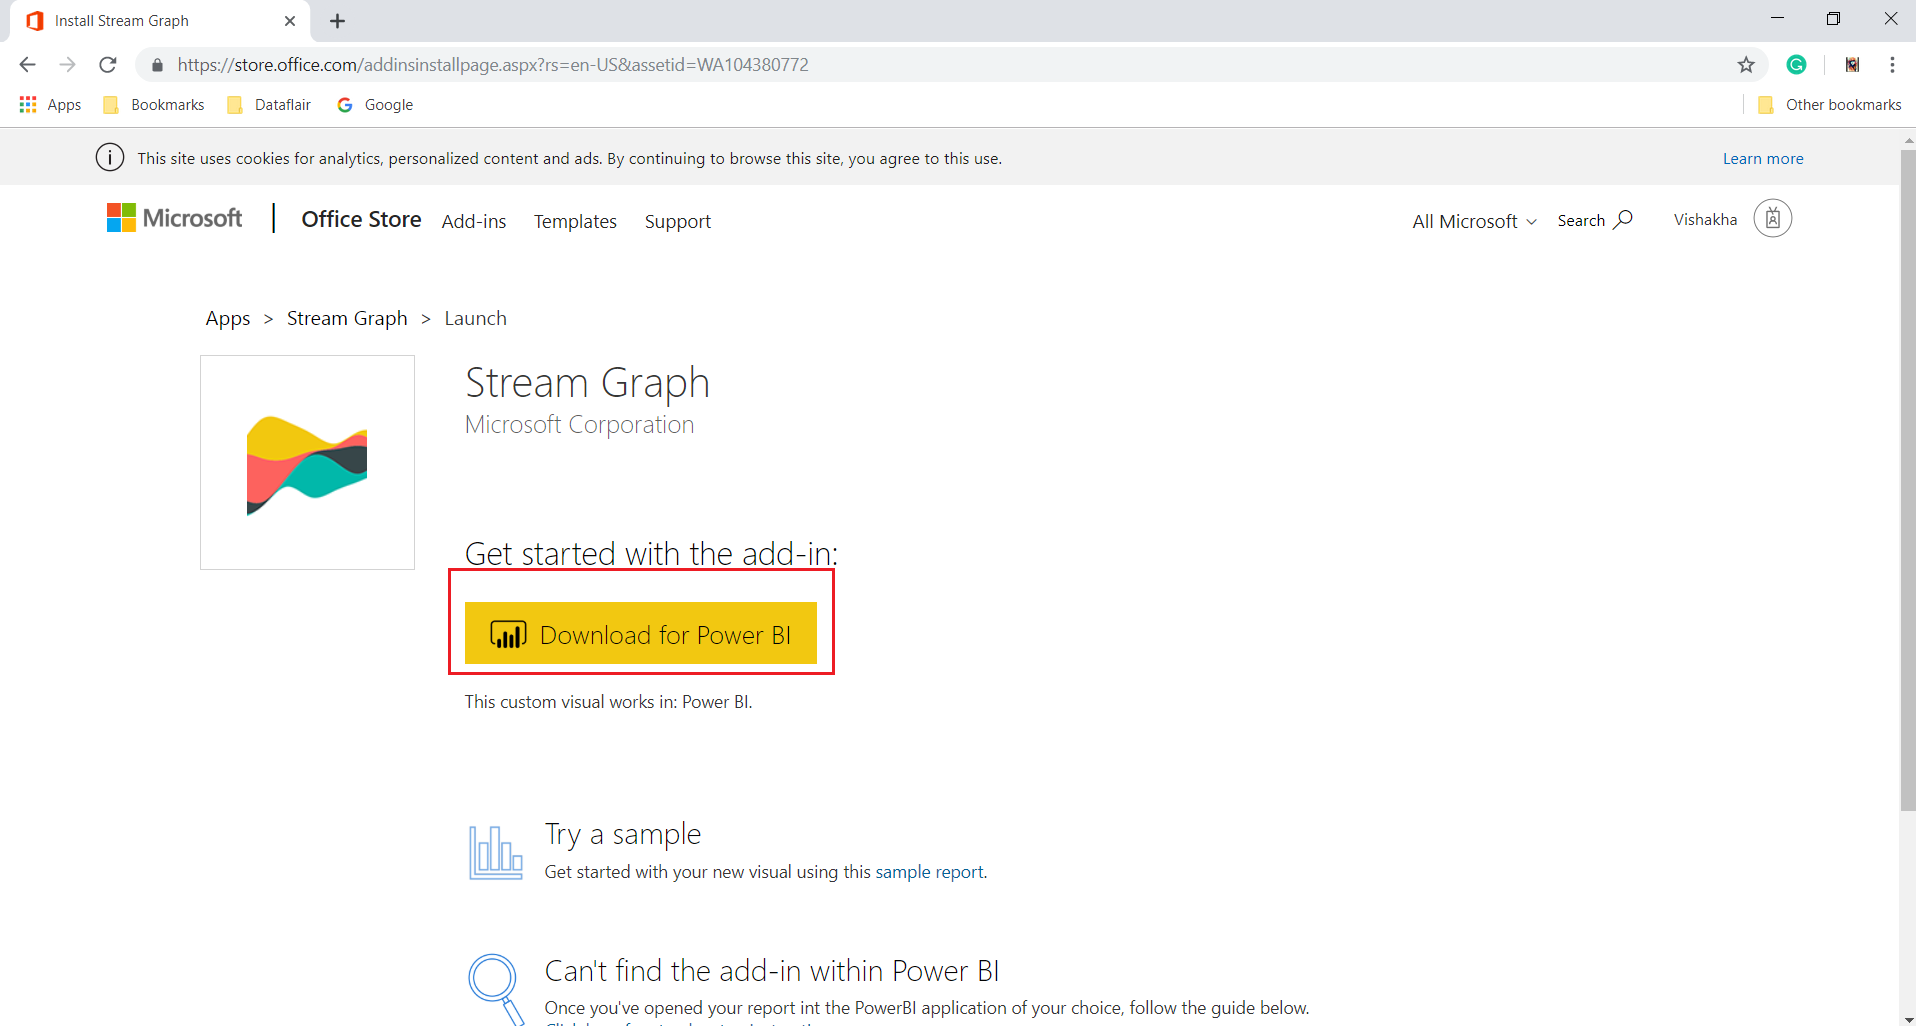
The file will be downloaded automatically.
Take your business to next level through Power BI Filters
1. Importing Custom Visuals from File
The custom visuals that you’ll download from AppSource will get downloaded in your system at a default location. We will get those custom visuals in Power BI Desktop through Import from file option.
To do this, follow these steps.
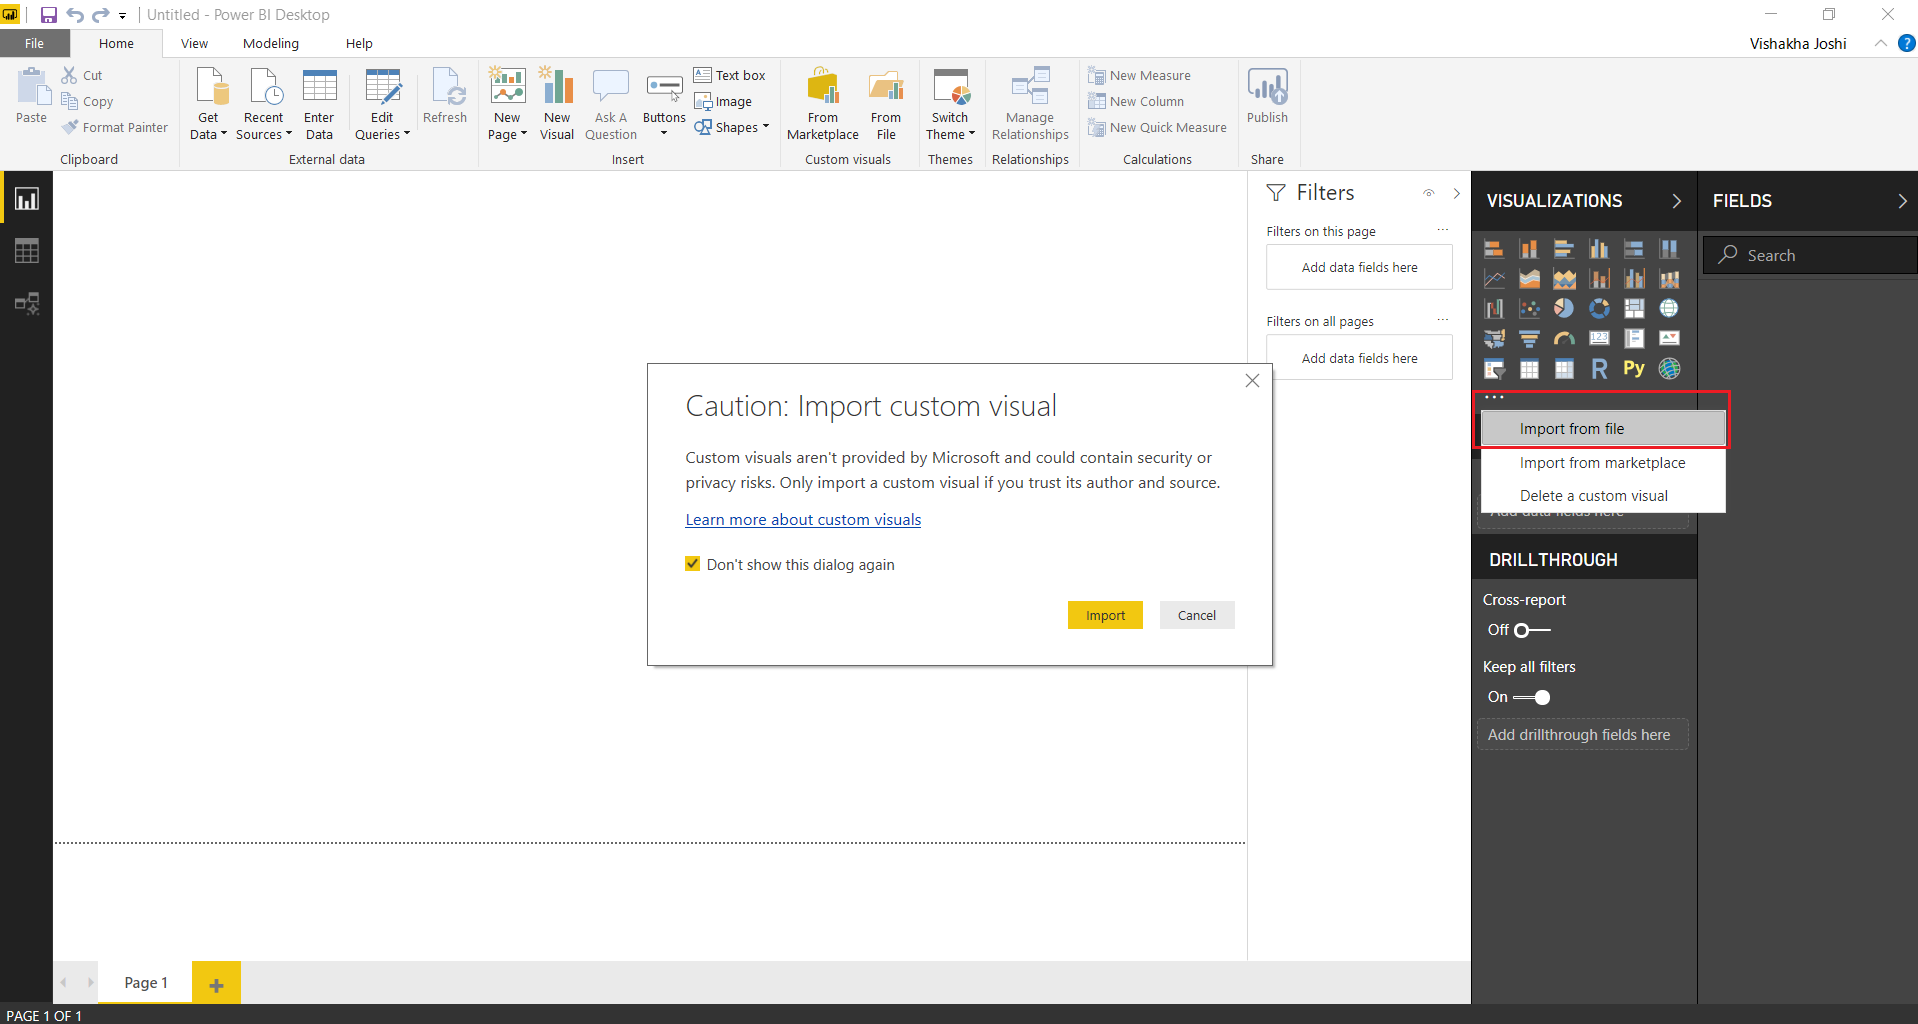
Step 1: Open Power BI Desktop in your system. From the Visualizations pane, click on the ellipses … icon. Then, select Import from file option.
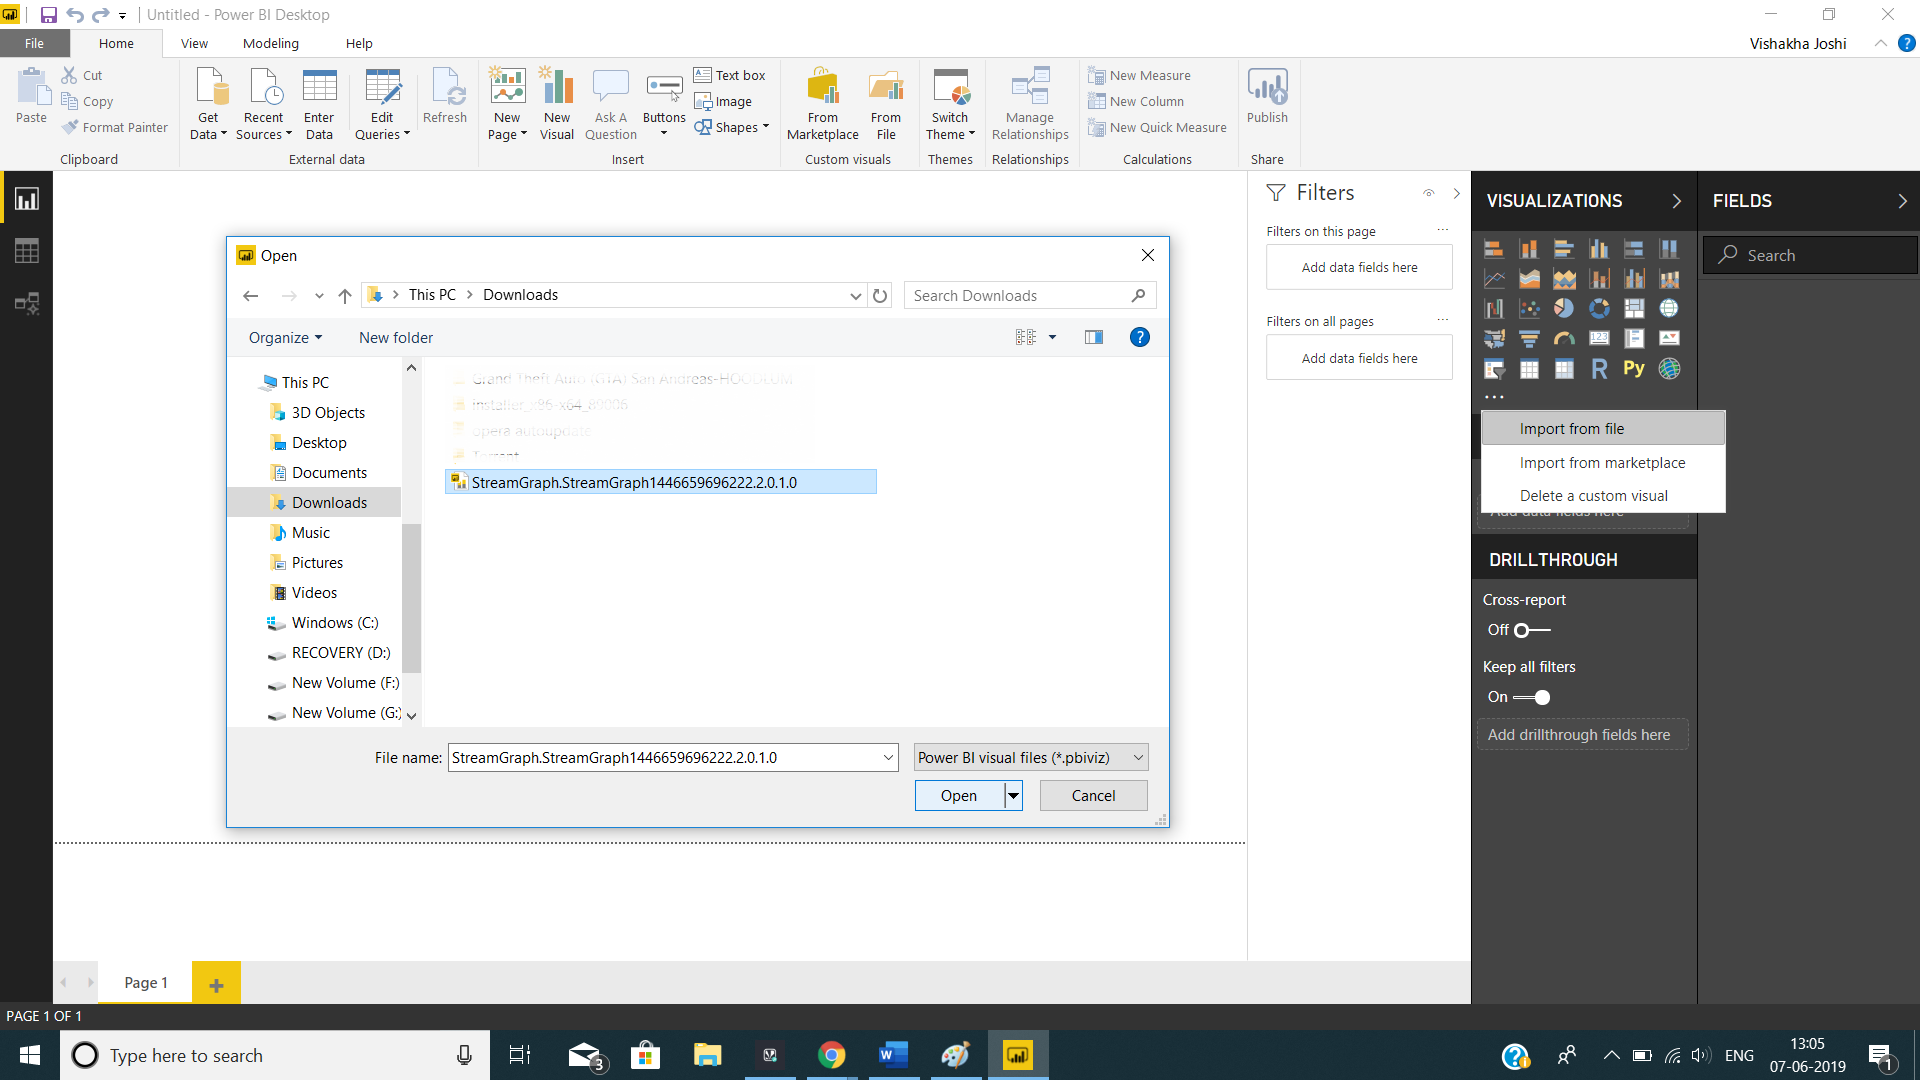
Step 2: Select the .pbiviz custom visual file from the destination. Then click on Open.
Step 3: A message prompt indicating successful import of file will appear on Power BI Desktop.

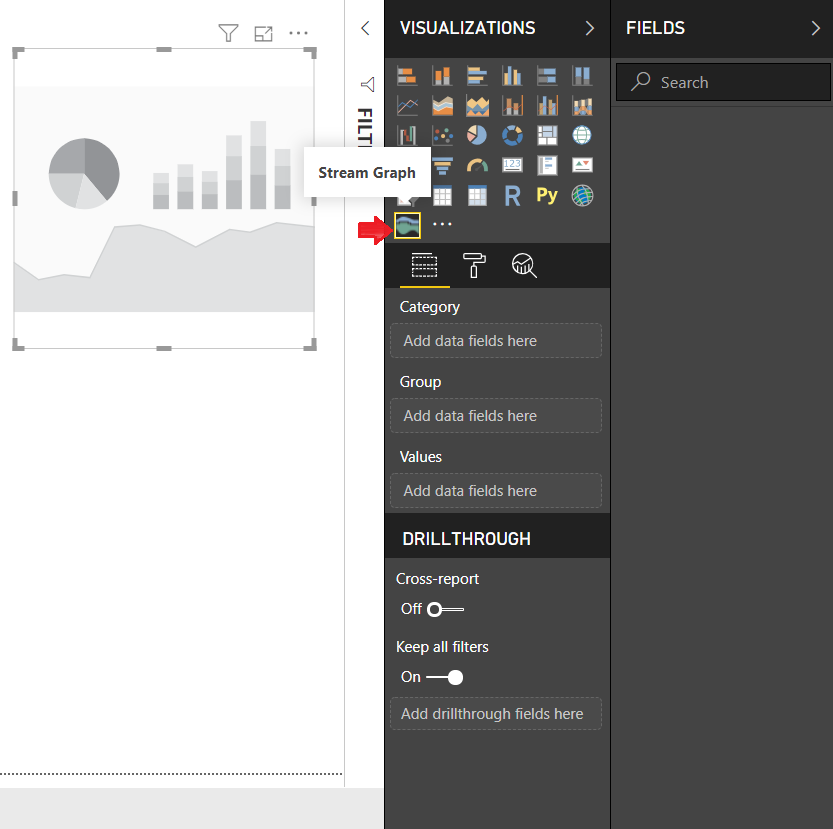
Step 4: As shown in the screenshot below, the Stream graph that we imported is shown in Visualizations pane and is ready to be used.
Understand the concept of Power BI Slicers thoroughly
2. Importing custom visuals from marketplace
To import custom visuals available on the marketplace, follow the steps given here.
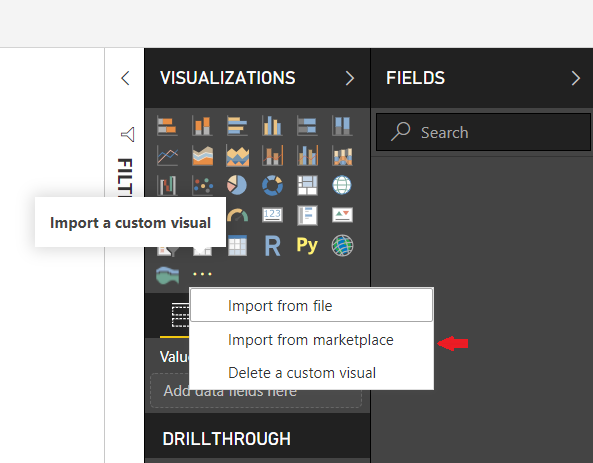
Step 1: Click on the ellipses icon … in the Visualizations pane. Select Import from marketplace option.
Step 2: The Power BI visuals dialog box will open. You will find two tabs at the top; Marketplace and My Organization. Click on Marketplace. You will see a list of all the available custom visuals. Also, you can select a category and then browse for the custom visuals. You can also directly type the name of a visual or category that you are looking for in the search area.
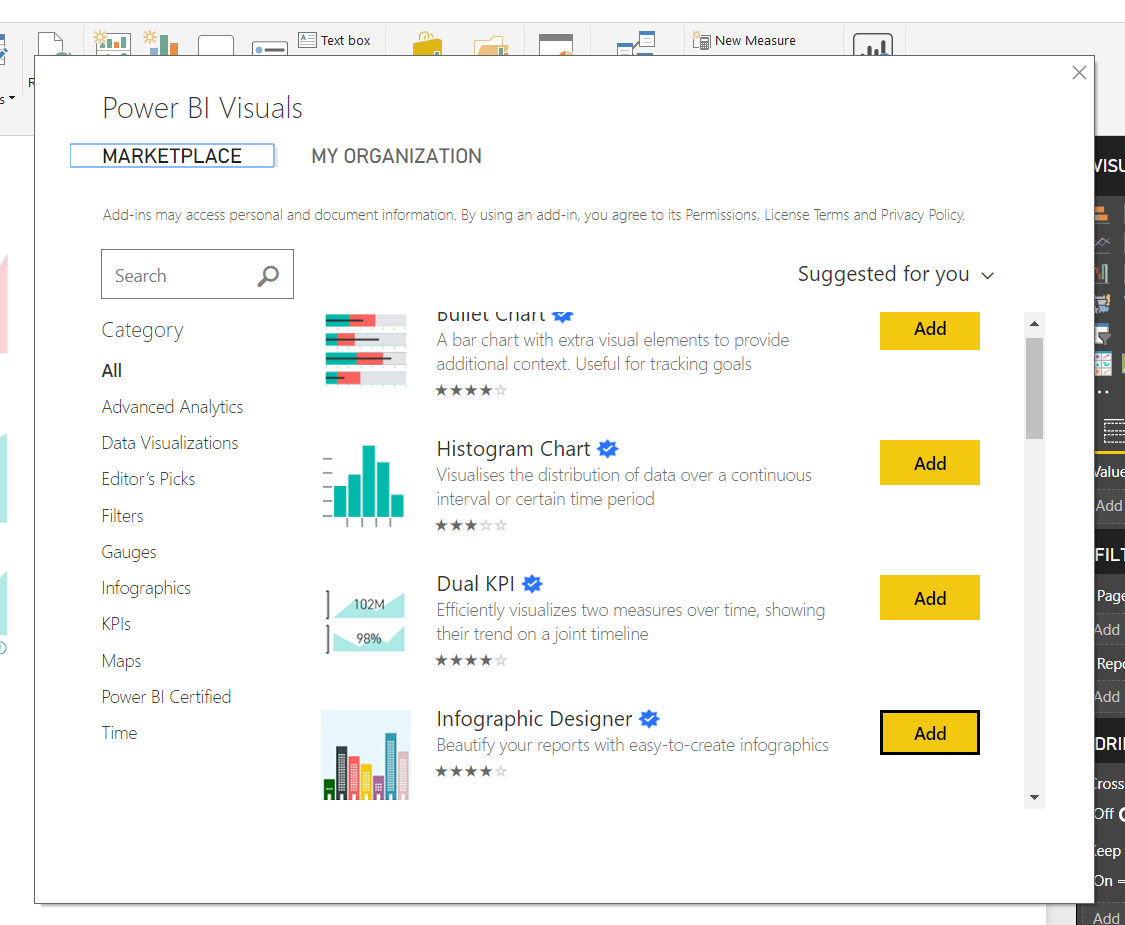
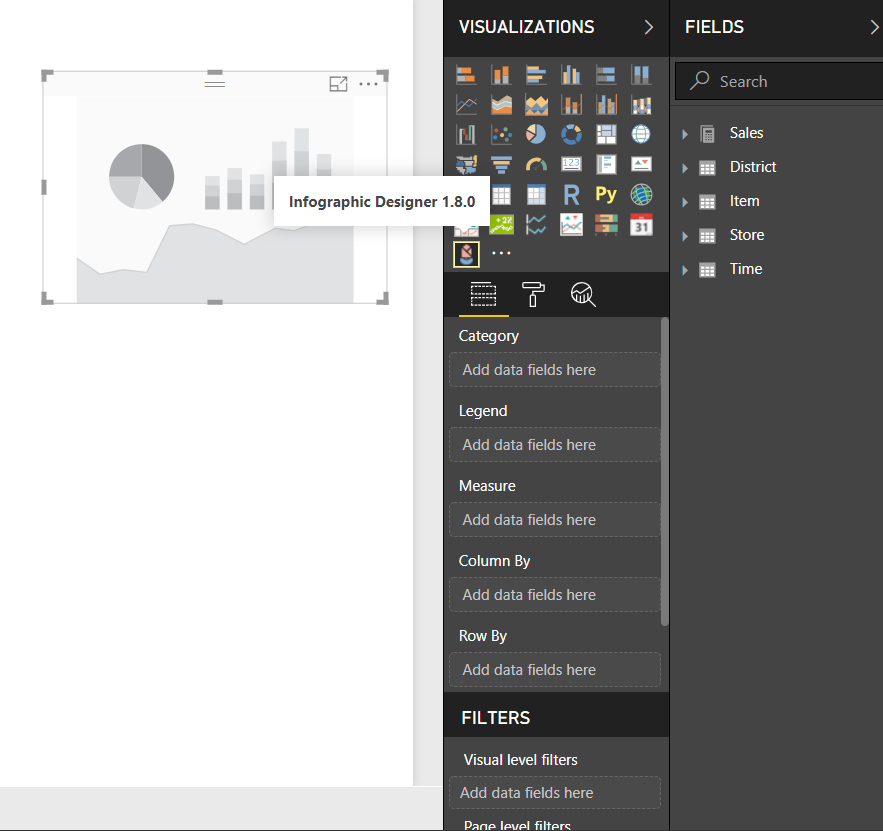
Step 3: Select a custom visual from the list and click on Add. The visual will be added in your Power BI Desktop’s Visualizations pane. For instance, we have selected the Infographic Designer custom visual from the marketplace.
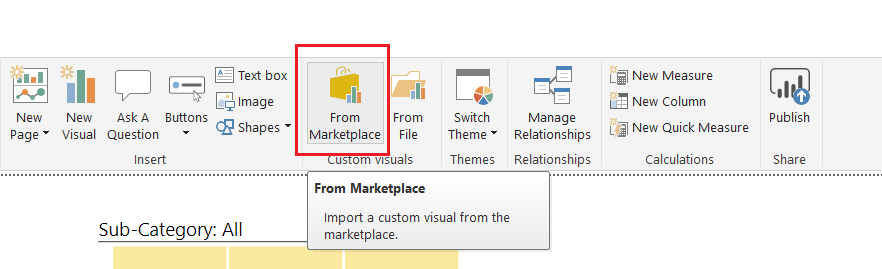
Step 4: There is one more way by which you can access the marketplace. Select From Marketplace option given under the Home tab.
3. Importing Organizational Custom Visuals
Just like we saw how to import custom visuals from the Marketplace, we’ll learn how to import organizational custom visuals.
To import custom visuals available in your organization’s repository, follow the steps given here.
Step 1: Click on the ellipses icon … in the Visualizations pane. Select Import from marketplace option.

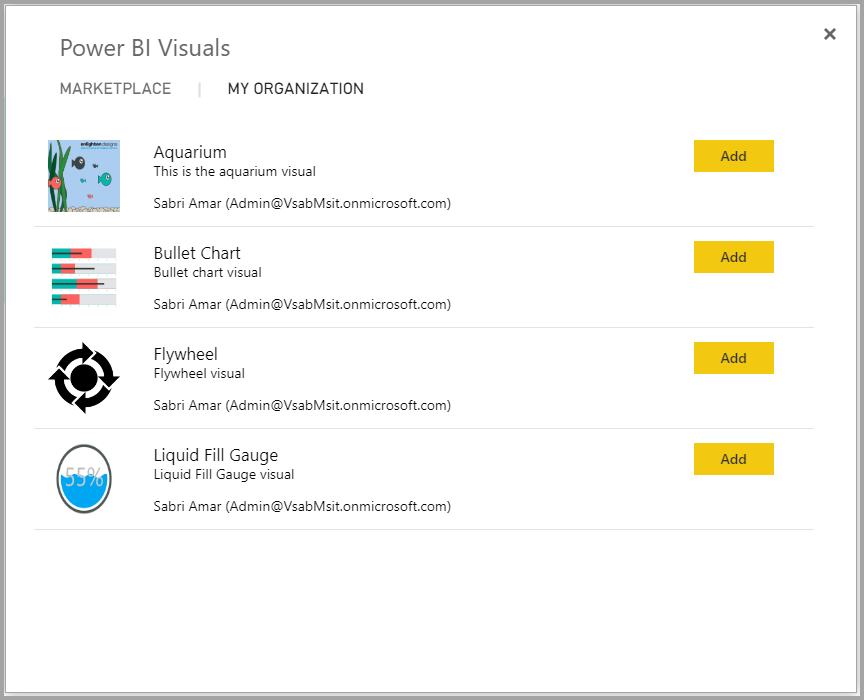
Step 2: Select the MY ORGANIZATION section. In this section, you’ll find all the custom visuals developed and uploaded by the Power BI Admin from your organization.
Summary
This concludes our tutorial on custom visuals in Power BI. We hope you learned about custom visuals, their types available in Power BI and how to import and use them.
Stay tuned with us for some more interesting topics on Power BI. For now, you can explore our next blog on Power BI KPI.
Still, have any questions?? Ask freely through comments, we will be more than happy to answer your queries.
Did you like this article? If Yes, please give DataFlair 5 Stars on Google


