Understand Power BI Filters to take your business to next level!
We offer you a brighter future with industry-ready online courses - Start Now!!
After gaining basic knowledge of Power BI, let’s move on to the role of filters in Power BI reports and dashboards. Along with the theoretical knowledge, we’ll also learn how to apply and use these filters in Power BI dashboards and reports.
What are Power BI Filters?
Filters in Power BI sort data and information based on some selected criteria. That is, you can select particular fields or values within fields and view only the information related to that. For instance, you have a dataset related to sales of a store. Now, using the filters you can filter out the unnecessary information. You can view a report having only the data for the selected aspects. Let’s say, you only want to see the information on sales in India in the year 2019. For this, all you have to do is to put the filtering criterion as 2019 and India from their respective fields. The report of sales will immediately make changes accordingly and only show the graphs and visuals specific to sales statistics in India and in the year 2019.
Download Datasets
In this Power BI filters tutorial, we will be using the following datasets:
Types of Filters in Power BI
There are four types of filter in Power BI. This means that you can apply filters on four different levels in a Power BI dashboard or report. The types of filters are as follows:
1. Visual-level Filters
The filters applied to visual-level are applied directly on individual visualizations. Such filters are applied both on data and calculation conditions used within a visualization.
2. Page-level Filters
Page-level filters are for a particular page within a report whereas reports are usually of multiple pages. You can apply certain filter conditions on a selected page within a report. Each page in a report can have a different set of filter conditions applied to it.
3. Report-level Filters
The report-level filters are the filters that you use to apply a filter condition on the entire report. The report-level filter will get applied to every visualization and page of a report. Thus, unlike visual-level and page-level filters, report-level filters are generalized filters.
4. Drillthrough Filters
Using drillthrough filters, you can create a page that mainly focuses on the specific entities. You can add the extra details about your user, customer, manufacturer on a separate page and focus on a specific customer/manufacturer/user from the main report.
How to Apply a Filter in Power BI Desktop
While you are working with Power BI Desktop, you can make different kinds of visualizations. Generally, you will make a visualization/dashboard/report representing all the values in a field. But you can apply filters on the field values and make the dashboard specific to your area of interest. In this section, we will learn how to apply filters on a visual, page and report in Power BI Desktop. To learn along with us, you can open Power BI Desktop and create a visualization or open an existing report.
Applying Filter to a Visual
Create or click on a visual in your Power BI Desktop. For instance, we have created a Treemap chart upon which we will apply filters. The Treemap chart shows total sales occurred in each sub-category of products sold.
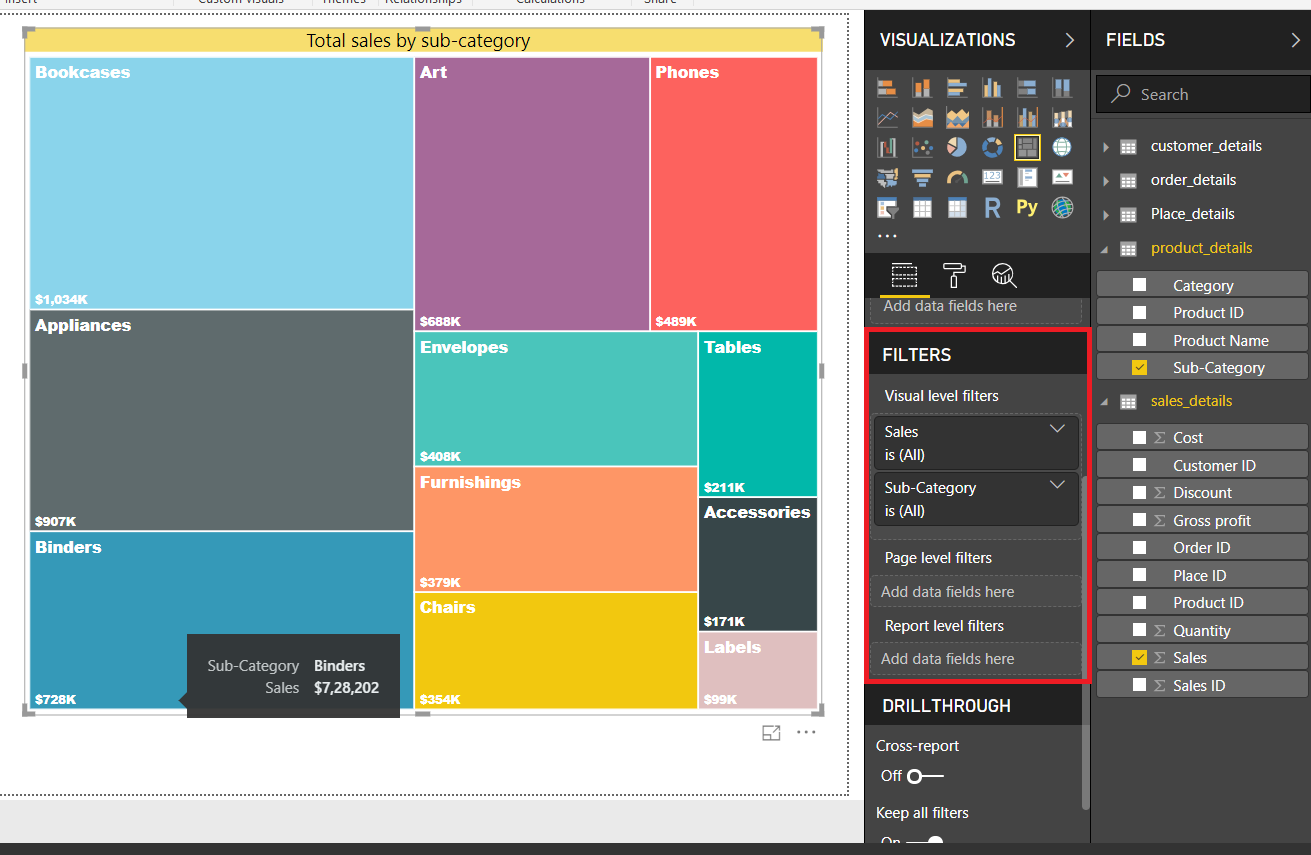
As you can see in the image above, the Treemap chart has two fields; Sales and Sub-category. Also, notice that in the Filters section, there are three sub-sections i.e. visual level filters, page level filters and report-level filters.
Must Learn – How to Create Treemap in Power BI
Now, the visual level filter section will show all the fields that you have selected for the visualization. In our case, it is Sales and Sub-category.
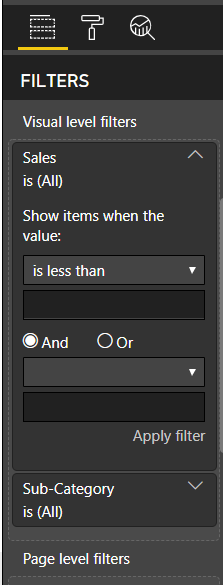
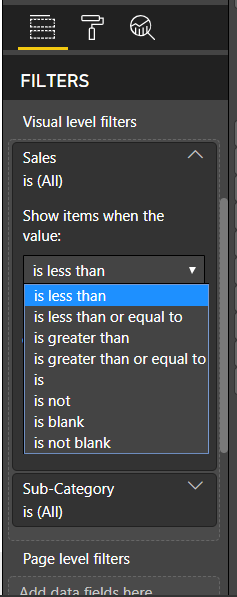
If your field is a measure i.e. containing numeric values, then the filter will show filtering criterion for number. That is, “is less than’, “is greater than”, “is”, etc. After selecting your criterion, you can also mention a numeric value below for instance, “is less than” and then enter 100000 as value.
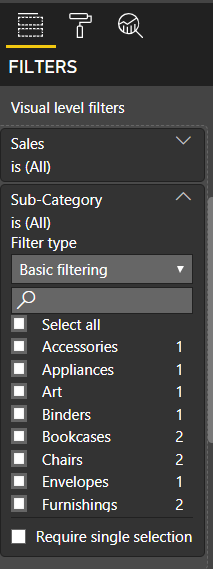
If a field is a dimension, i.e. having textual value then filtering will be normal. You are given a list of all the available (distinct) values in a selected field. You can apply the filter by selecting the checkboxes. Click on Apply filter after making your selections.
Applying Filter to a Page
After learning how to apply a filter on individual visualizations, we will apply the filter on a complete page of a report.
To do so, drag and drop a field based on which you wish to sort the information on a report page into “page level report” column.
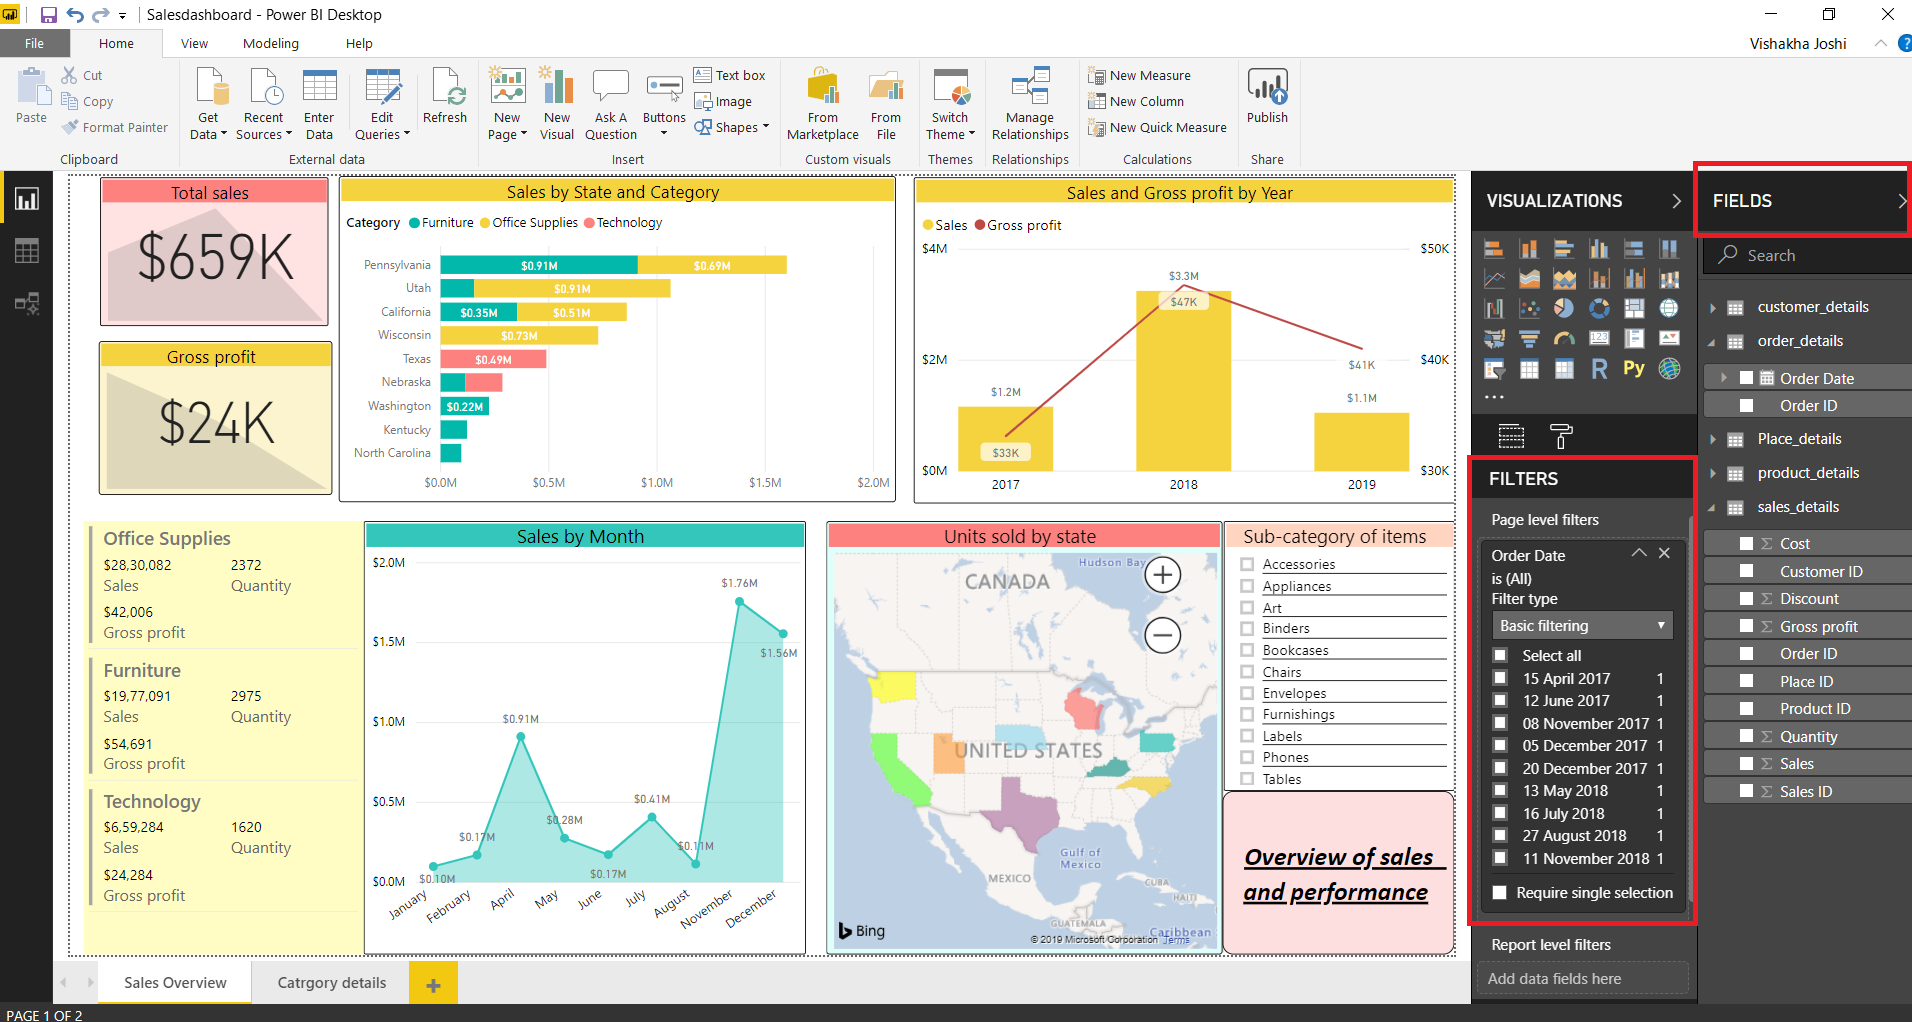
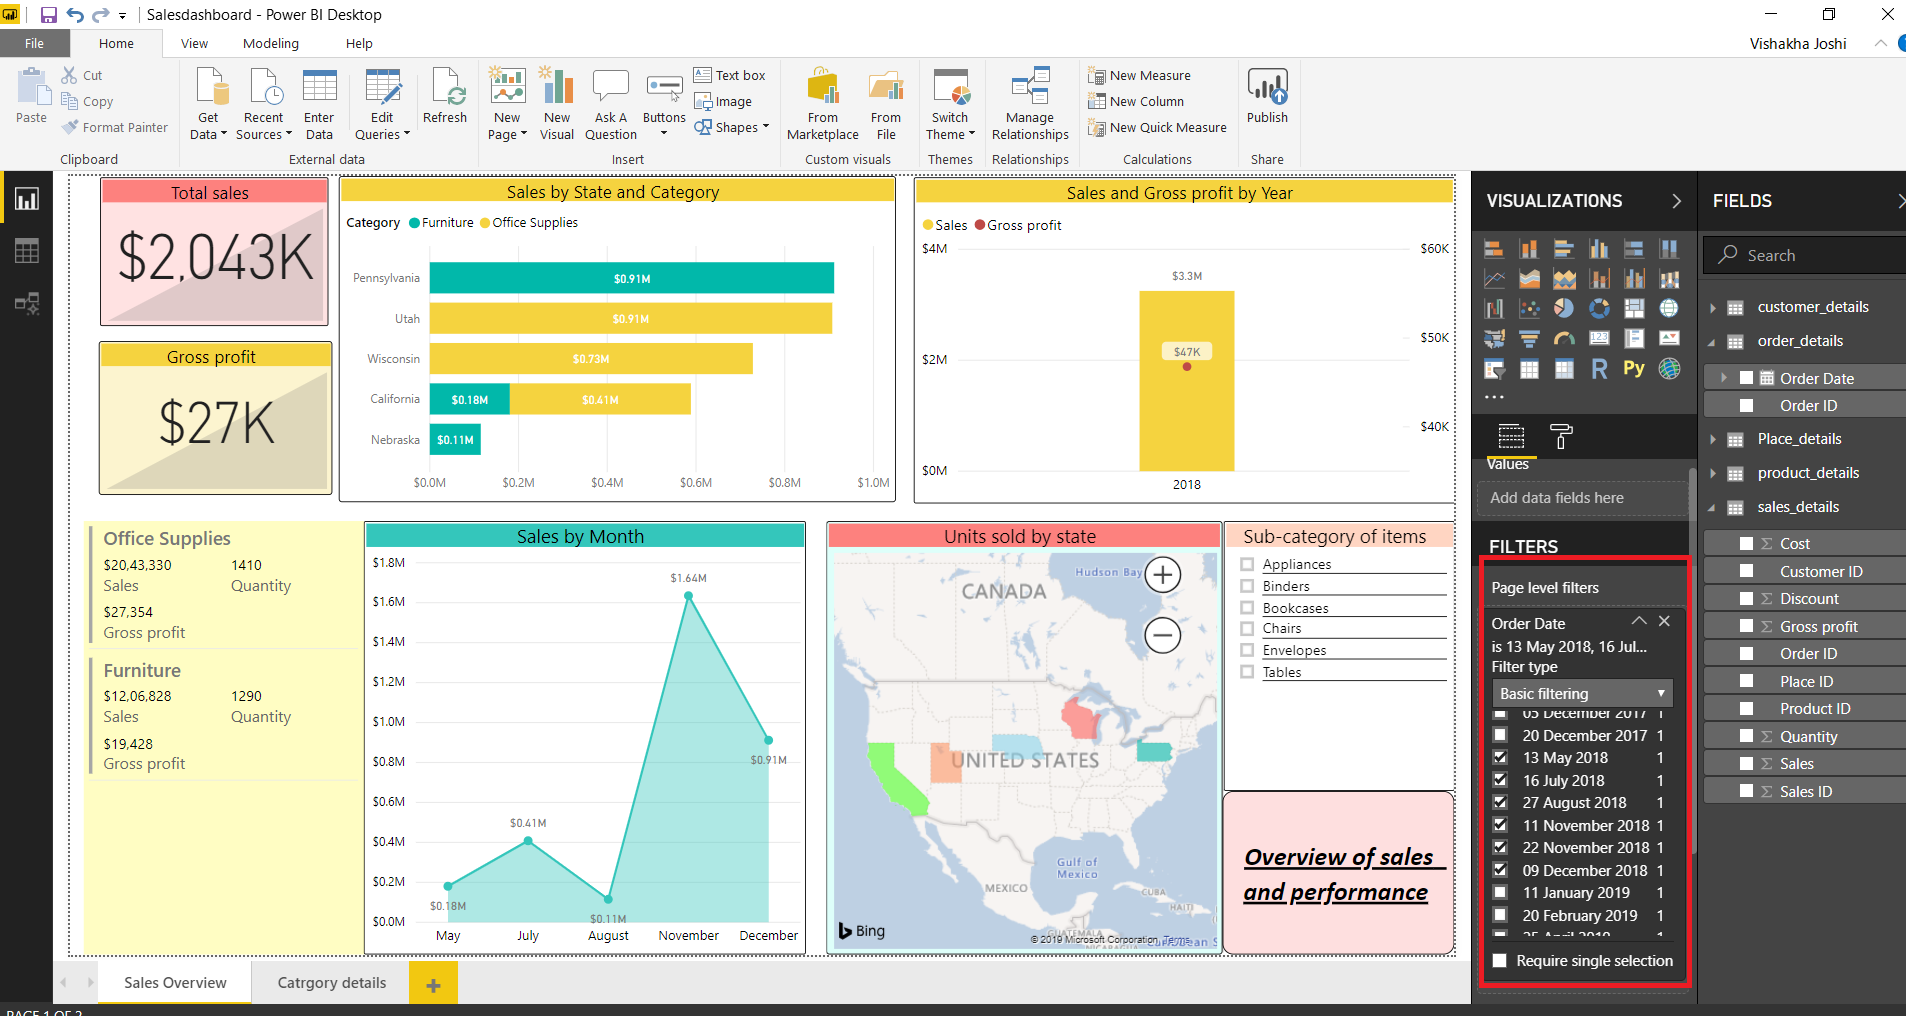
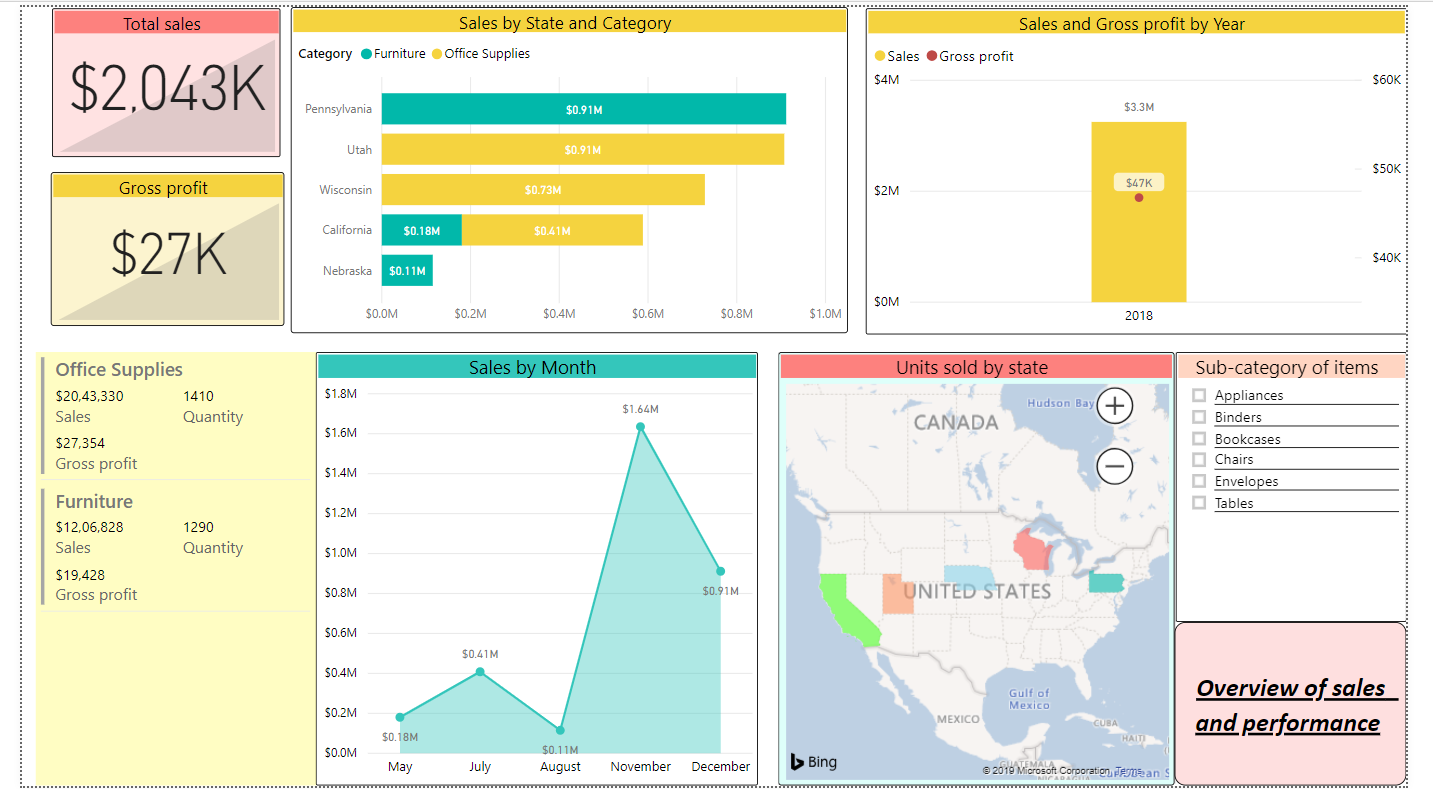
Make selections from the field values. Select the values based on which you wish to filter the information. For instance, in our case, we want to view the sales overview information of only the year 2018. In the Filters section, we select only the dates of 2018. The page will automatically change its visuals and show only 2018 related info.
Applying Filter to a Report
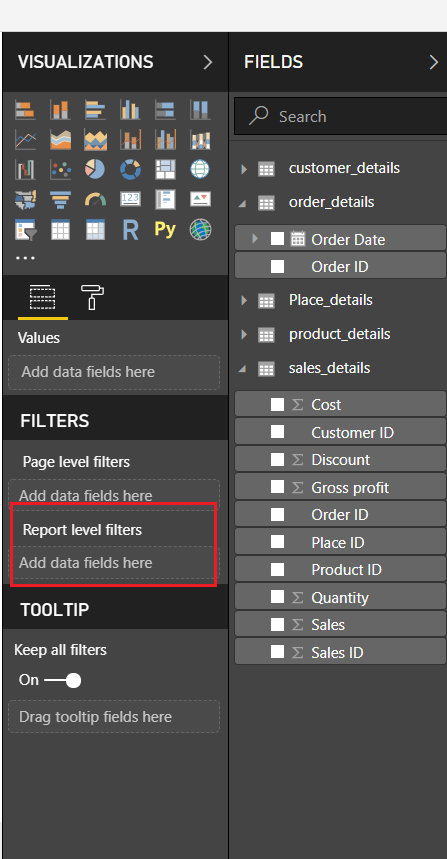
To apply a filter to the entire report i.e. to all the pages of a report uniformly, we use report level filters. Drag and drop a field from the Fields section into the Report level filters section.
We’ll select all the dates for 2018 so that the visuals show only the information related to that year on all pages.
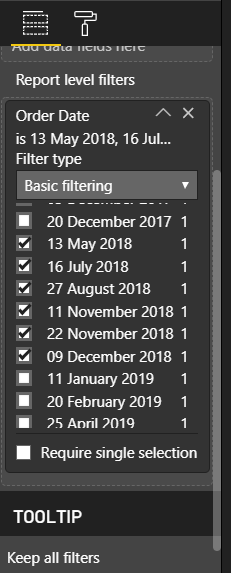
Apply this filter and all the pages in a report will show sales information for the year 2018 (as shown in the pictures below).
New Filter Pane Experience in Power BI Desktop
In the latest edition of Power BI, there is a new option to add a filter pane in your reports. You can add this new filter pane in an existing report or for all the new reports that you will create on Power BI Desktop. From the new filter pane, you can apply filters on a page or on the entire report, format the filter pane to match it with the report’s theme, etc. Also, you can lock filters, hide applies filters from the customers, and change the filter state.
Add Filter Pane for all New Reports
To add the new filter pane for all new reports that you’ll make in the future, follow these steps:
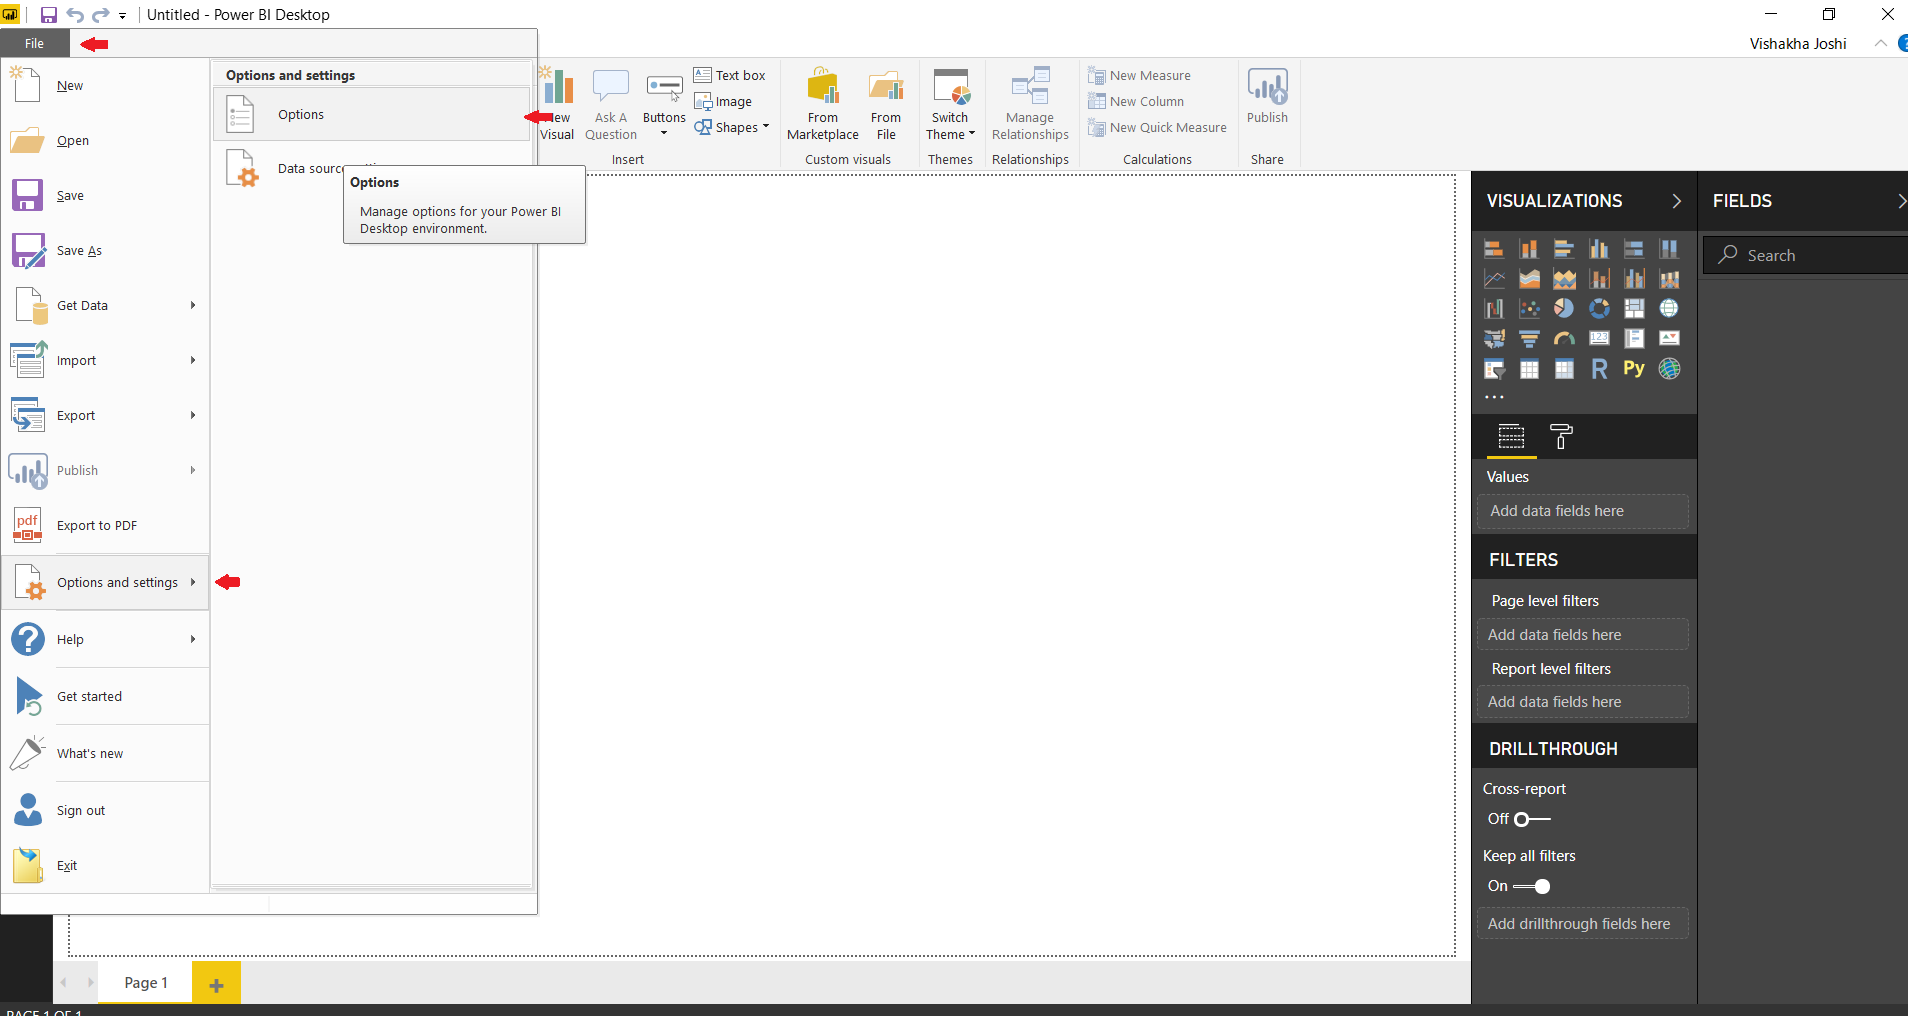
Open Power BI Desktop and go to File tab> Options and settings> Options.
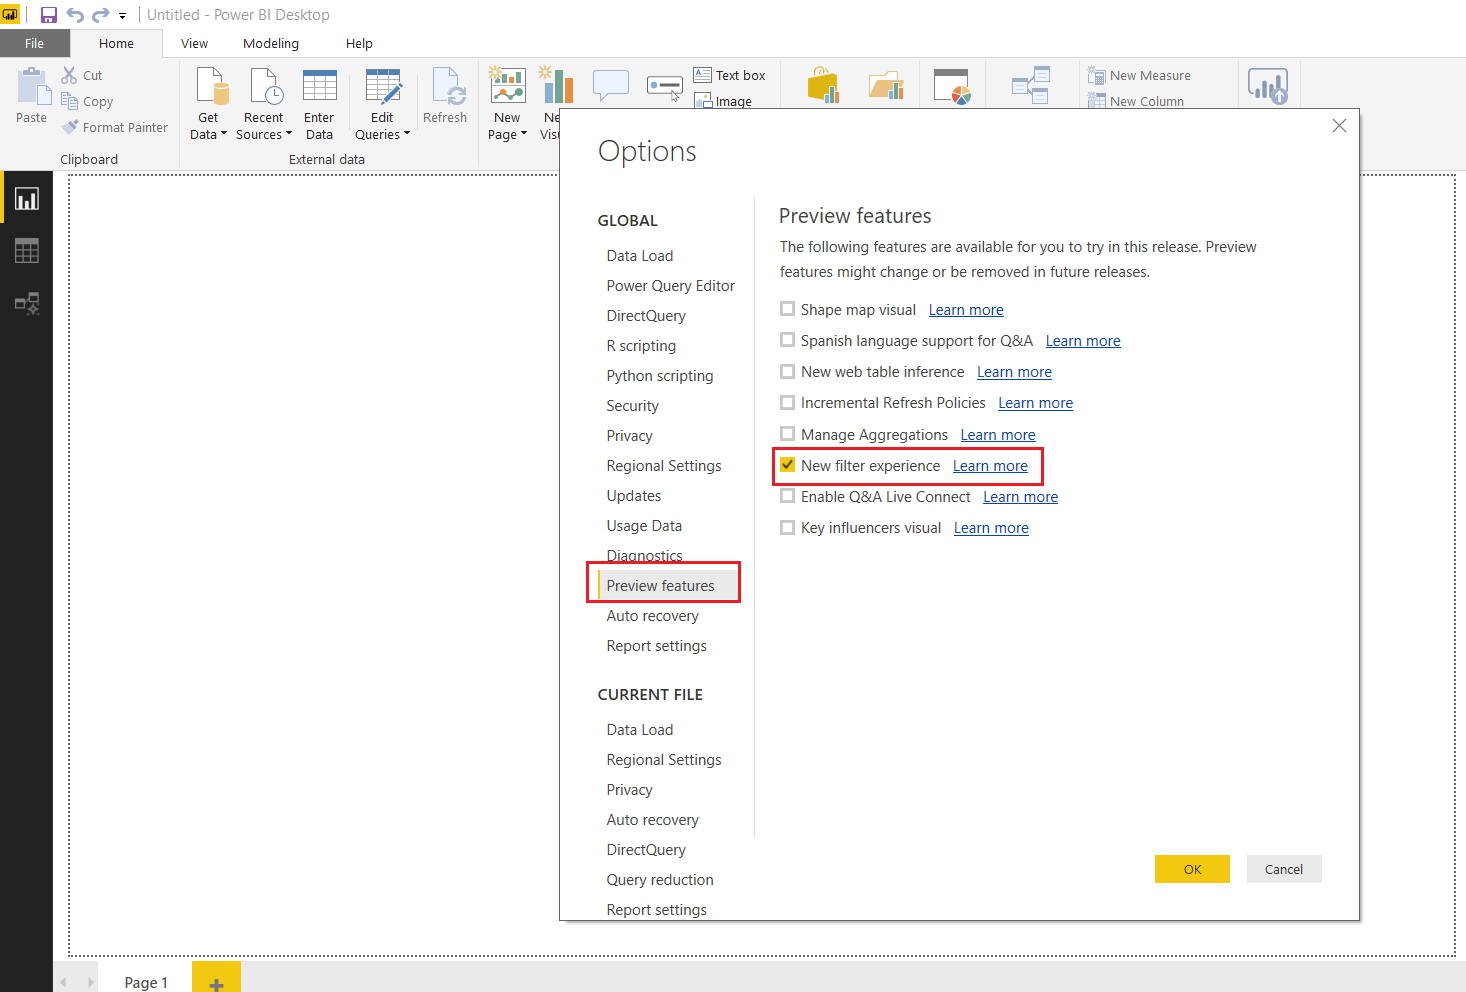
From the Options dialog box, select Preview features option. From the available list of options, check the box for “New filters experience”. Click on OK.
Add Filter Pane for an Existing Report
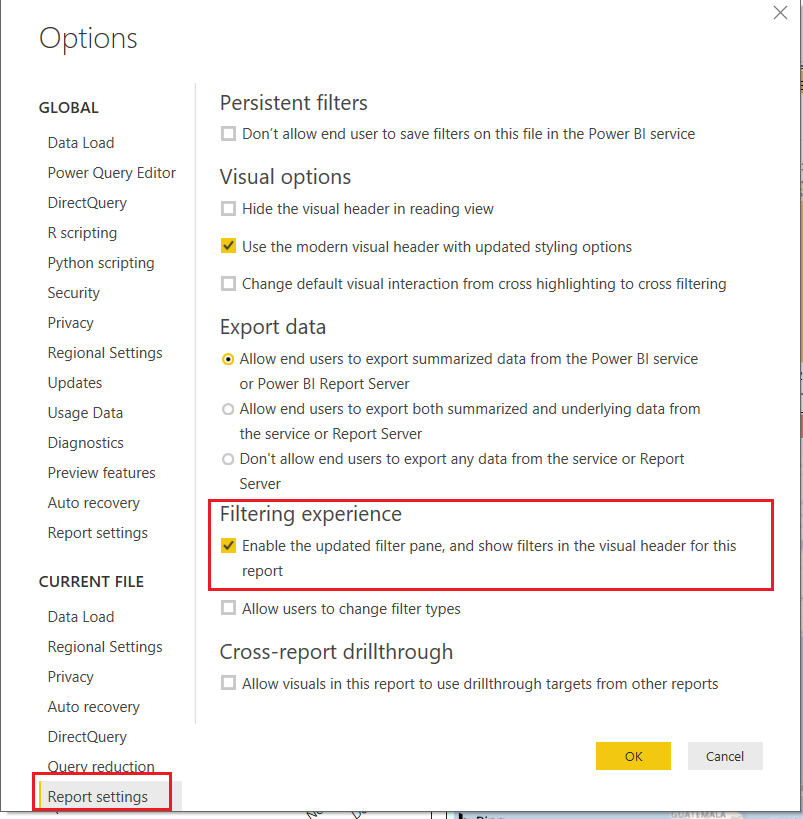
To add the filter pane for an existing report, open the report and go to File tab> Options and settings> Options. Then, select Report settings. In the Filtering experience section, select “Enable the updated filter pane, and show filters in the visual header for this report”. Click on OK.
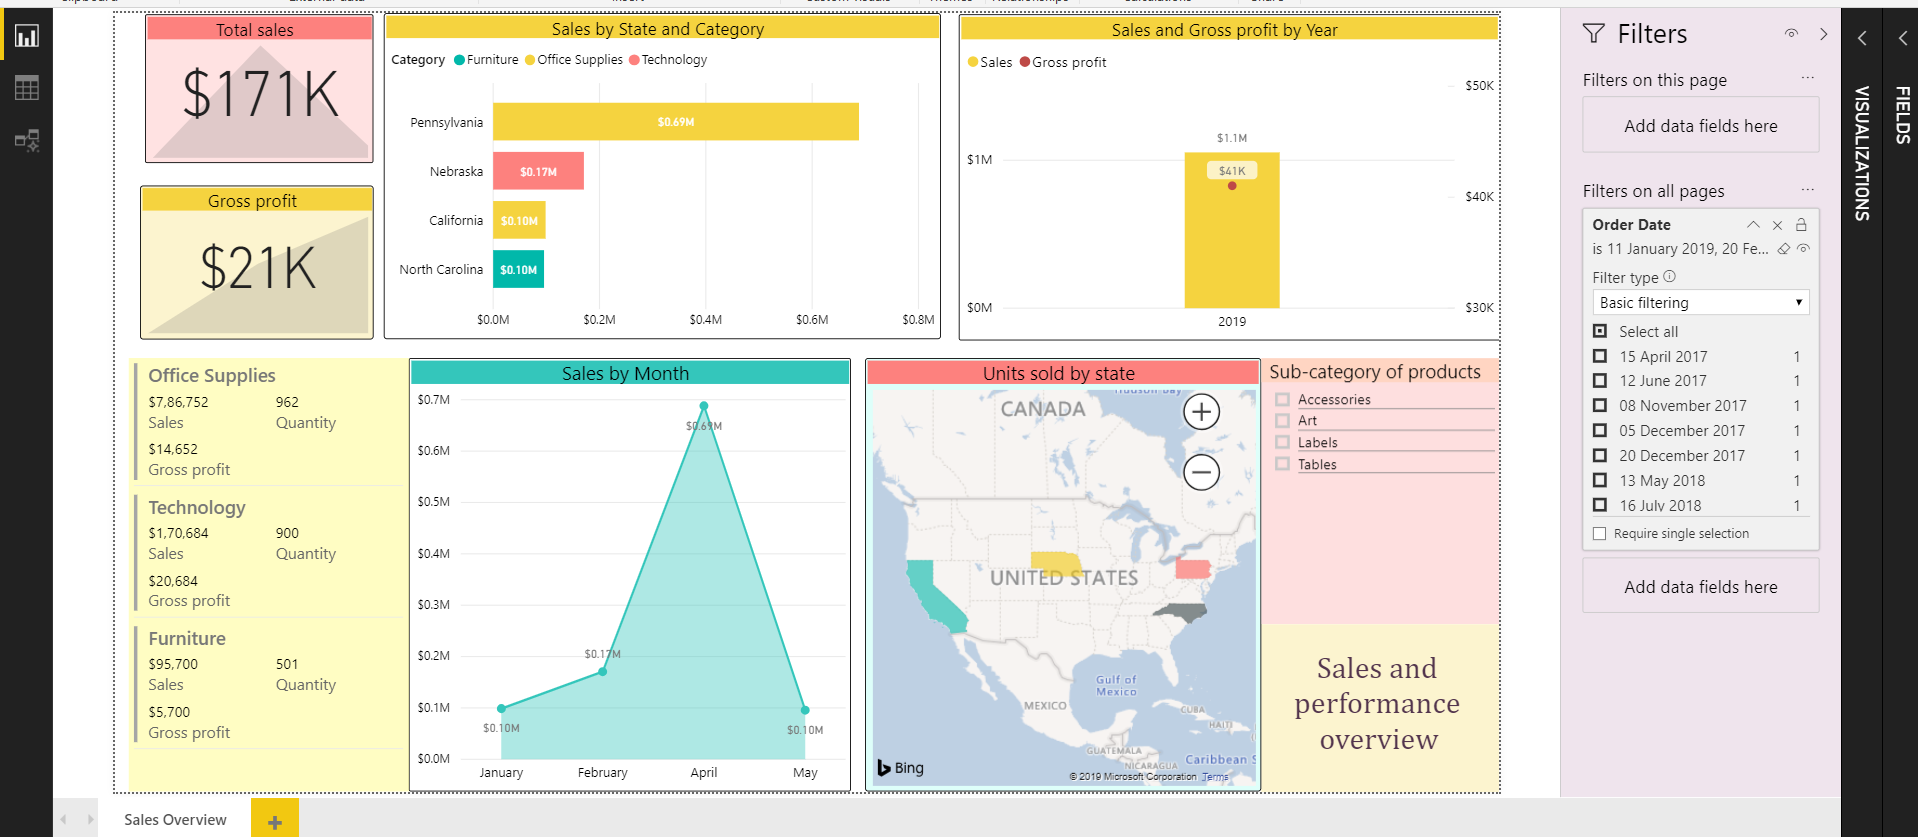
The new filter pane will get added on the right of your report editor.
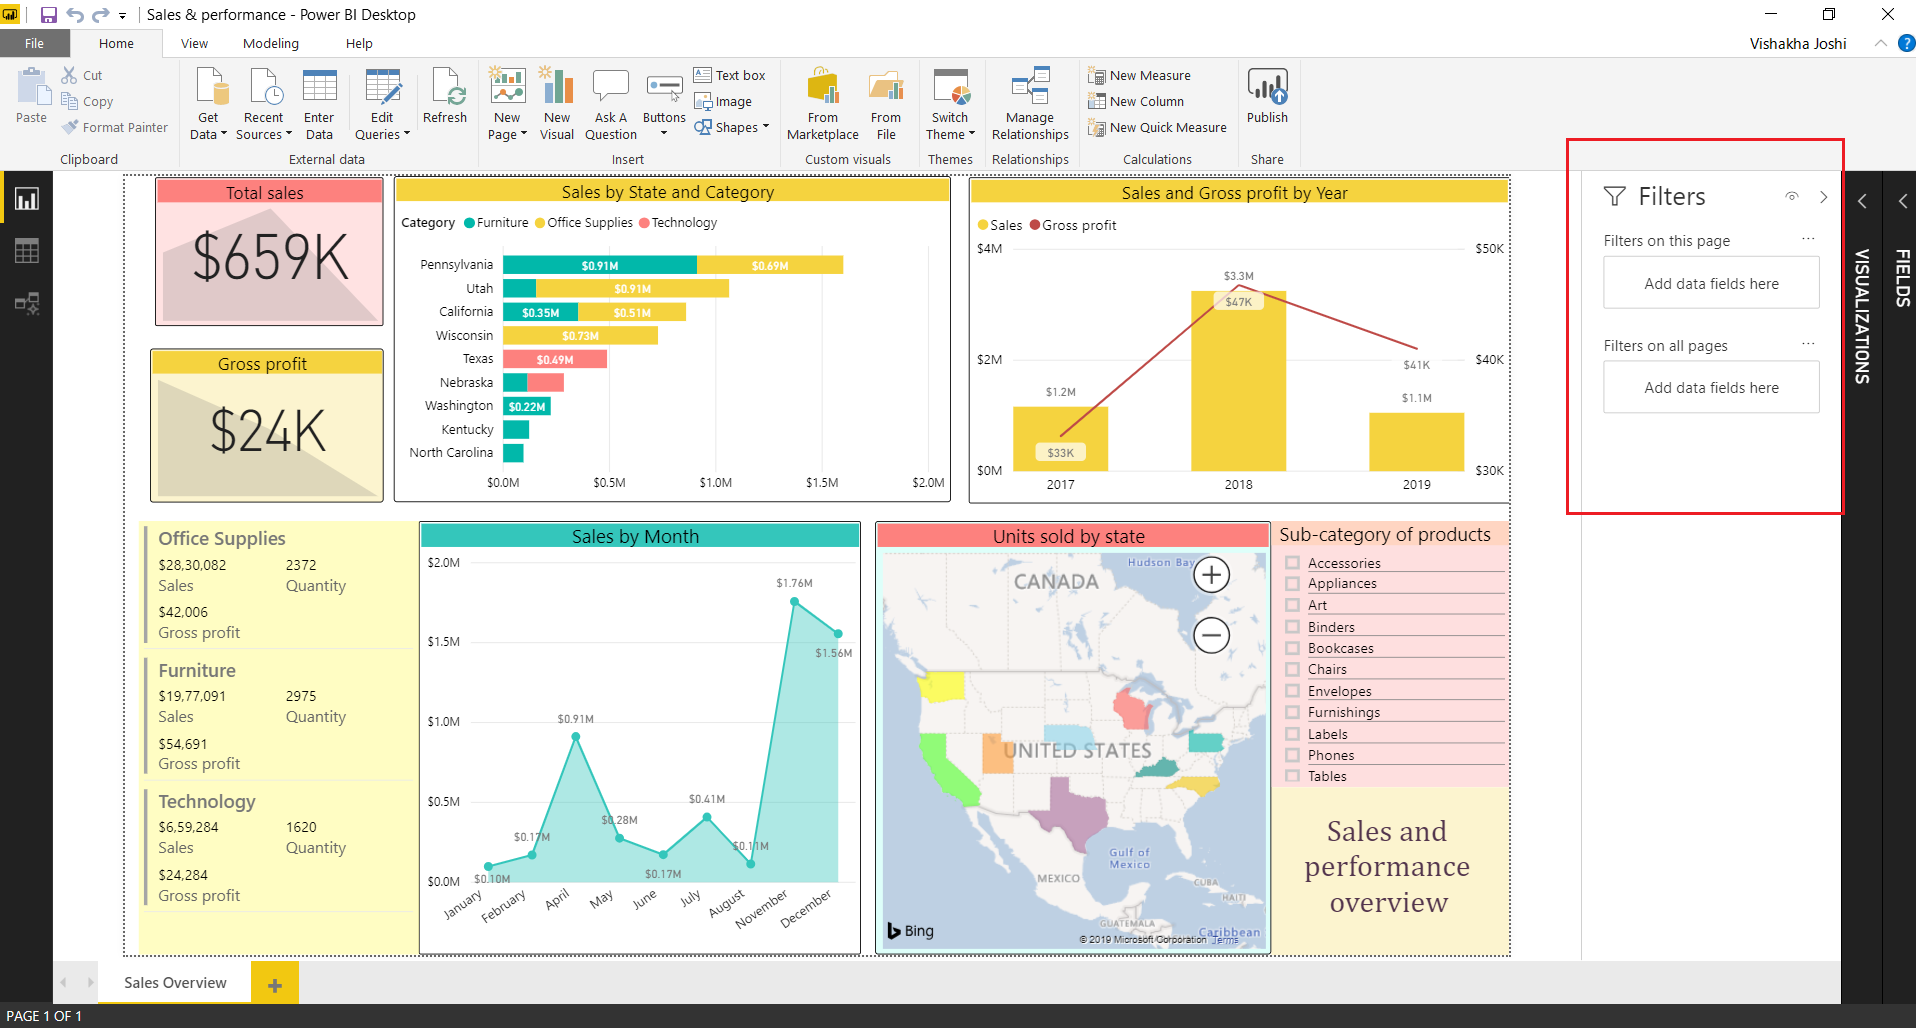
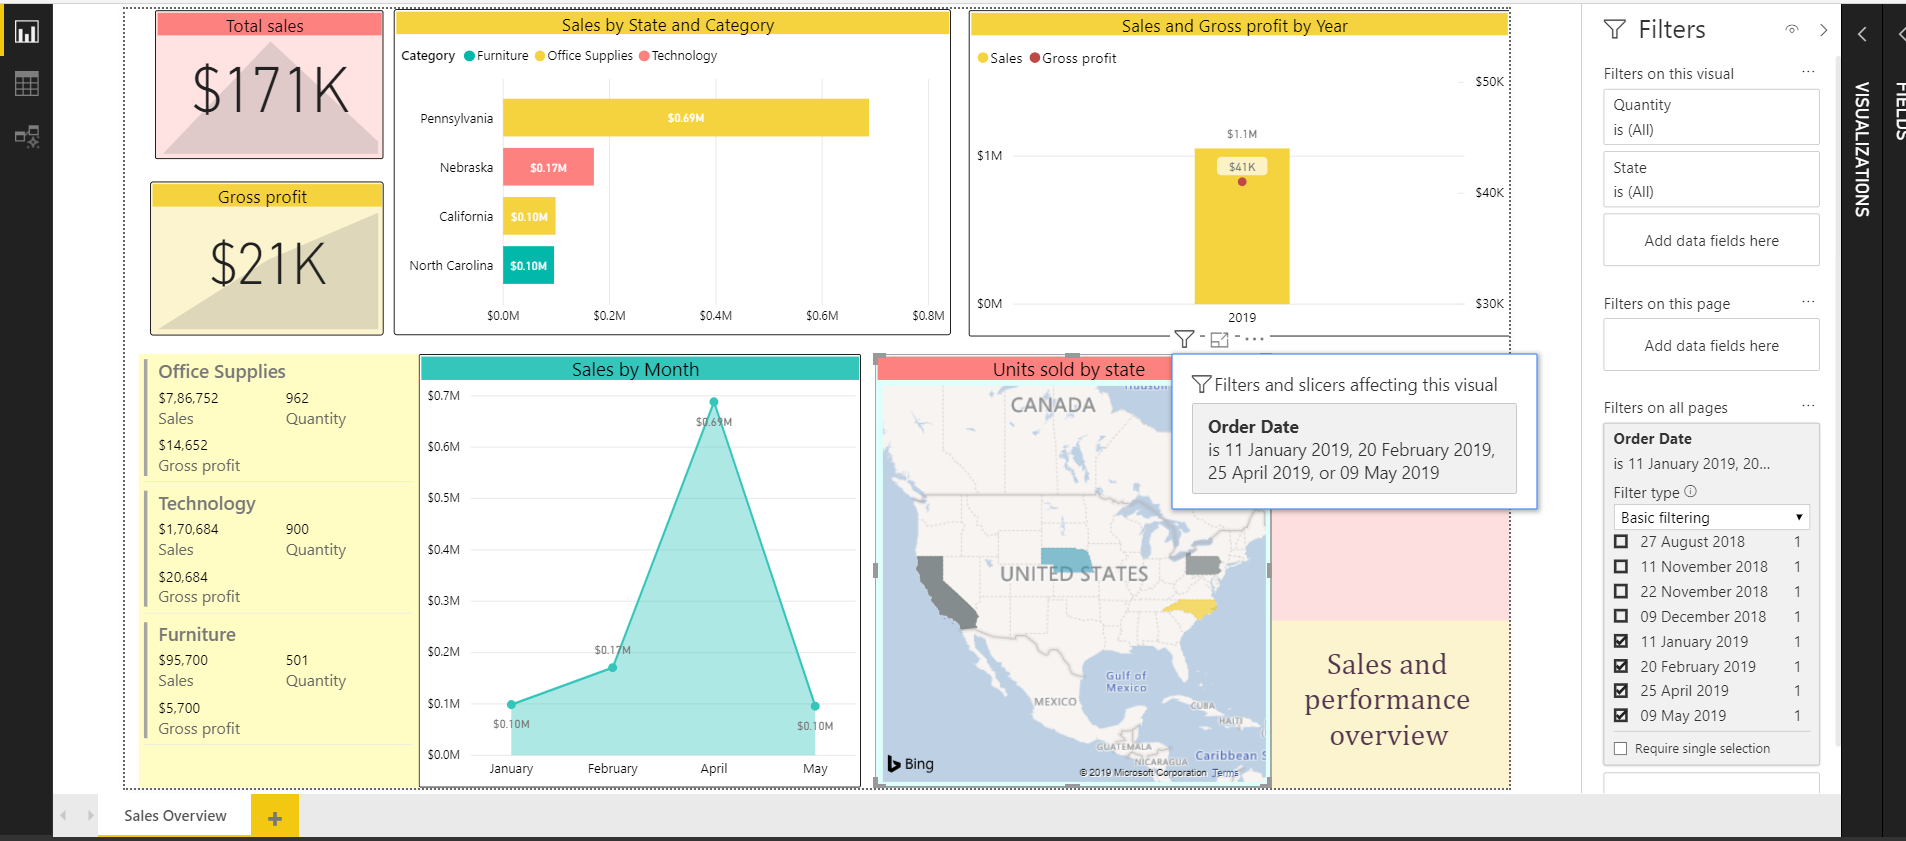
To apply filtering conditions on the visual/page/report, drag and drop the field on the respective column in the filter pane. For instance, we selected the field Order Date. After putting it on the filter pane, we selected all the dates of the year 2019. This filtered the information of all visuals to just 2019 related statistics. Each visualization will have a filter icon on the side of it whenever you hover over it. Click on that icon and you will see the details of currently applied filter on that visual.
Format the Filter Pane
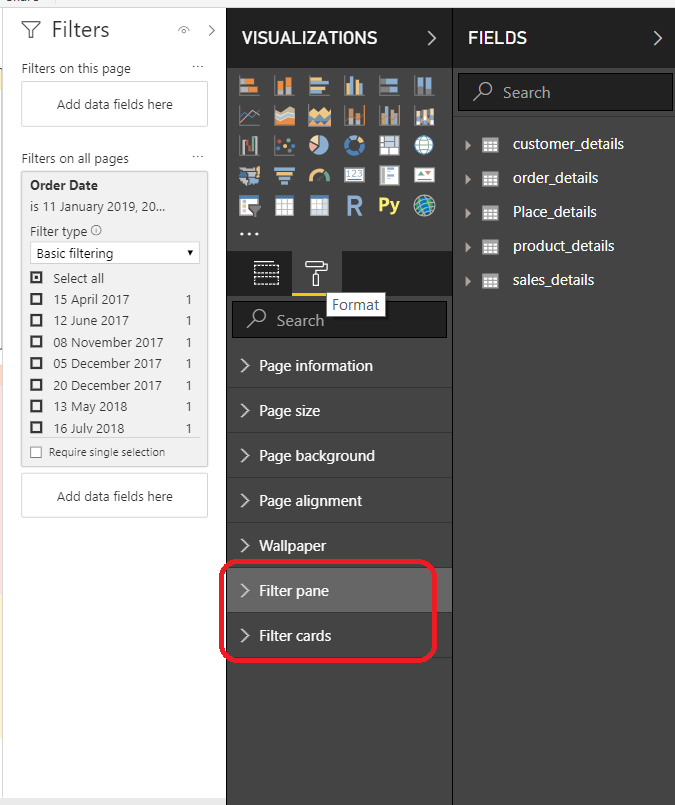
You can format this filter pane using the formatting options for filter pane and filter cards given on the right of report editor.
In the Filter pane option, you will get formatting options for background color, transparency, font+ icon color, title text size, header text size, font, etc. You can make changes here as you like.
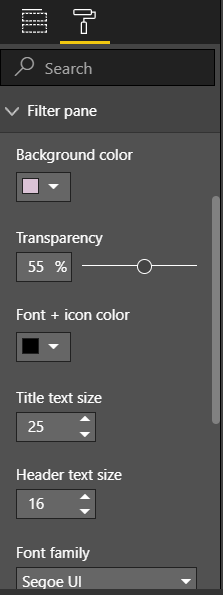
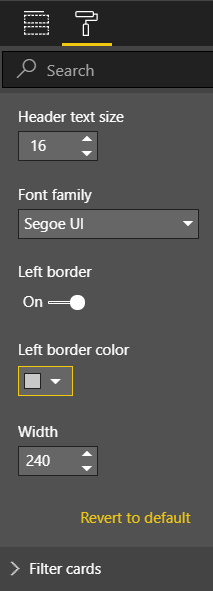
As you can see in the picture below, we have formatted our filter pane and changed its background color, font size, etc.
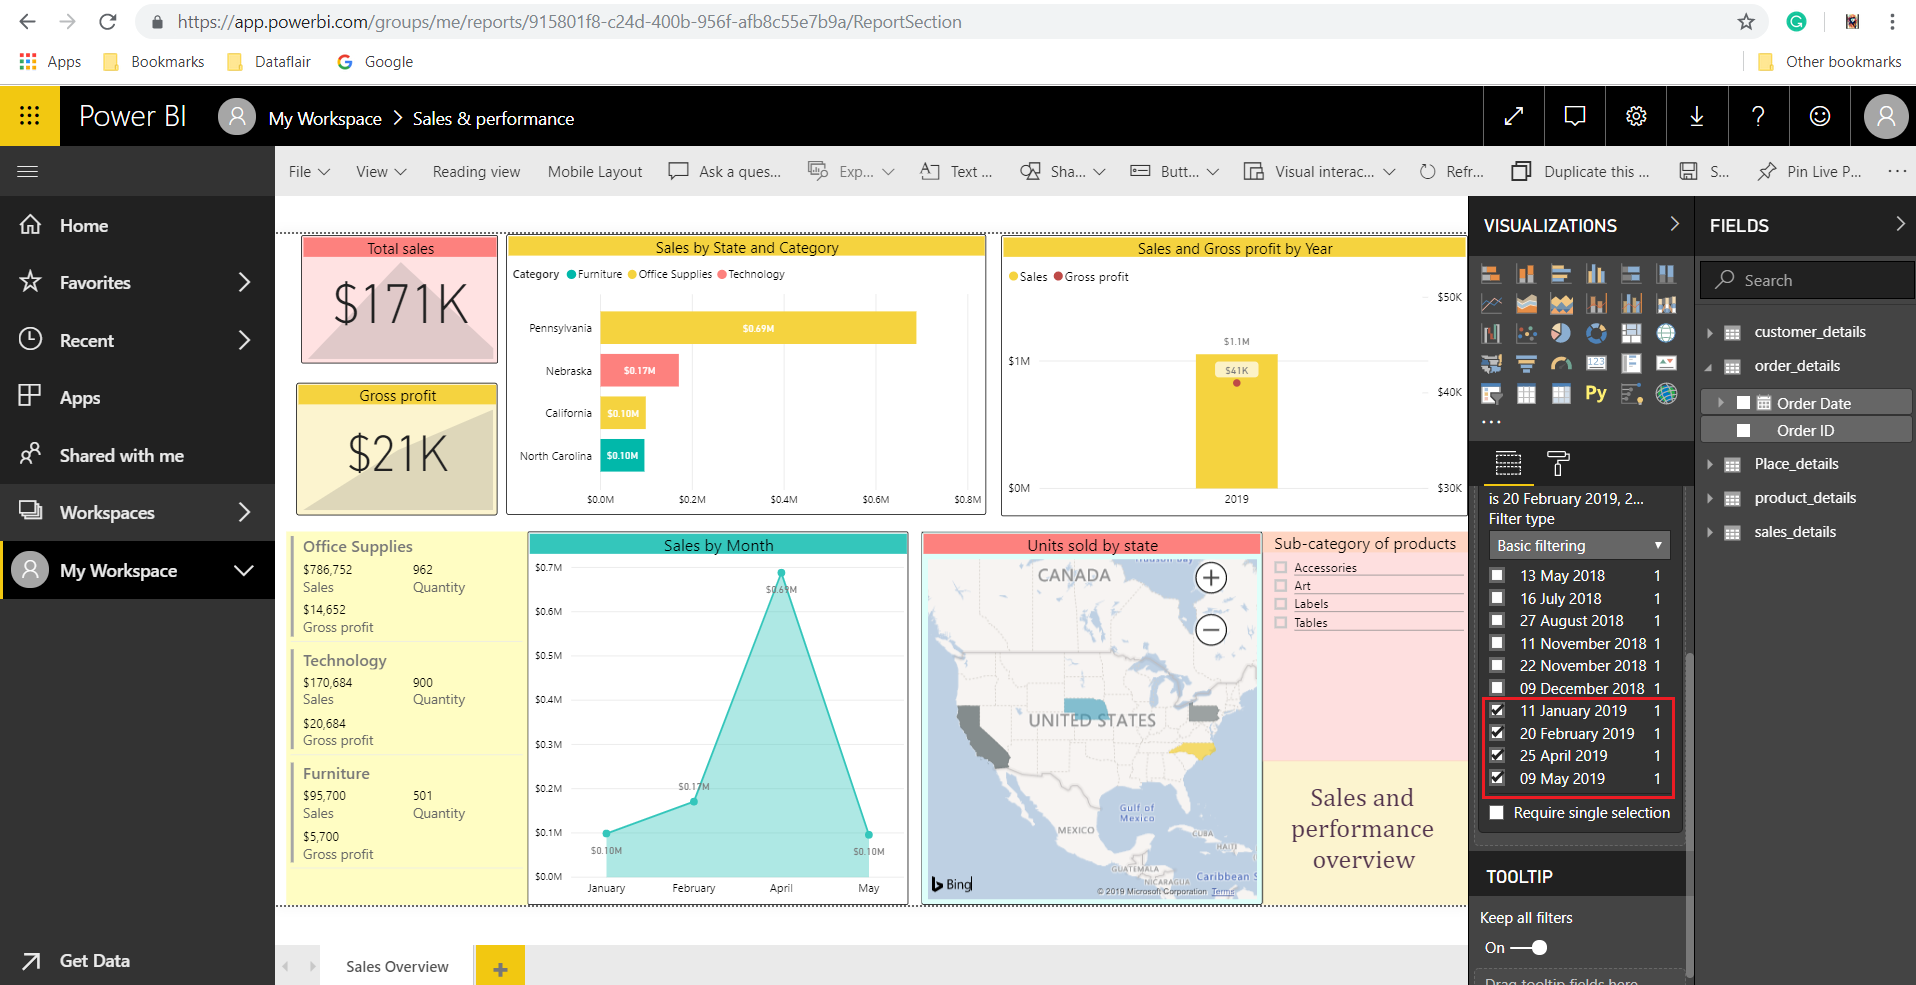
Apply Filters in Power BI Workspace
We have seen in our Power BI dashboard tutorial that we can publish Power BI reports on the web. You can use the filter there as well.
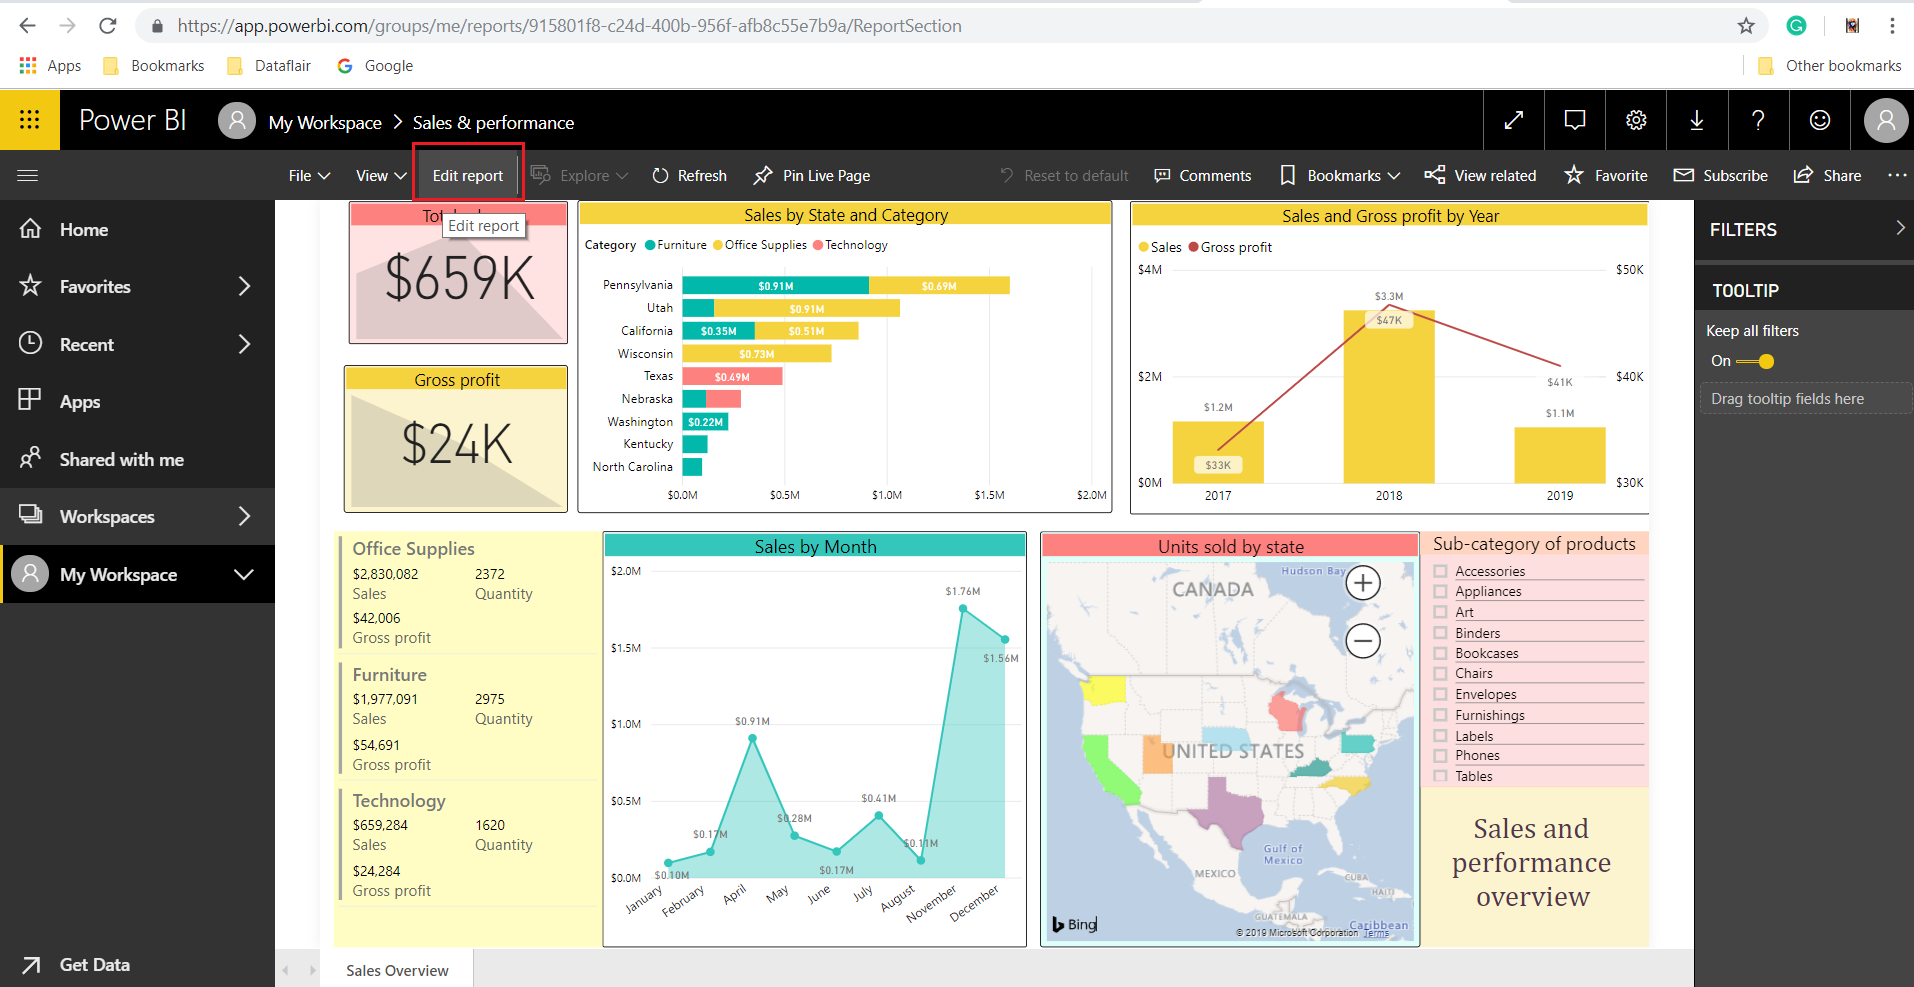
Open your Power BI workspace on the web. And, select a report that is already been uploaded on it. Once the report opens, you will see a Filters pane on the right, in which you will see the currently applied filters on the report or on an individual visualization.
Adding Filter in Edit Report Mode
To apply new filters on the report, go to Edit report option.
Drag and drop the fields of your choice on the Page level filters or Report level filters column.
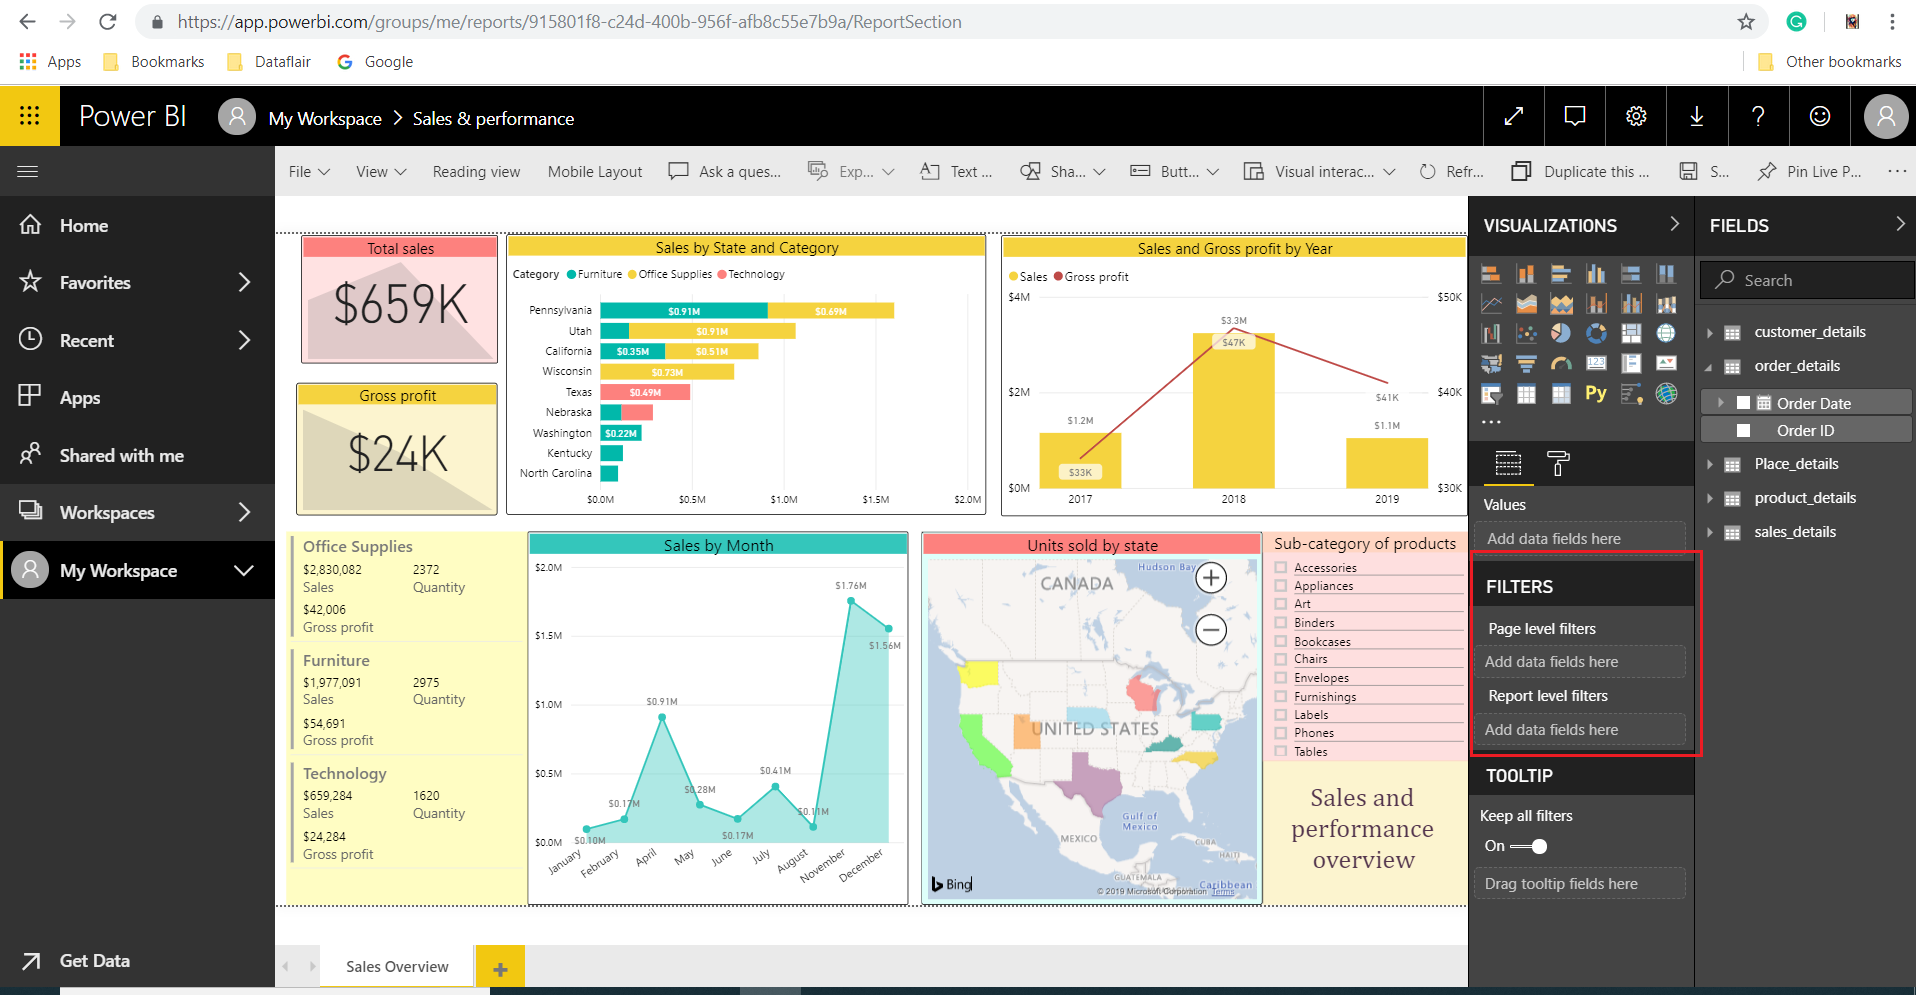
Select the values based on which you want to sort the information of the report. The visualizations of the report will automatically transform themselves as per the filters applied.
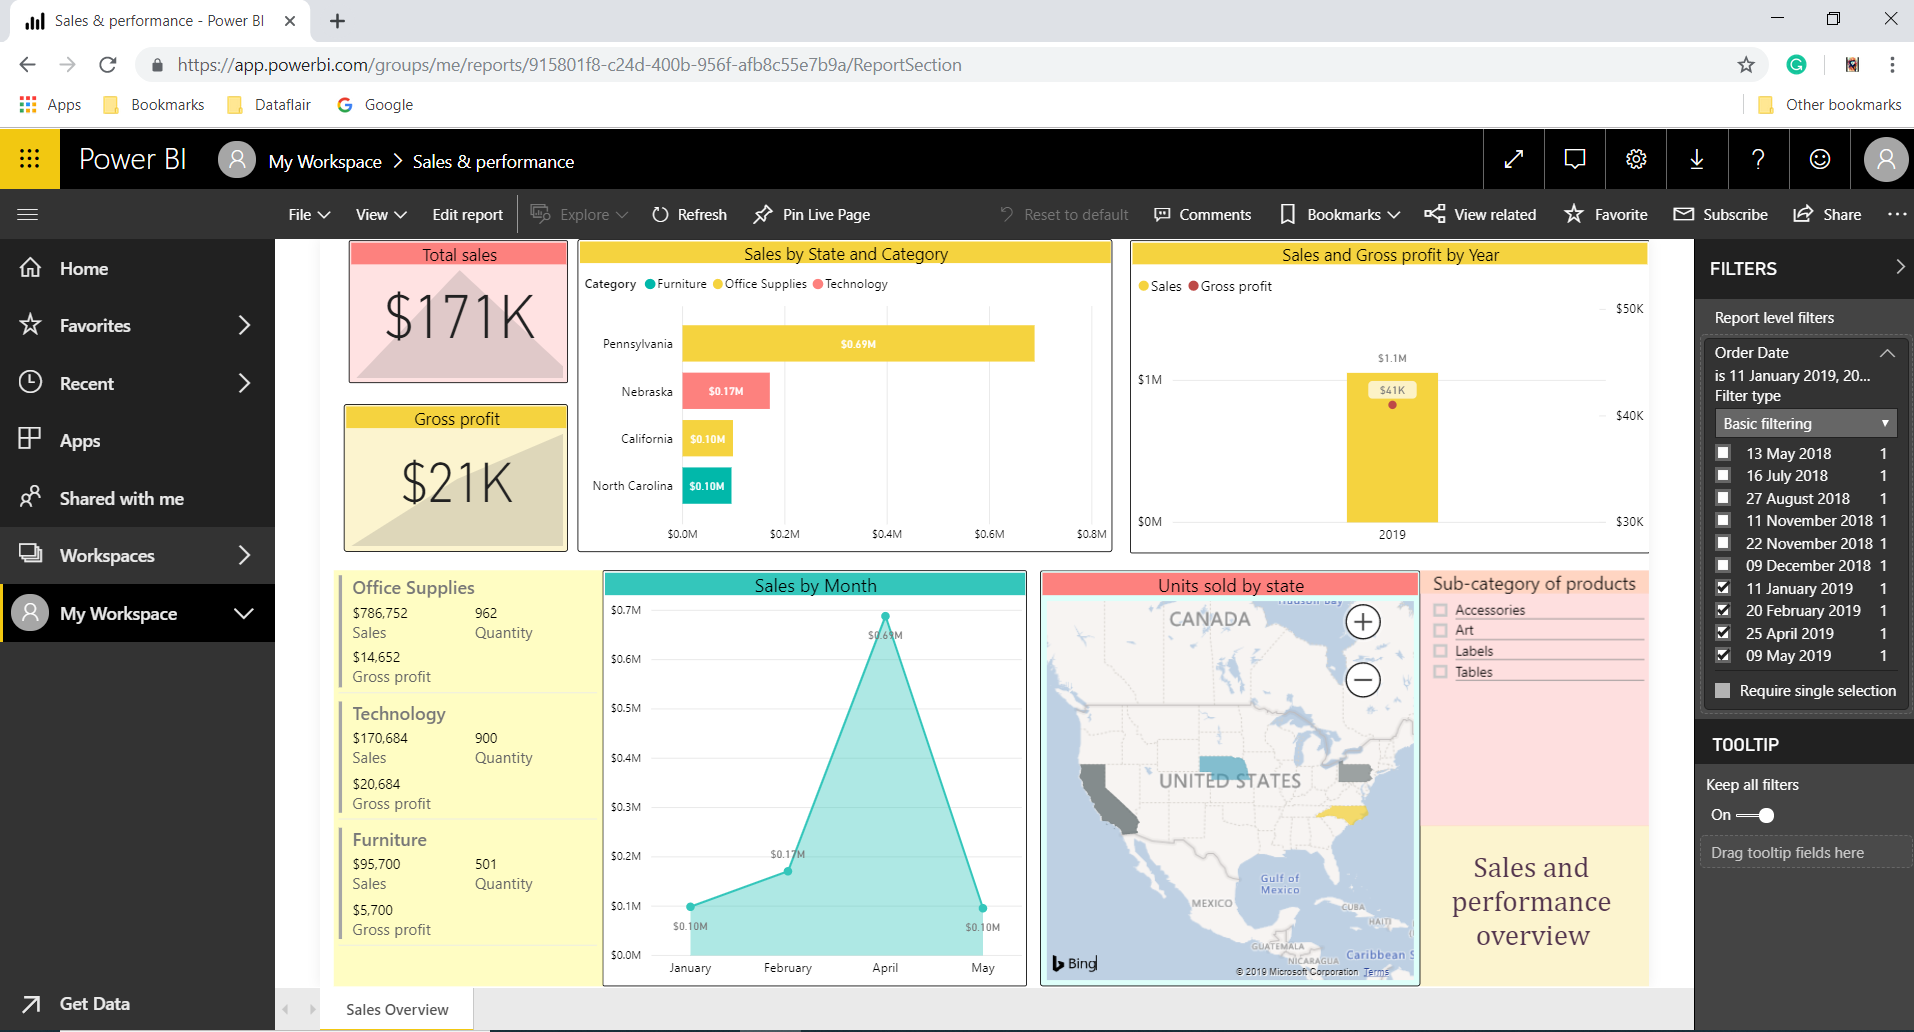
Filters in Reading view mode
In the reading view mode, one cannot edit i.e. add or remove the filters that are applied to the report. Rather, they can only view what are the current filters that are applied to the report by the report designer.
Summary
With this, we conclude our tutorial of Power BI filters. We hope our explanation was informative and helpful. With this information, you can easily work with filters in Power BI Desktop and apply filtering conditions on the data of a report. Power BI is an interactive tool and it instantly reacts to the filters applied on a report and changes it accordingly.
In case of any query or suggestion, leave your comments in the comment section below.
Get your first job in Power BI field by practicing Power BI Interview Questions
We work very hard to provide you quality material
Could you take 15 seconds and share your happy experience on Google


Your work is truly great ,Sir.Wish you more similar successes.