DAX in Power BI – Functions you need to be Aware Of!!
Job-ready Online Courses: Knowledge Awaits – Click to Access!
Another important topic that we have is DAX in Power BI. It is a very essential topic in Power BI, therefore we gave our best to provide you with a thorough article on the concepts and uses of DAX formulas while working on Power BI Desktop for data analysis.
So, let’s quickly start the tutorial.
DAX in Power BI
DAX stands for Data Analysis Expressions i.e. such expressions or formulas that are used for data analysis and calculations. These expressions are a collection and combination of functions, operators, and constants that are evaluated as one formula to yield results (value or values). DAX formulas are very useful in BI tools like Power BI as they help data analysts to use the data sets they have to the fullest potential.
With the help of the DAX language, analysts can discover new ways to calculate data values they have and come up with fresh insights.
Have a look at some key points about DAX which will help you understand the concept better.
- DAX is a functional language i.e. its complete code is always a function. An executable DAX expression may contain conditional statements, nested functions, value references, etc.
- DAX formulas have two primary data types; Numeric and Non-numeric or Others. The numeric data type includes integers, decimals, currency, etc. Whereas, the non-numeric consists of strings and binary objects.
- DAX expressions are evaluated from the innermost function going to the outermost one at the last. This makes formulating of a DAX formula important.
You can use values of mixed data types as inputs in a DAX formula and the conversion will take place automatically during execution of the formula. The output values will be converted into the data type you instructed for the DAX formula.
Importance of DAX in Power BI
It is natural to think why DAX is so important to learn for working efficiently on Power BI. Well, as we have seen in our previous tutorials, making reports using the functionalities of data importing, transforming and visualizing in Power BI is a smooth experience. A user needs to have basic knowledge of Power BI Desktop to create a decent report with all the available data. But, if you want to level up and use advanced calculations in your Power BI reports, you need DAX.
Let’s say you want to make a visual to analyze growth percentage across different states of a country or need to compare year-over-year growth/sales. The data fields that you import in a data table are generally not enough to be used for such purposes.
For this, you need to make new measures using DAX language. In this way, you can create new measures, use them for creating exclusive visualizations, and have unique insights into data. With such unique insights into data, you can have fitting solutions for the business problems that you might miss with the usual way of analysis. Thus, DAX makes data analysis using Power BI, a smart and intelligent approach.
DAX Formula – Syntax
The initial and most crucial step in learning any language is to break it down into definitive elements and understand its elements. And, that is why we study the syntax of a language. Given below is an example of the DAX formula. We will understand this formula and its syntax elements with the help of this example.
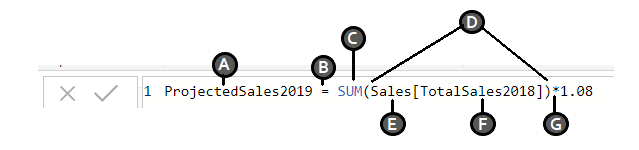
We have explained each syntax element labeled in the image in the points below:
A: It is the name of the new measure (Projected Sales 2019).
B: It is the equals sign (=) which is an operator indicating the start of the DAX formula and equating the two sides.
C: It is the DAX function used to add the values of a given field (Total Sales 2018) from a table (Sales). The function used here is SUM.
D: The parenthesis () is used to enclose and define arguments in an expression. Every function must have at least one argument.
E: It is the name of the table from which a field or column is taken in the formula (Sales).
F: It is the name of the field from which the formula will use the values. For instance, the function SUM will apply itself on the values of the column or field [Total Sales 2018] of the table Sales.
G: It is another operator used for multiplication. Although, the syntax elements from A to F constitutes the basic syntax of DAX.
Thus, in simpler words, this DAX formula commands the system to calculate the product of sum of the values in Total Sales 2018 and 1.08 (8% increase) and store the value in a new field or column known as Projected Sales 2019.
Want to know – How to Create Measures in Power BI Desktop?
DAX Calculation Types
So, apparently, the DAX formulas can also be called as calculations as they calculate an input value and return a resultant value. You can create two types of expressions or calculations using DAX in Power BI; calculated columns and calculated measures.
- Calculated Columns: The calculated columns create a new column in your existing table. The only difference between a regular column and a calculated column is that it is necessary to have at least one function in the calculated column. These are used when you want to create a column with filtered or sorted information.
To create a calculated column:
- Go to the Modeling tab in Power BI Desktop.
- Then select New Column option. A Formula bar will open showing “Column =”. You can replace the “Column” word with the column name you want.
- After this, enter the expression for the calculated column on the right of the equals to sign.
- Calculated Measures: A calculated measure creates a field having aggregated values such a sum, ratios, percentages, averages, etc.
To create a calculated measure:
- Go to the Modeling tab in Power BI Desktop.
- Then select New Measure option. A Formula bar will open showing “Measure =”. You can replace the “Measure” word with the measure name you want.
- After this, enter the expression for the calculated measure on the right of the equals to sign.
- Once you create the measure, you can modify your measure name with a calculator icon next to it, under the table name you created the measure in.
DAX Functions
A DAX function is a predefined formula which performs calculations on values provided to it in arguments. The arguments in a function need to be in a particular order and can be a column reference, numbers, text, constants, another formula or function, or a logical value such as TRUE or FALSE. Every function performs a particular operation on the values enclosed in an argument. You can use more than one argument in a DAX formula.
Key Points about DAX Functions
Here are some unique facts about DAX functions that you must know in order to understand them better:
- Any DAX function always refers to a complete column/field or a table. It will never refer to individual values. If you want to use the functions on separate values within a column, you need to apply filters in a DAX formula.
- DAX functions provide the flexibility to create a formula that is applied on a row-by-row basis. The calculations or formulas get applied as per the context of the values in each row.
- In some cases, DAX functions return a full table which can be used in other DAX formulas that need a complete set of values. However, you cannot display this table’s contents.
- DAX functions have a category known as time intelligence functions. Such functions are used to calculate time/date ranges and periods.
Types of DAX functions
1. Date and Time Functions
The date time functions carry out calculations on the date and time values. The data type of these values is always datetime data type.
- CALENDAR
- CALENDARAUTO
- DATE
- DATEDIFF
- DATEVALUE
- DAY
- EOMONTH
- HOUR
- MINUTE
- MONTH
- NOW
- SECOND
- TIME
- TIMEVALUE
- TODAY
- WEEKDAY
- WEEKNUM
- YEAR
- YEARFRAC
2. Time Intelligence Functions
The time-intelligence functions are used to evaluate values over a fixed period such as days, weeks, months, quarter, years, etc. You can specify a time period using these functions and compare two scenarios in your report.
- CLOSINGBALANCEMONTH
- CLOSINGBALANCEQUARTER
- CLOSINGBALANCEYEAR
- DATEADD
- DATESBETWEEN
- DATESINPERIOD
- DATESMTD
- DATESQTD
- DATESYTD
- ENDOFMONTH
- ENDOFQUARTER
- ENDOFYEAR
- FIRSTDATE
- FIRSTNONBLANK
- LASTDATE
- NEXTQUARTER
- LASTNONBLANK
- NEXTDAY
- NEXTMONTH
3. Information Functions
The information functions are used to provide certain information on the data values contained in rows and columns. It evaluates the given condition in a function for the value given and return TRUE or FALSE. For instance, the function ISERROR will return TRUE if the value evaluated contains an error.
- CONTAINS
- CUSTOMDATA
- IN Operator / CONTAINSROW function
- ISBLANK
- ISERROR
- ISEVEN
- ISINSCOPE
- ISLOGICAL
- ISNONTEXT
- ISNUMBER
- ISODD
- ISONORAFTER
- ISTEXT
- LOOKUPVALUE
- USERNAME
4. Logical Functions
The logical functions are used to evaluate an expression or argument logically and return TRUE or FALSE if the condition is met or not.
- AND
- FALSE
- IF
- IFERROR
- IN
- NOT
- OR
- SWITCH
- TRUE
5. Mathematical and Trigonometric Functions
The mathematical and trig functions are used to perform all sorts of mathematical functions on the referred values. Given below, is a list of all the available math and trig DAX functions in Power BI.
- ABS
- ACOS
- ACOSH
- ASIN
- ASINH
- ATAN
- ATANH
- CEILING
- COMBIN
- COMBINA
- COS
- COSH
- CURRENCY
- DEGREES
- DIVIDE
- EVEN
- EXP
- FACT
- FLOOR
6. Statistical Functions
These functions carry out statistical and aggregation functions on data values in a DAX expression in Power BI. The list of available statistical functions is given below.
- ADDCOLUMNS
- APPROXIMATEDISTINCTCOUNT
- AVERAGE
- AVERAGEA
- AVERAGEX
- BETA.DIST
- BETA.INV
- CHISQ.INV
- CHISQ.INV.RT
- CONFIDENCE.NORM
- CONFIDENCE.T
- COUNT
- COUNTA
- COUNTAX
- COUNTBLANK
- COUNTROWS
- COUNTX
- CROSSJOIN
- DISTINCTCOUNT
- EXPON.DIST
- GENERATE
- GENERATEALL
- GEOMEAN
- GEOMEANX
- MAX
- MAXA
- MAXX
- MEDIAN
- MEDIANX
- MIN
- MINA
- MINX
7. Text Functions
The text functions in Power BI are very similar to the string functions of Excel. These functions evaluate string values.
- BLANK
- CODE
- COMBINEVALUES
- CONCATENATE
- CONCATENATEX
- EXACT
- FIND
- FIXED
- FORMAT
- LEFT
- LEN
- LOWER
- MID
- REPLACE
- REPT
- RIGHT
- SEARCH
- SUBSTITUTE
- TRIM
- UNICHAR
- UPPER
- VALUE
8. Parent-Child functions
The parent and child functions are used for data values that are a part of a parent-child hierarchy.
- PATH
- PATHCONTAINS
- PATHITEM
- PATHITEMREVERSE
- PATHLENGTH
9. Other functions
There a bunch of functions that do not fit in any particular category. These are also very useful functions.
- DATATABLE
- ERROR
- EXCEPT
- GENERATESERIES
- GROUPBY
- INTERSECT
- ISEMPTY
- ISSELECTEDMEASURE
- NATURALINNERJOIN
- NATURALLEFTOUTERJOIN
- SELECTEDSMEASURE
- SELECTEDMEASUREFORMATSTRING
- SELECTEDSMEASURENAME
- SUMMARIZECOLUMNS
- Table Constructor
- TREATAS
- UNION
- VAR
10. Table functions
The table functions in DAX formulas for Power BI are used to apply operations and conditions on entire tables. The output of table functions is used as inputs in other expressions or arguments in a DAX formula. The results of these functions retain the relationships between columns of that table.
- FILTER
- ALL
- VALUES
- DISTINCT
- RELATEDTABLE
Let’s explore How to Create Power BI Dashboard
DAX Context
The concept of DAX context is essential in gaining a complete understanding of DAX language and how it works in Power BI. There are two types of DAX contexts; Row context and Filter context.
- Row context: Row context means taking into account a specific row that has been filtered in a DAX expression. The row context focuses on the operation of the formula on the current row. This type of context is most often applied to the measure rows.
- Filter context: The filter context takes focusing on values one step ahead. In row context, we were filtering out and applying operations on specific rows. But in filter context, the expression applies a filter to focus on specific values within a row. Thus, the filter context is applied in addition to the row context to narrow down the scope of calculation to specific values. Filter context is applied when we use functions like CALCULATE, FILTER, RELATED, ALL, etc.
Creating a Measure Formula using DAX
Step 1: To create a measure using the DAX formula, open your Power BI Desktop app. In the Power BI Desktop, you can create a new measure in two ways. One, right-click on the table’s name in which you wish to add the measure field and select New measure.
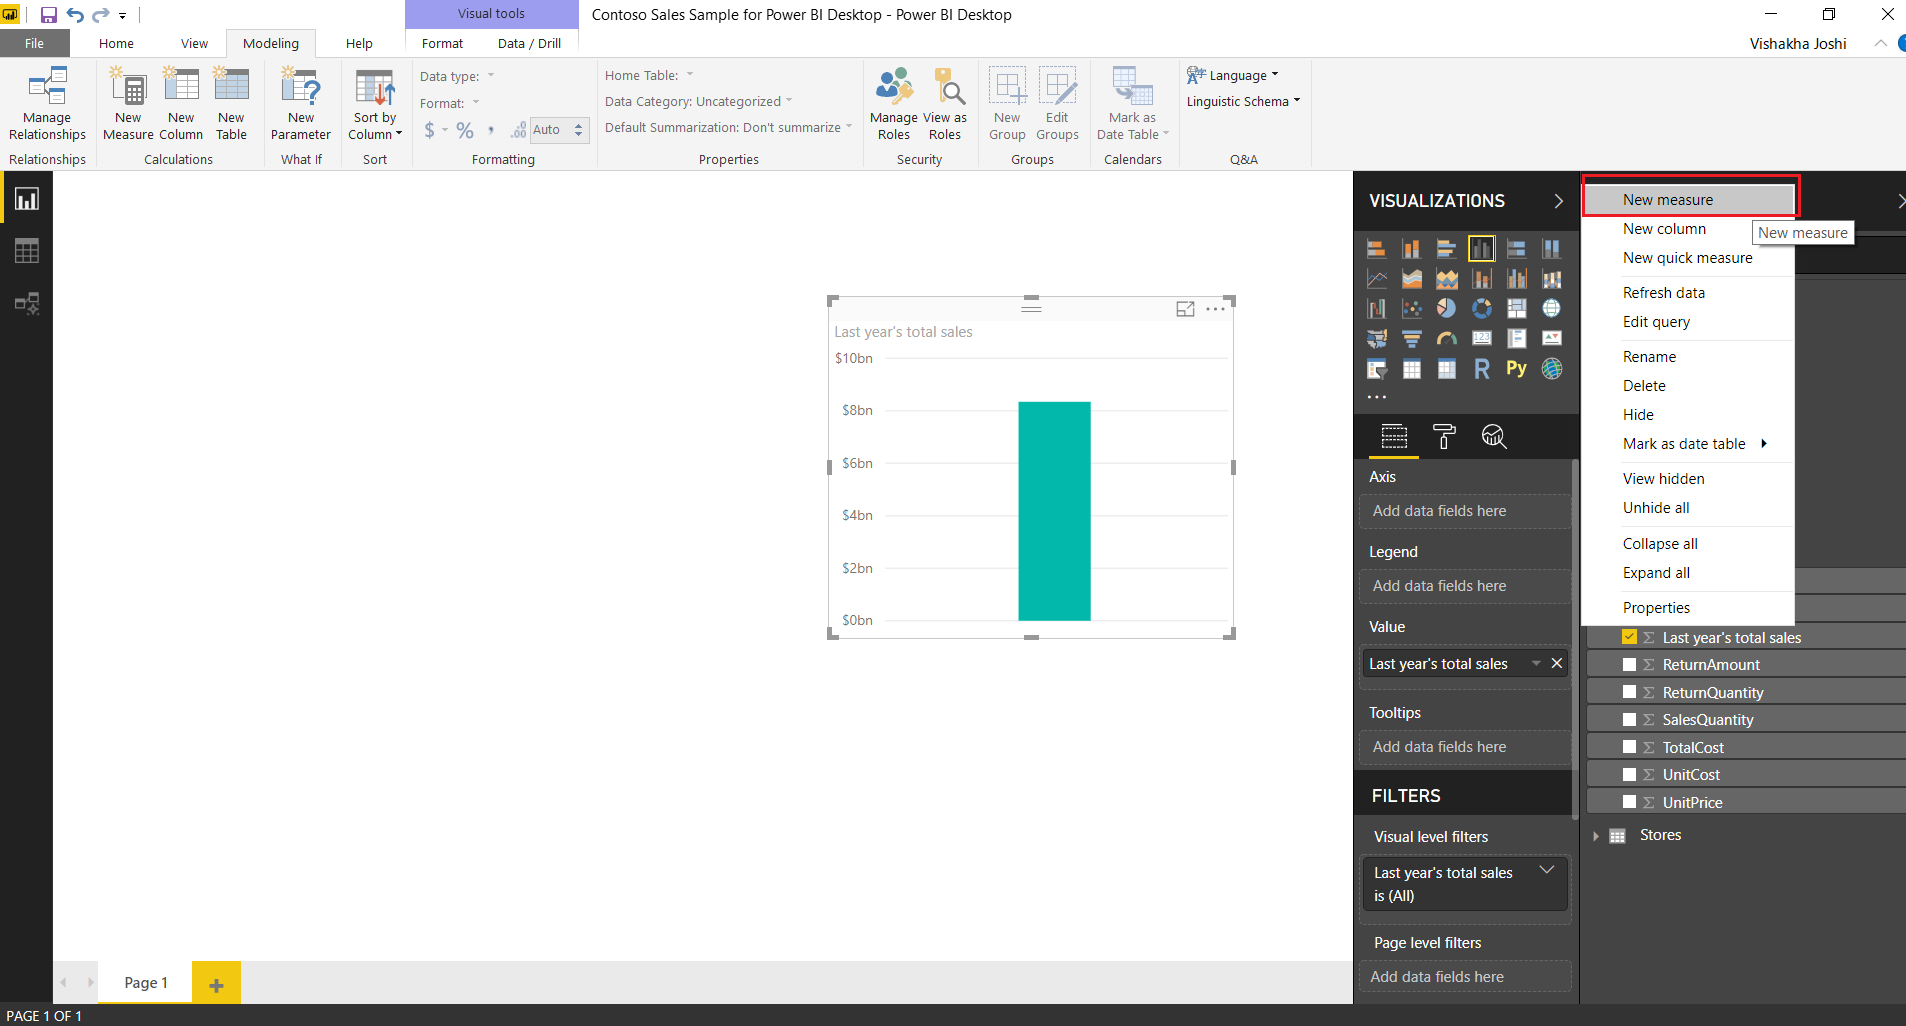
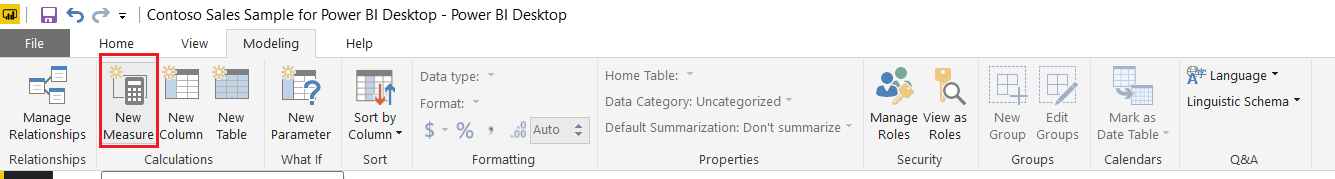
Or, you can go to the Modeling tab and click on New measure option.
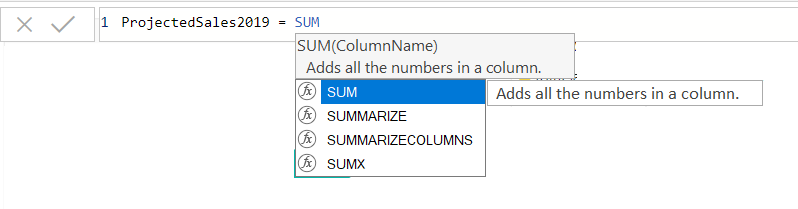
Step 2: In the formula bar, start with entering the name of your new measure. In the supposed scenario, we are using the name ProjectedSales2019.
![]()
Step 3: Next, enter the name of the function that you want to use. Start typing the name of the function and suggestions will appear in the list. A small section showing a description of the function you selected will also appear. Notice in the image below where we have selected the SUM function.
Step 4: Then, put a parenthesis “()” and write the name of the table or column you are referring to.
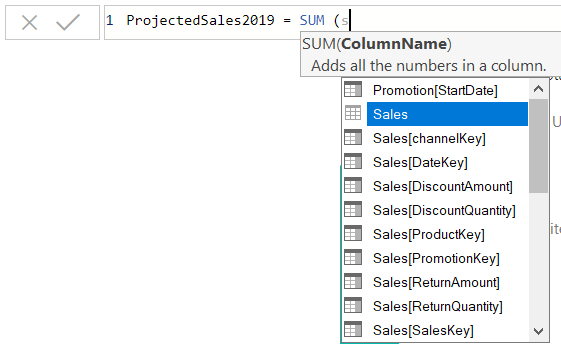
Step 5: You can also specify a column within that table. The function will apply to the values within the selected column. Close the parenthesis.

Step 6: Further, you can add more operators, other functions, constants to increase the complexity of the formula.
![]()
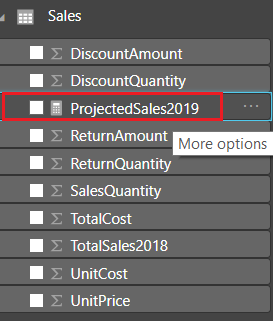
The DAX formula that we created will create a new measure named “ProjectedSales2019”.
ProjectedSales2019 = SUM(Sales[TotalSales2018])* 1.08
Here, we have multiplied the sum of previous year’s (2018) sales by 1.08 because an increase in sales by 8% is expected in the year 2019. This will give us the projected sales for the year 2019.
Step 7: Save this and your newly created measure will appear in the Fields column under the table Sales. Every measure field created like this has a calculator icon beside it.
Summary
With this, we conclude our tutorial on DAX in Power BI. We hope the information provided here was helpful enough to give you a fundamental knowledge of DAX formulas. You can create any logically sound DAX formula by using the existing columns and tables in your Power BI to make more detailed and advanced reports.
Share your feedback through comments.
Check out the best article for your Power BI Interview- Power BI Interview Questions
Did you know we work 24x7 to provide you best tutorials
Please encourage us - write a review on Google


Great content. Thanks!!
Great content 💯 Thanks for sharing
brilliant. Do you teach PowerBI?