Creating and Using Measures in Power BI – A Complete Learning!
Job-ready Online Courses: Knowledge Awaits – Click to Access!
In this tutorial, we are going to learn about measures in Power BI. Dealing with a huge set of data coming in from different data sources can be challenging and demanding. While most of the business intelligence tools come loaded with all sorts of functionalities for data extraction, preparation, transformation, visualization, and reporting, there might be some areas where you need a little extra. Measures are those extras in Power BI which strengthens reporting capabilities even more.
So, let’s get started with our tutorial on measures in Power BI and learn how to use them.
Measures in Power BI
Power BI desktop offers a wide range of functionalities to create reports and insights into data easily. But still, there might be some areas or points in a report where you feel that you cannot represent what you want with the data that you have. For such cases, you can create your own measures in Power BI. Measures enable creating advanced solutions and models in Power BI for data analysis and reporting. So, measures perform real-time calculations based on your interactions with data on your report.
Usually, measures are used in aggregation calculations such as sum, average, minimum value, maximum value, counts or more advanced level calculations made using DAX formula. So, in other words, measures are like formulas that are calculated. Then it produces a result specific to the purpose and values it is used for.
The values that measure yield are not saved in RAM storage because measures are used relatively and may have different values when used in different scenarios and contexts.
You can create new measure fields for your analysis easily in Power BI desktop. In the sections to follow, we will learn how to create a measure in Power BI desktop.
Wait!! Have you checked the Power BI Desktop Tutorial
Prerequisites to Working on Measures in Power BI
The first and most basic prerequisite for you to be able to create and work with measures is that you must be familiar with Power BI desktop. You must know some basic operations such as importing data using Get Data and Query Editor, creating data models, formatting fields, working with multiple associated tables, and creating a report. If you are well versed with working on Power BI desktop, you can easily work with measures to create more complex data analysis reports.
Download this sample data report, Contoso sales sample for Power BI Desktop to understand measures better. Work with us using this dataset and report on Power BI Desktop. We will learn how to create a measure in Power BI from the fields given in this sample Power BI report.
Creating and Using a Measure in Power BI
Usually, whenever you import a field from a dataset and use it in a visualization in Power BI desktop, the software automatically calculates the values according to selected aggregation type. But if that is not enough, you can always create your own measure. Measures in Power BI are used for advanced calculations as they evaluate Data Analysis Expressions (DAX) to give out the results from complex queries. Power BI desktop offers a library having about 200 DAX functions to perform complex calculations. In this section, we’ll see how to create measures in Power BI desktop.
Follow the steps given below –
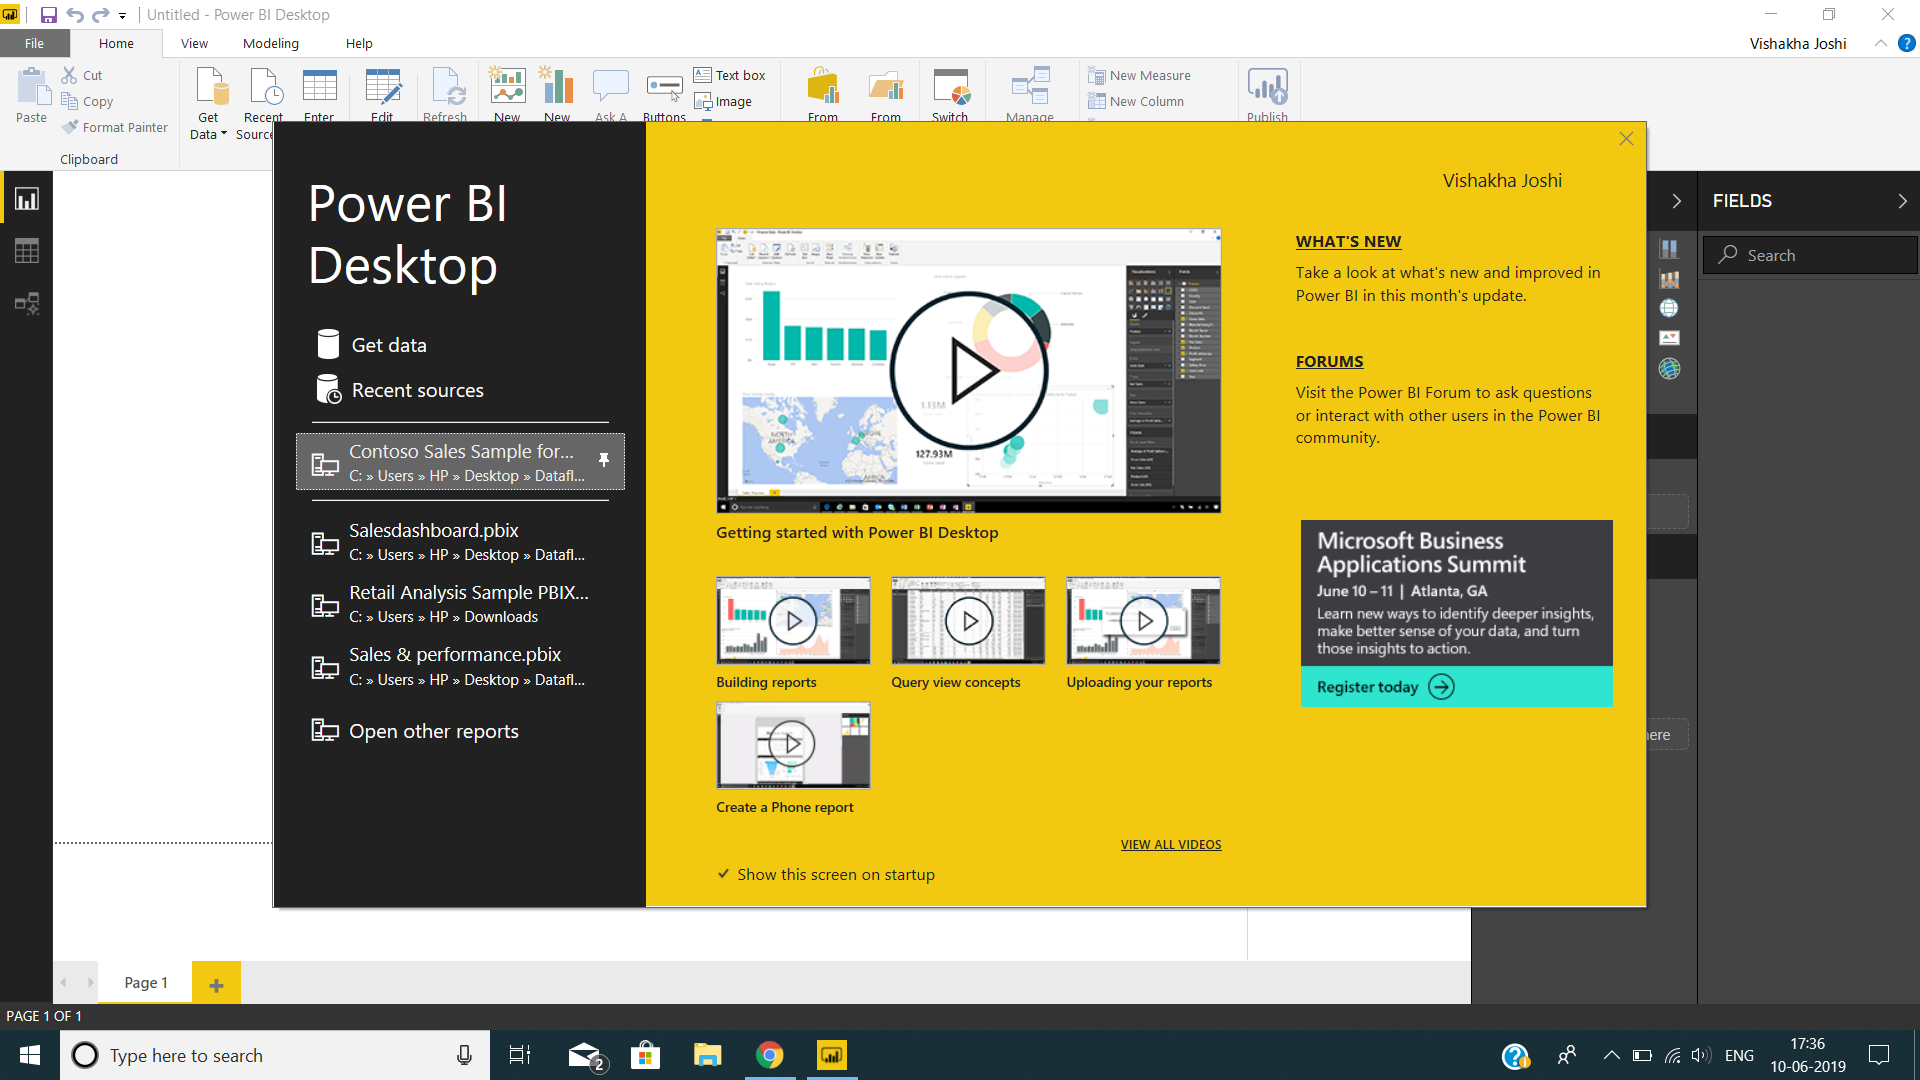
Open Power BI Desktop on your system. Then select the sample dataset whose link we have provided in the prerequisite section.
1. How to Create a Measure
Before we start creating a new measure, let’s assume a scenario here. Suppose, you are the sales manager of Contoso Pvt. Ltd. And, you are asked to submit a report on projected sales for the year 2019. Now, the right way to do this is to base your projection or sales estimates on the previous year’s sales i.e. 2018. Then, we’ll add the expected increase in percentage because of the promotions and offers and then generate the sales amount for 2019. We will make the new sales amount using measures.
Step 1: Once you open the Contoso sales sample file in Power BI Desktop, you will find all the data fields and tables available in it.
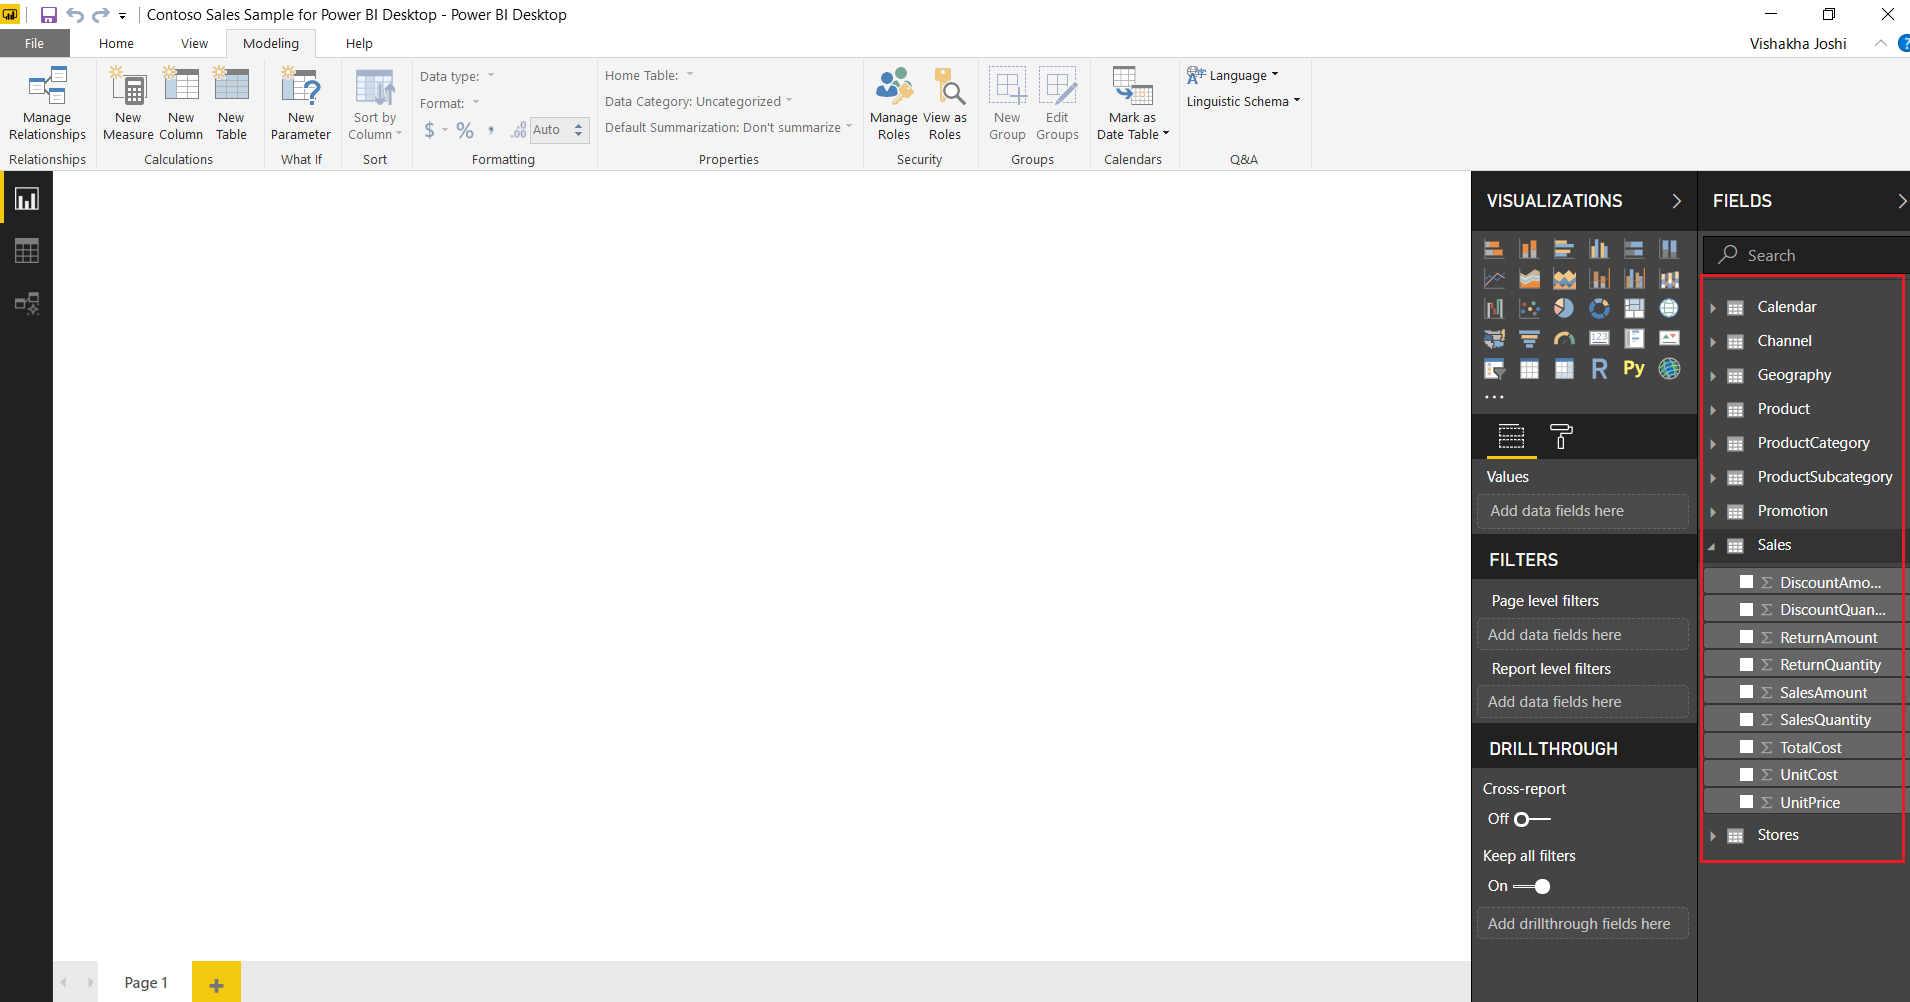
Step 2: The first thing we’ll do is rename the field SalesAmount to TotalSales2018 as it is the sales of the previous year.
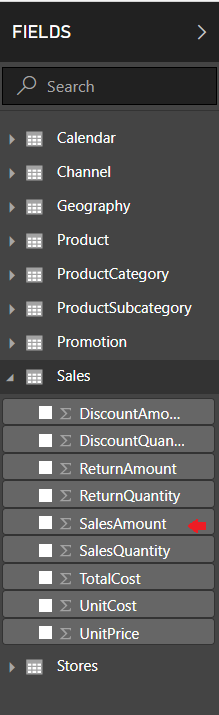
Step 3: To do this, right-click on the field name and select the Rename option and enter the new name.
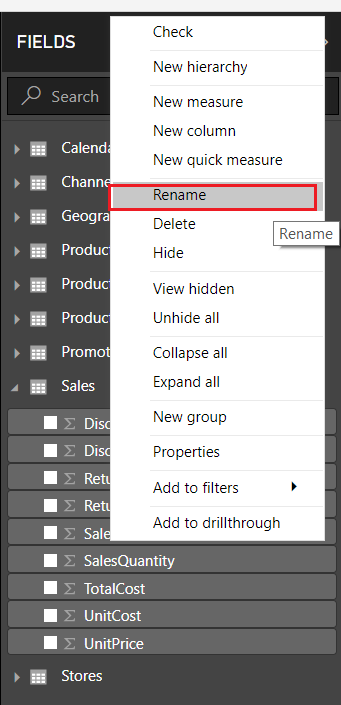
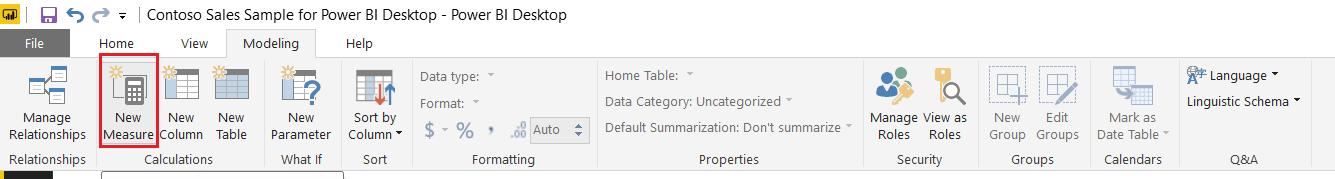
Step 4: Next, we’ll create a new field using New measure option. You can do this in two ways; by right-clicking on the table’s name in which you wish to add the measure field and selecting New measure.
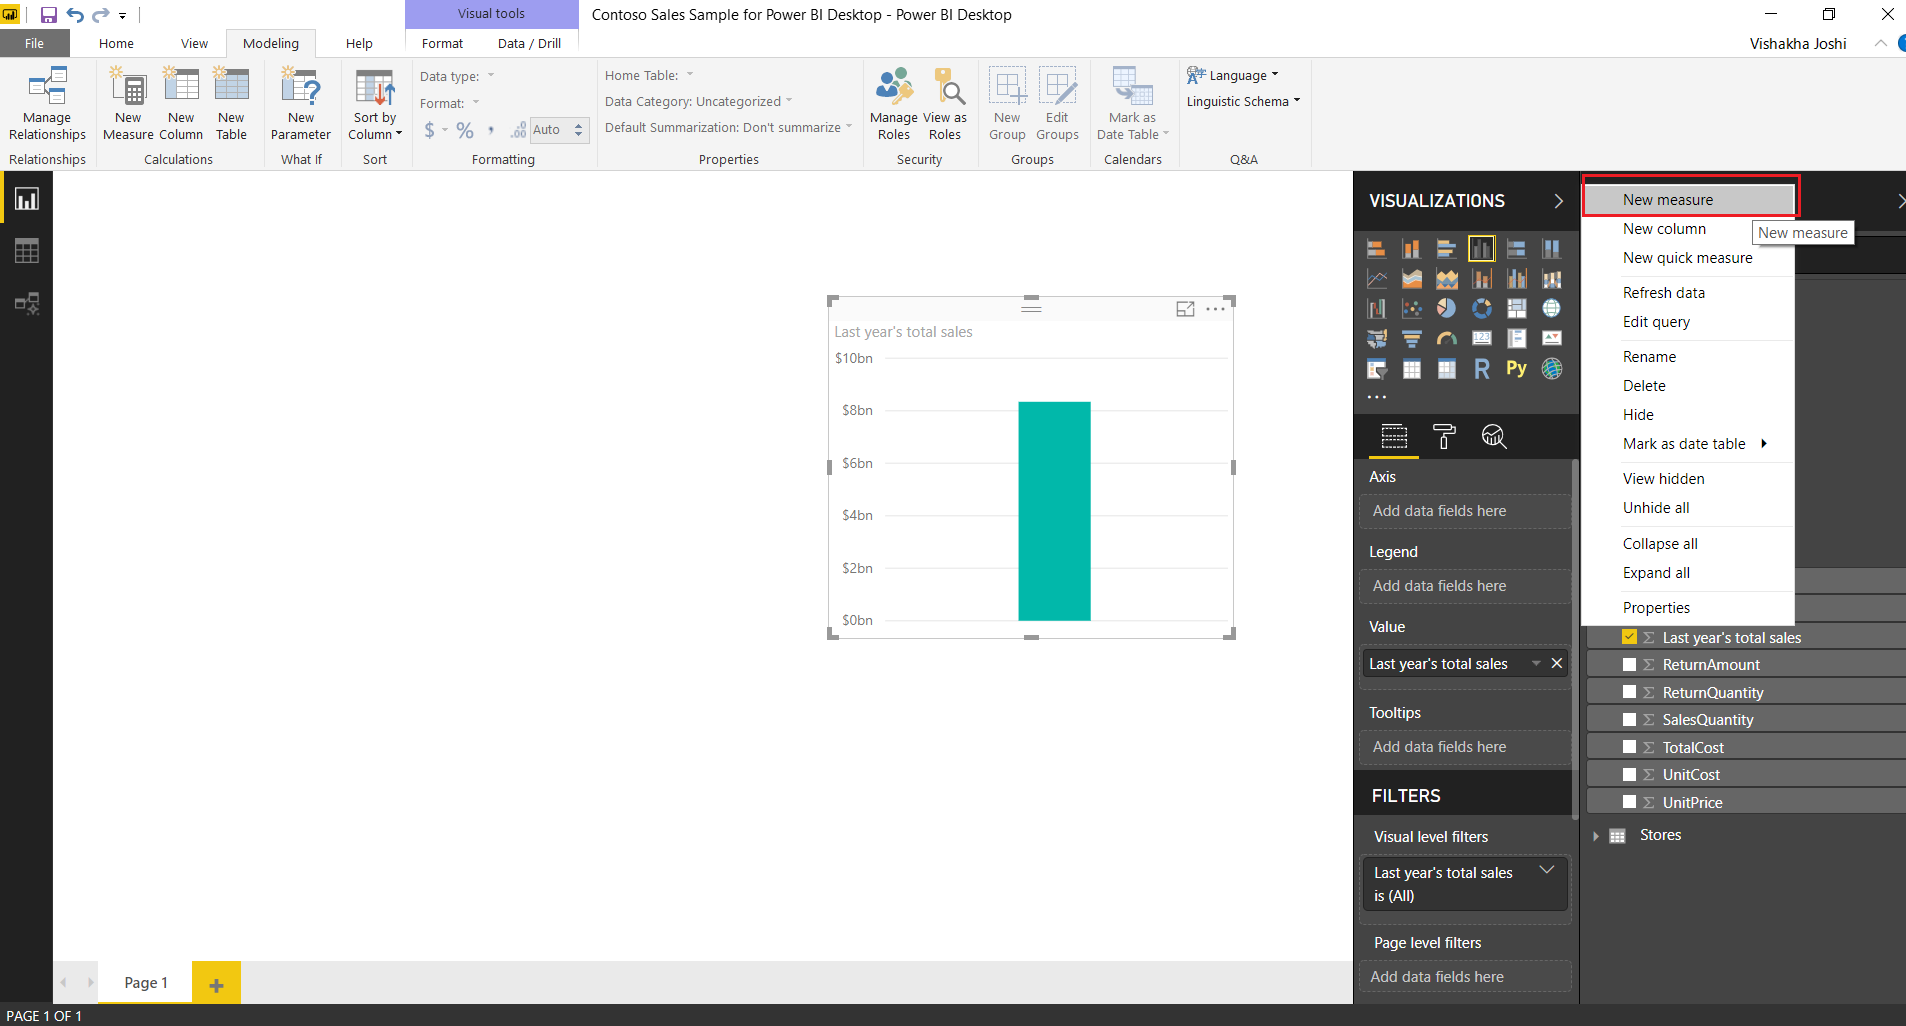
Or, by going to the Modeling tab and clicking on New measure option.
Explore the Types of Filters in Power BI
Step 5: In the formula bar, start with entering the name of your new measure. In the supposed scenario, we are using the name ProjectedSales2019. After this, add other elements and make an expression.
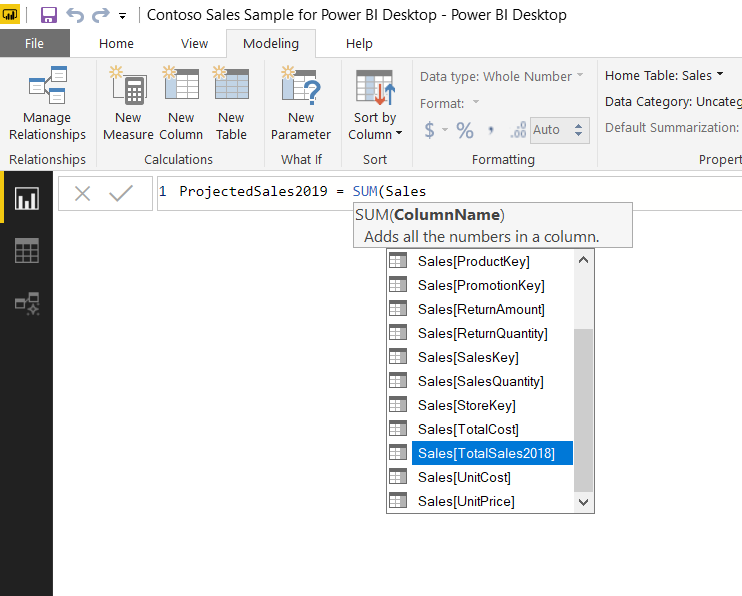
Step 6: Our expression of Projected sales for 2019 is shown in the image below. We have multiplied the sum of previous year’s sales by 1.08 because an increase in sales by 8% is expected in the year 2019.
![]()
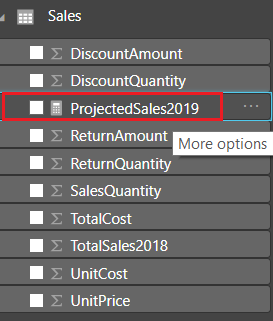
Step 7: Save this and your newly created measure will appear in the Fields column under the table Sales. Every measure field created like this has a calculator icon beside it.
Step 8: You can immediately use new measure in a simple visual comparing the total sales of 2018 and projected sales of 2019.
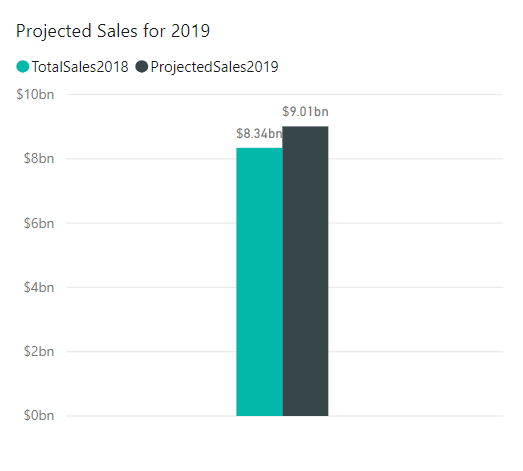
2. Using Measure in a Report
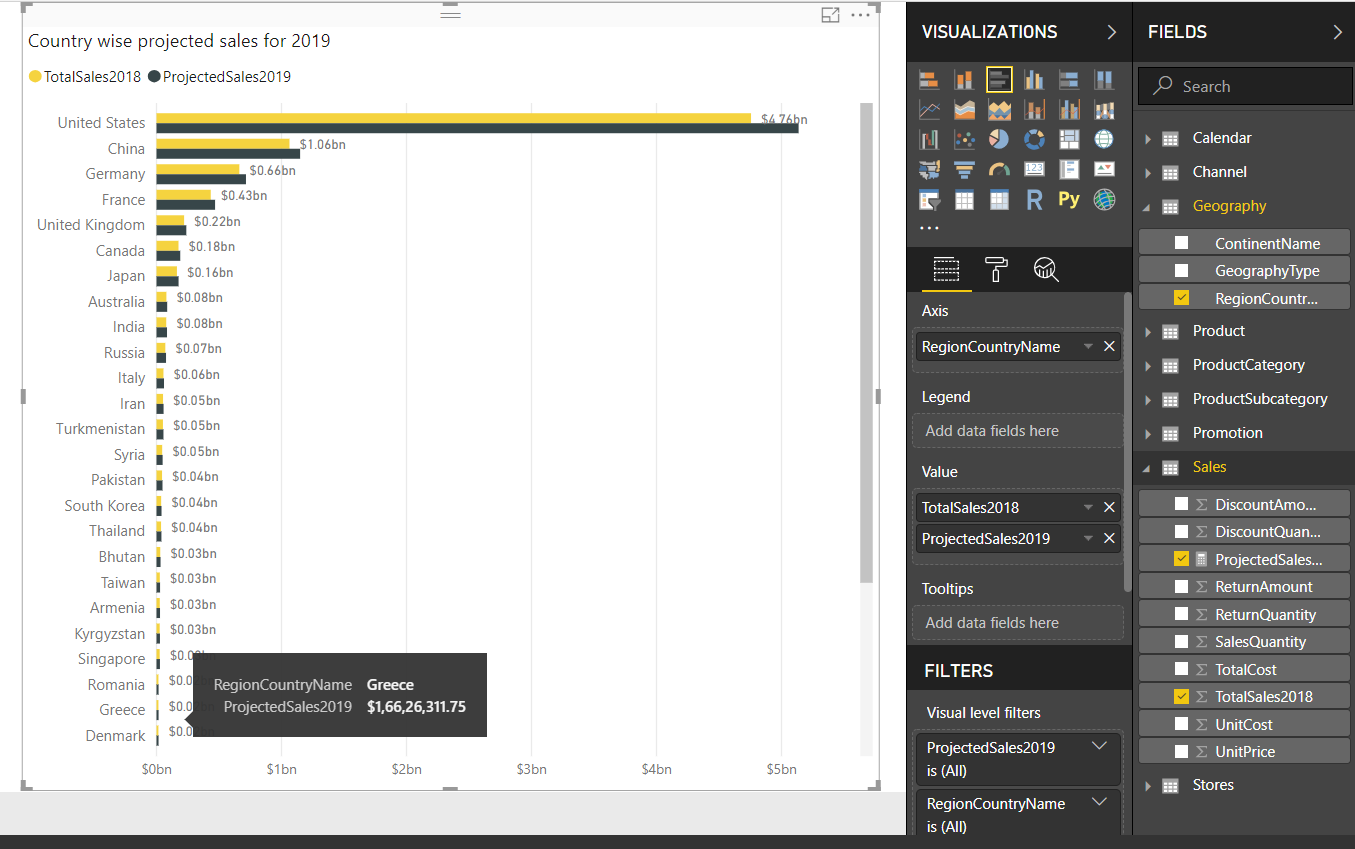
Once that you have created a measure, you can use it in many ways in your Power BI report. In the scenario of Contoso Pvt. Ltd., you can use the new measure field, Project Sales 2019 in all the visuals available in Power BI desktop. For instance, we have used the new measure field to create a bar chart showing total sales for 2018 and
projected sales for 2019 in every country.
Similarly, you can create a complete report page showing details of projected sales in 2019 as shown in the screenshot below. The pie chart also uses the new measure along with product categories to visually represent category wise projected sales for 2019.
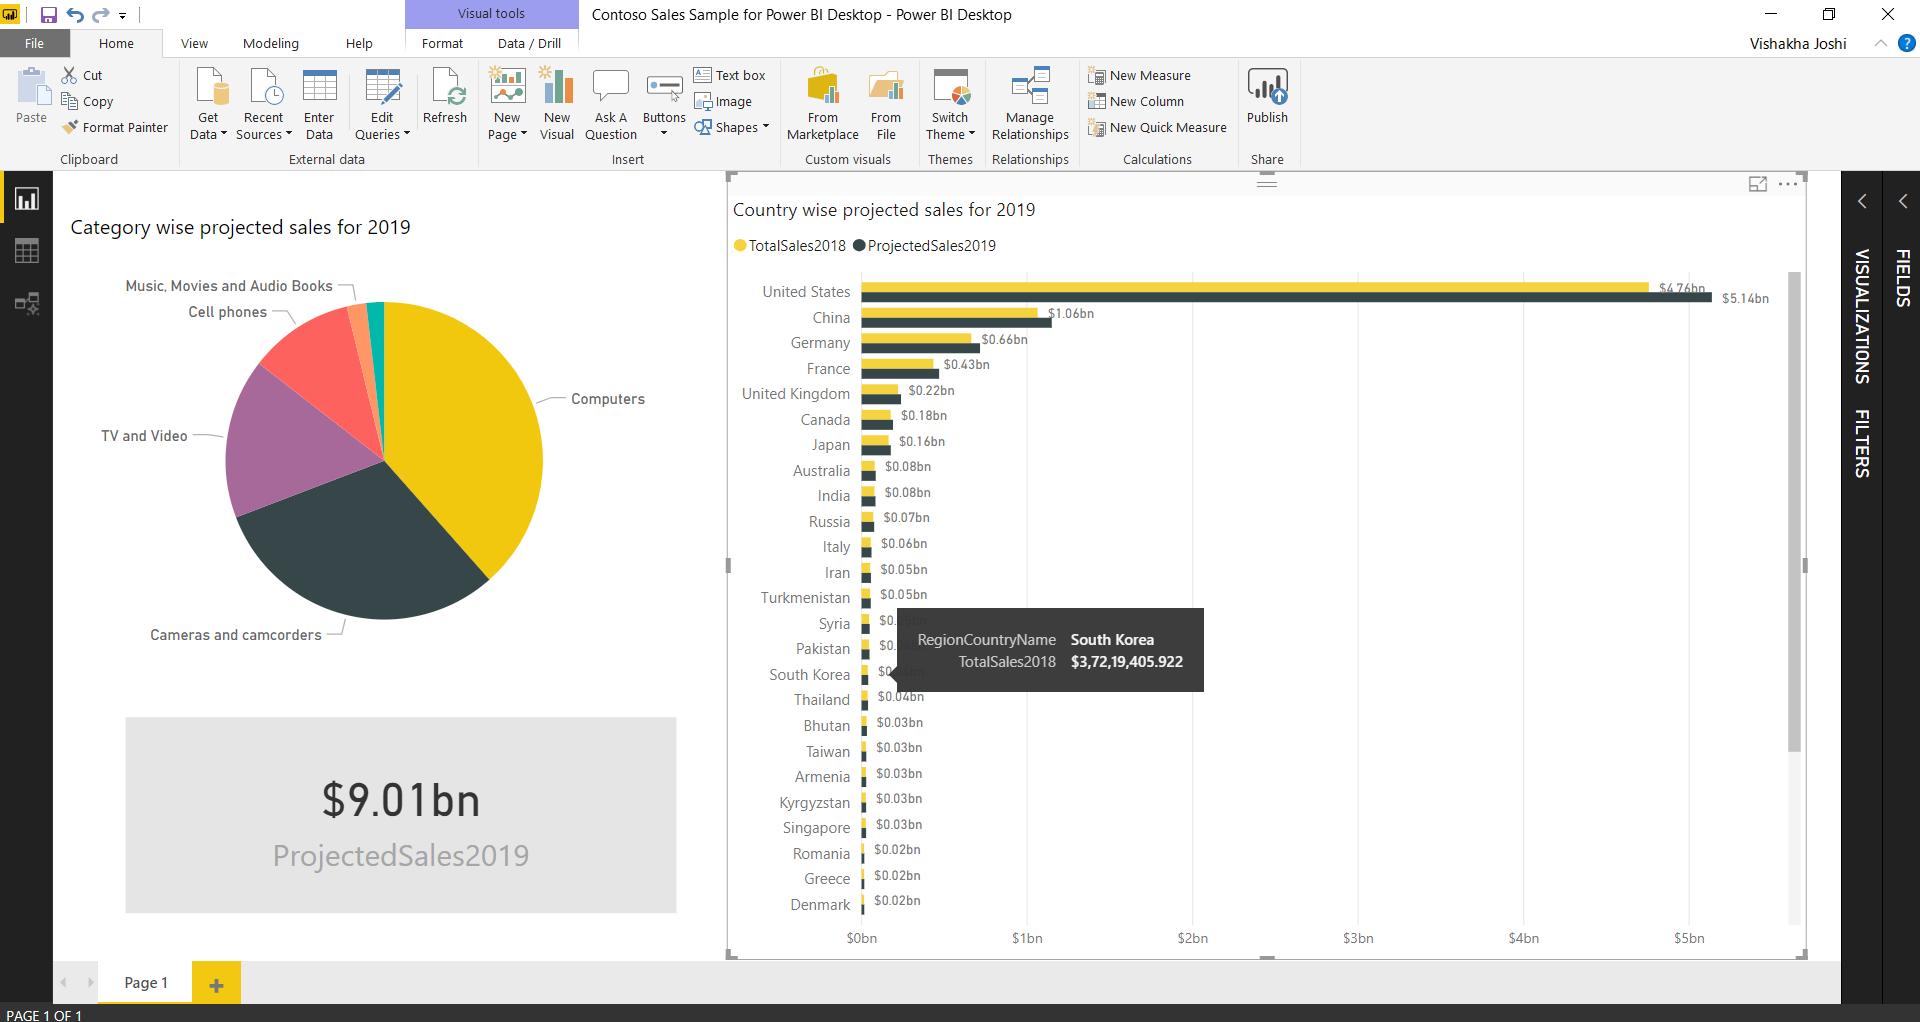
Explore the complete tutorial on Power BI Report Server
3. Using Measure with a Slicer
You can also use a slicer along with visuals using newly created measure fields. The measure fields promptly respond to any selection made in a slicer.
Step 1: To add a slicer, select on the Slicer icon from the Visualizations section.
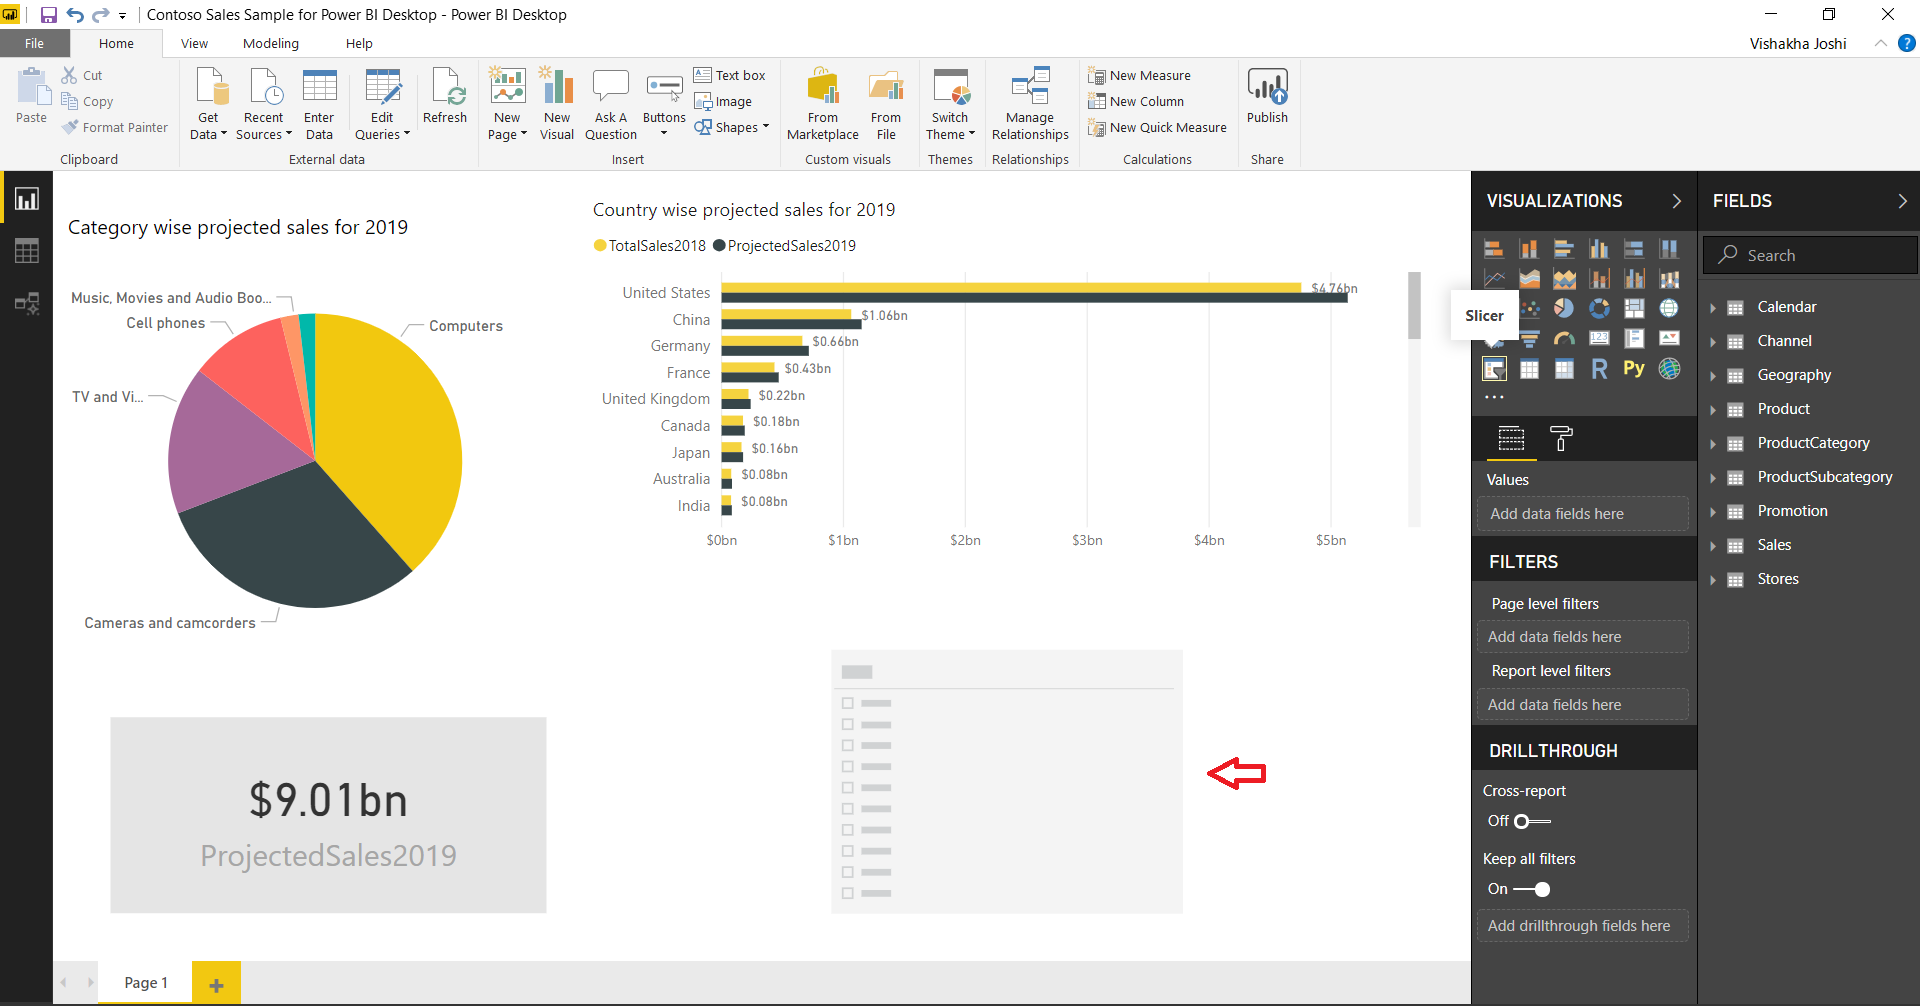
Step 2: Then, add a field to populate the slicer with values.
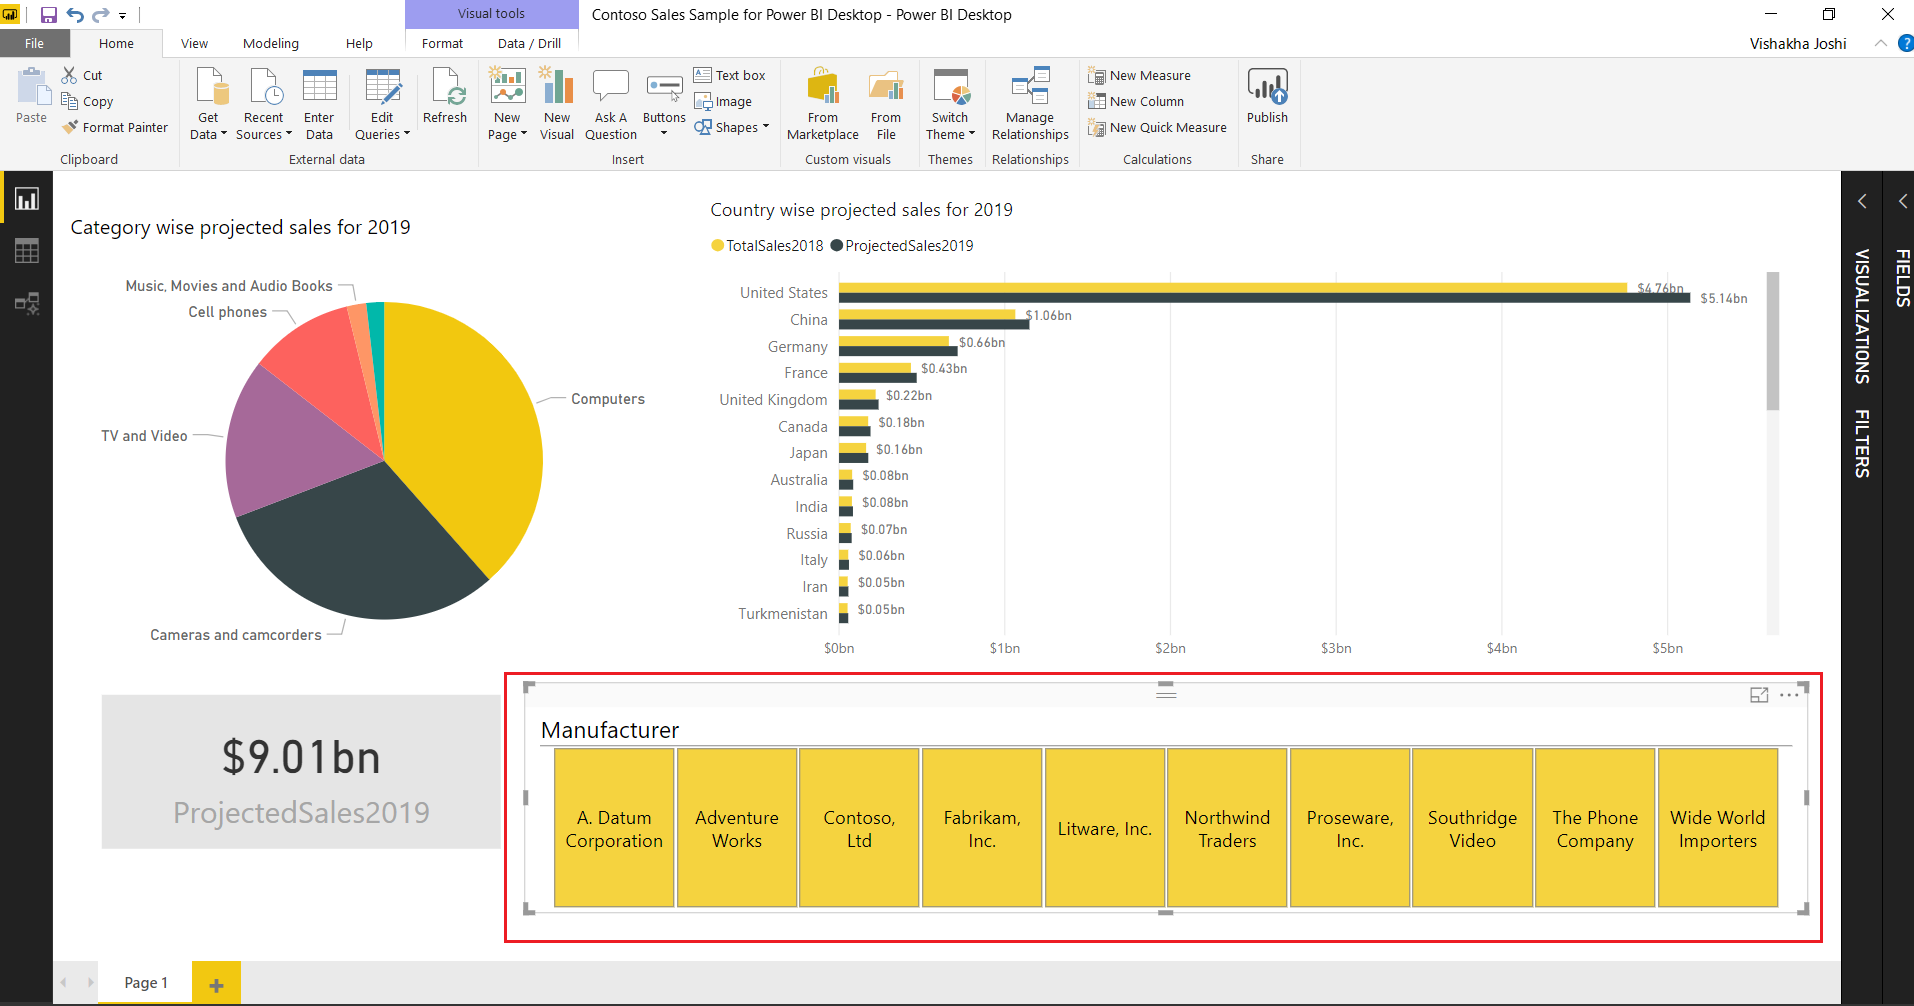
Step 3: A raw form of the slicer will appear on your report canvas. Format it accordingly. The slicer made by us is highlighted in the red box. It contains the names of the manufacturers involved.
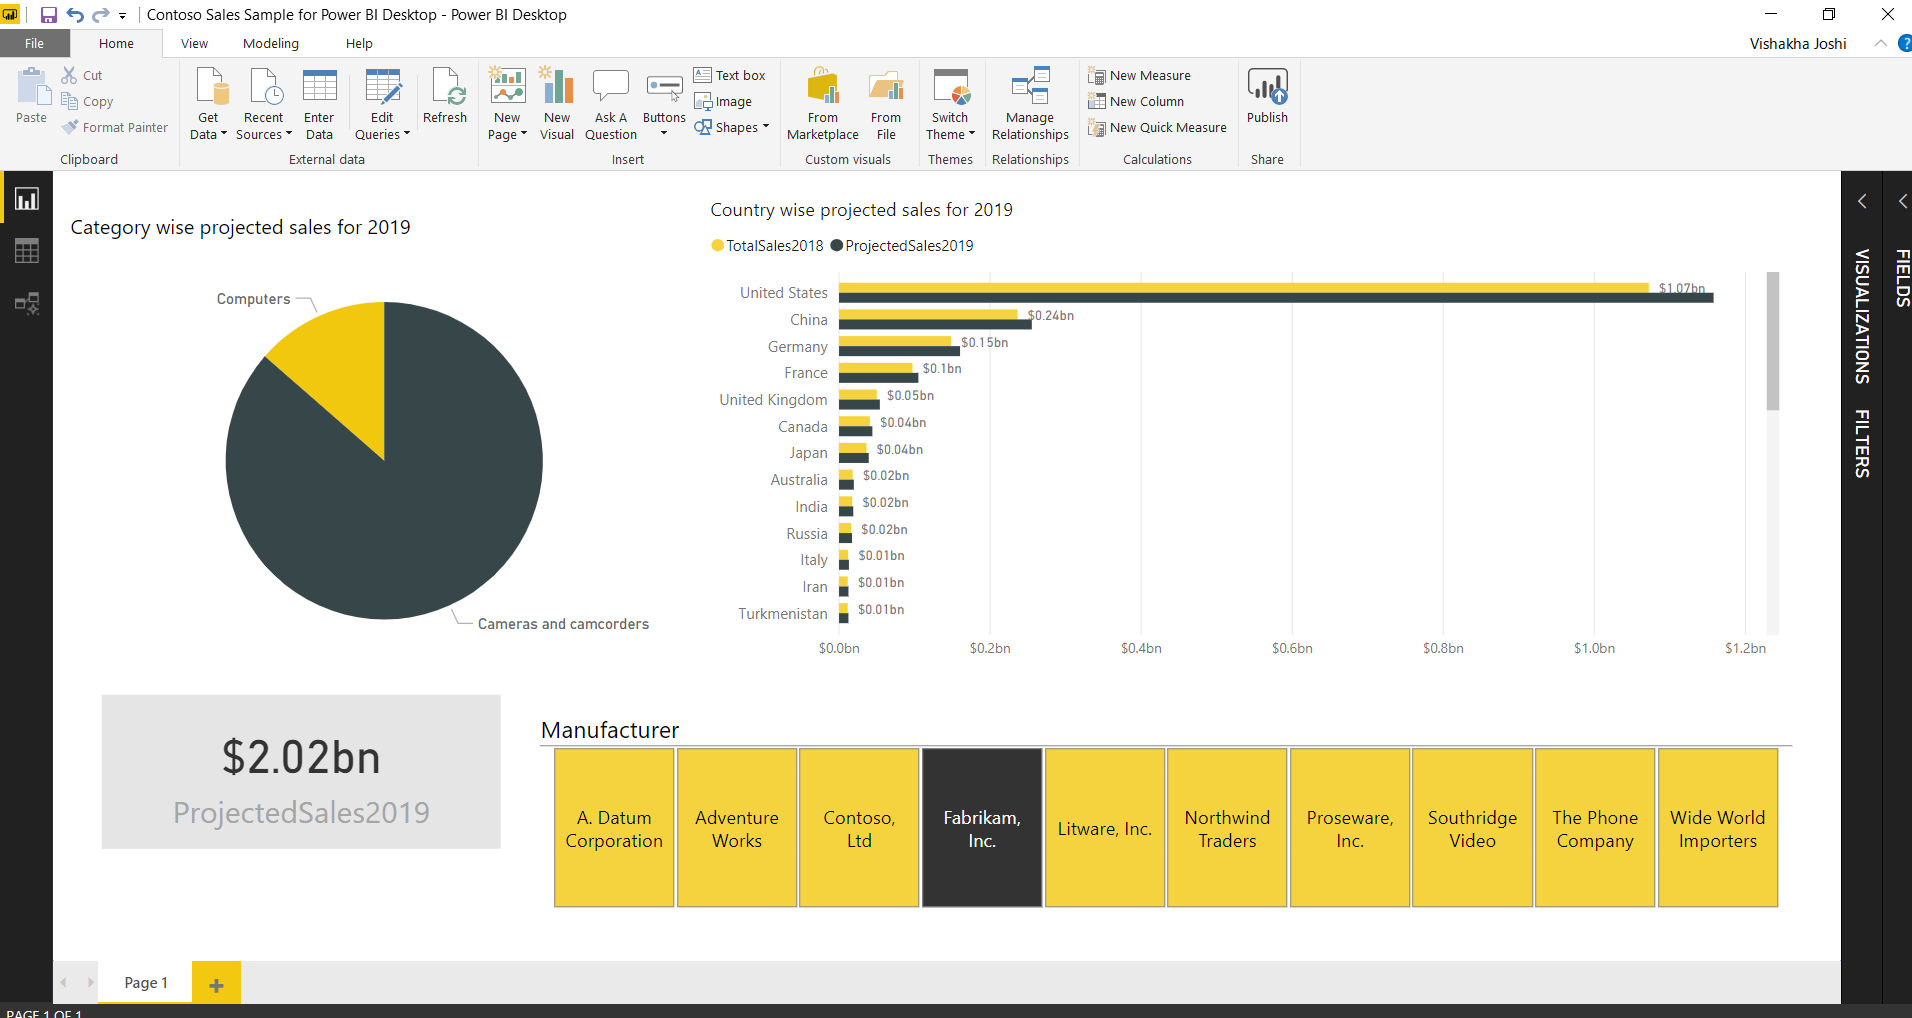
Step 4: Make a selection on the slicer and all the other visuals will change the displayed information accordingly. Look at the screenshot below where we selected the manufacturer Fabrikam Inc. The pie chart, bar chart, and card will show information on projected sales 2019 only for this company.
Do you know – What is Power BI Slicer?
4. Using Measure in a Measure
You can also use an existing measure (created by you) in a new measure that you’ll create. Suppose, we want a measure called Yearly Profit to have the profit value per year.
Step 1: For this, select a table in which you wish to add this new measure and go to New measure option.
Step 2: Then, enter the expression where we defined Yearly Profit as the difference of Projected Sales 2019 and Total Sales 2018. Here, ProjectedSales2019 is the measure we created earlier.
![]()
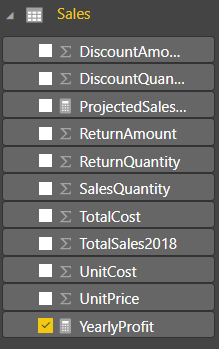
As soon as we create this measure, it will get added to the Sales table.
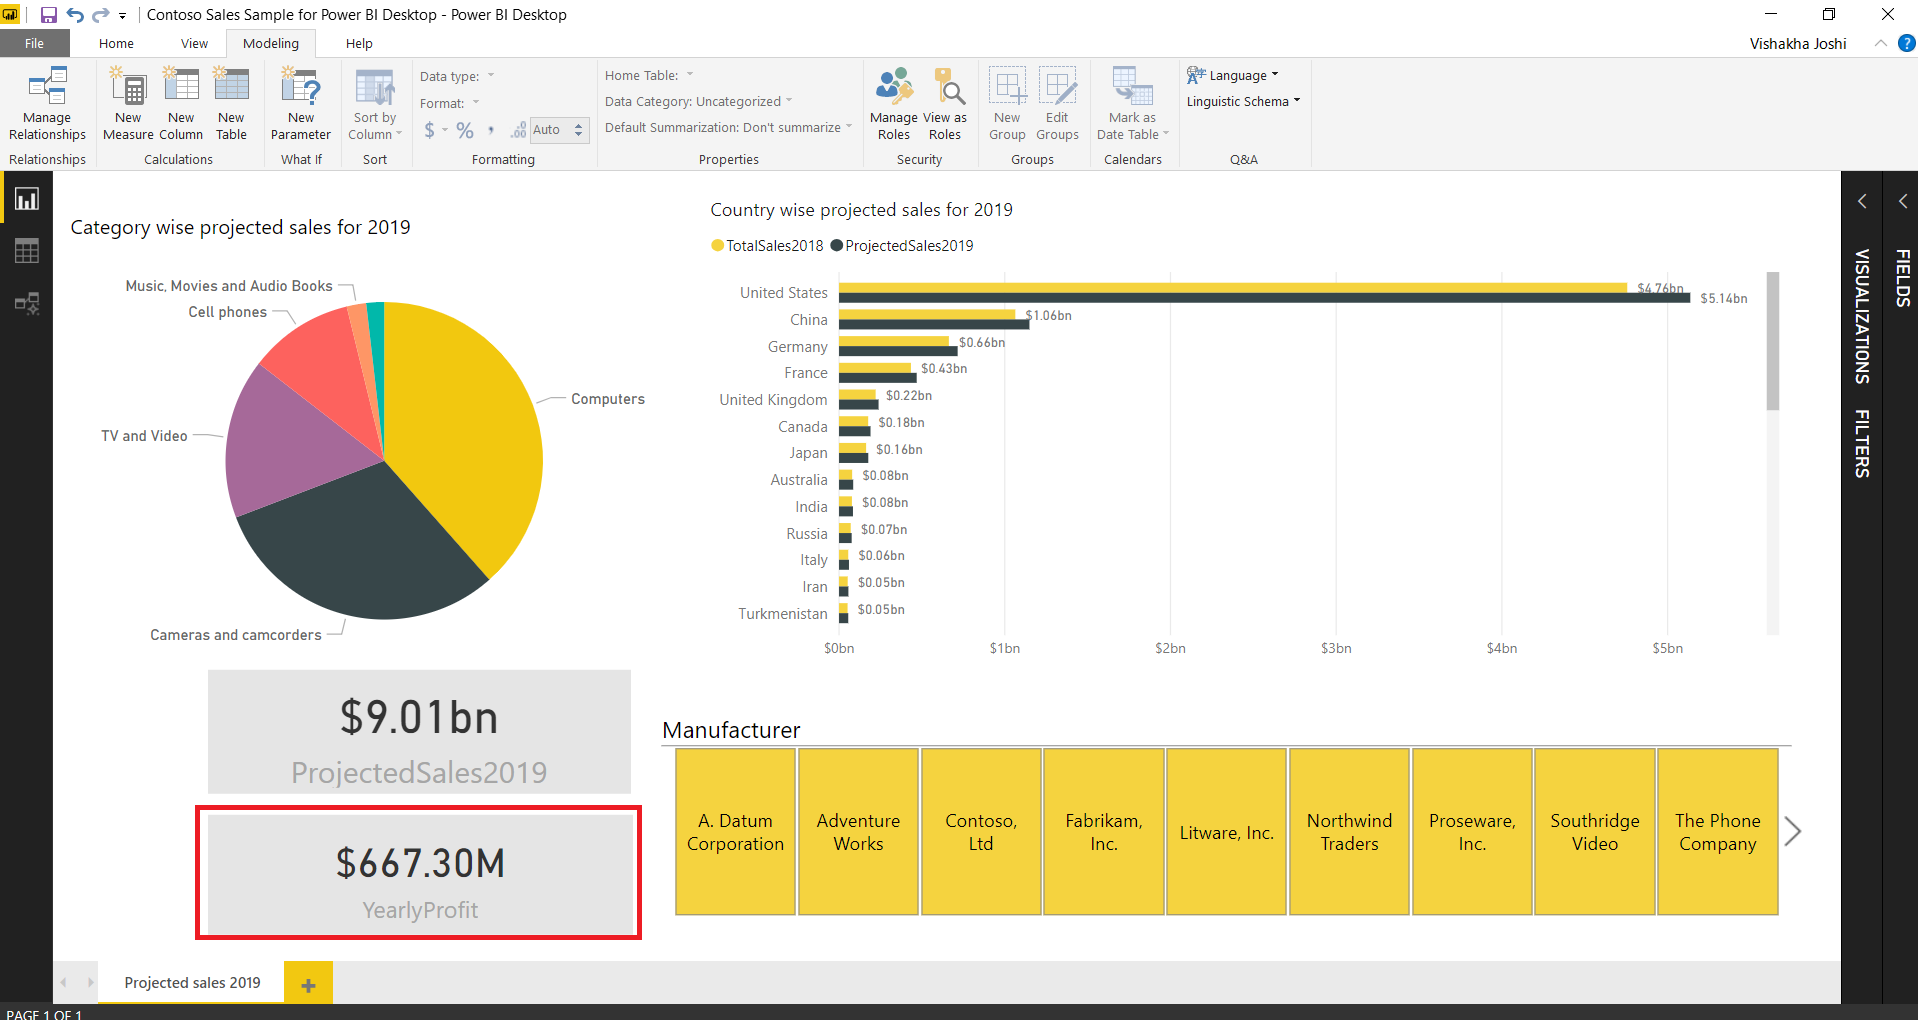
Step 3: Now, we can use this new measure that used a pre-existing measure in its formula in a report. Notice in the screenshot below, we added an information card showing yearly profit value in our report page (highlighted in red box).
Summary
This concludes our tutorial on Measures in Power BI. In this article, we have learned about measures in Power BI and how we create and use them in Power BI desktop reports. You can use this knowledge to create any kind of measure expression for your reports.
Now, you must check out the Power BI DAX tutorial.
Hope the information given by us was useful to you. If you have any confusion regarding measures in Power BI, feel free to ask in the comment section.
You give me 15 seconds I promise you best tutorials
Please share your happy experience on Google


good explanation, thank you
Excellent Source of Knowledge ! 🙂
The Data Set is Containing Only 2011, 2012, 2013 Sales Data Where I Can Get Remaining Years of Data For Analysis
One of the best tutorial I have on this subject. Thank you!
Hello I came across numerous blogs that were quite beneficial for comprehension and education. Additionally, I believed that having this information would help me study more and open doors. You are an inspiration; this is so inventive and imaginative. You obviously take pride in what you do.