Data Analytics Tutorial for Beginners – From Beginner to Pro in 10 Mins!
Interactive Online Courses: Elevate Skills & Succeed Enroll Now!
Data Science and Data Analytics are two most trending terminologies of today’s time. Presently, data is more than oil to the industries. Data is collected into raw form and processed according to the requirement of a company and then this data is utilized for the decision making purpose. This process helps the businesses to grow & expand their operations in the market. But, the main question arises – What is the process called? Data Analytics is the answer here. And, Data Analyst and Data Scientist are the ones who perform this process.
This Data Analytics tutorial by DataFlair is specially designed for beginners, to provide complete information about Data Analytics from scratch.
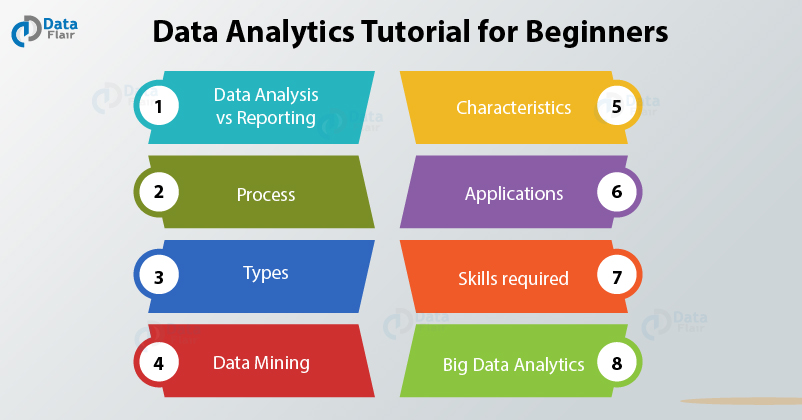
What is Data Analytics?
Data or information is in raw format. The increase in size of the data has lead to a rise in need for carrying out inspection, data cleaning, transformation as well as data modeling to gain insights from the data in order to derive conclusions for better decision making process. This process is known as data analysis.
Data Mining is a popular type of data analysis technique to carry out data modeling as well as knowledge discovery that is geared towards predictive purposes. Business Intelligence operations provide various data analysis capabilities that rely on data aggregation as well as focus on the domain expertise of businesses. In Statistical applications, business analytics can be divided into Exploratory Data Analysis (EDA) and Confirmatory Data Analysis (CDA).
EDA focuses on discovering new features in the data and CDA focuses on confirming or falsifying existing hypotheses. Predictive Analytics does forecasting or classification by focusing on statistical or structural models while in text analytics, statistical, linguistic and structural techniques are applied to extract and classify information from textual sources, a species of unstructured data. All these are varieties of data analysis.
The revolutionising data wave has brought improvements to the overall functionalities in many different ways. There are various emerging requirements for applying advanced analytical techniques to the Big Data spectrum. Now experts can make more accurate and profitable decisions.
In the next section of the Data Analytics tutorial, we are going to see the difference between Data Analysis and Data Reporting.
Time to master Data Mining with this ultimate Data Mining Tutorial Series
Data Analysis vs Data Reporting
The analysis is an interactive process of a person tackling a problem, finding the data required to get an answer, analyzing that data, and interpreting the results in order to provide a recommendation for action.
A business intelligence environment, otherwise known as a reporting environment also includes calling as well as report execution. So, outputs are then printed in the desired form. Reporting refers to the process of organizing and summarizing data in an easily readable format to communicate important information. Reports help organizations in monitoring different areas of performance and improving customer satisfaction. One can also consider the conversion of raw data into useful information as a part of reporting, whereas, the same can be thought for analysis which transforms the information into key usable insights.
Difference between Data Analysis and Data Reporting
- A report will show the user what had happened in the past to avoid inferences and help to get a feel for the data while analysis provides answers to any question or issue. An analysis process takes any steps needed to get the answers to those questions.
- Reporting just provides the data that is asked for while analysis provides the information or the answer that is needed actually.
- We perform the reporting in a standardized way, but we can customize the analysis. There are fixed standard formats for reporting while we perform the analysis as per the requirement; we customize it as needed.
- We can perform reporting using a tool and it generally does not involve any person in the analysis. Whereas, a person is there for doing analysis and leading the complete analysis process.
- Reporting is inflexible while analysis is flexible. Reporting provides no or limited context about what’s happening in the data and hence is inflexible while analysis emphasizes data points that are significant, unique, or special, and it explains why they are important to the business.
Take a deep dive into Features and Applications of Business Intelligence
Data Analysis Process
Now in the Data Analytics tutorial, we are going to see how data is analyzed step by step.
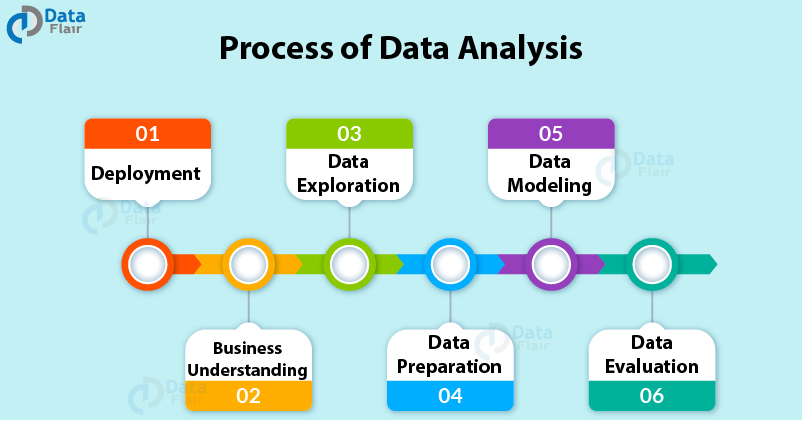
1. Business Understanding
Whenever any requirement occurs, firstly we need to determine the business objective, assess the situation, determine data mining goals and then produce the project plan as per the requirement. Business objectives are defined in this phase.
2. Data Exploration
For the further process, we need to gather initial data, describe and explore data and lastly verify data quality to ensure it contains the data we require. Data collected from the various sources is described in terms of its application and the need for the project in this phase. This is also known as data exploration. This is necessary to verify the quality of data collected.
3. Data Preparation
From the data collected in the last step, we need to select data as per the need, clean it, construct it to get useful information and then integrate it all. Finally, we need to format the data to get the appropriate data. Data is selected, cleaned, and integrated into the format finalized for the analysis in this phase.
4. Data Modeling
After gathering the data, we perform data modeling on it. For this, we need to select a modeling technique, generate test design, build a model and assess the model built. The data model is build to analyze relationships between various selected objects in the data. Test cases are built for assessing the model and model is tested and implemented on the data in this phase.
5. Data Evaluation
Here, we evaluate the results from the last step, review the scope of error, and determine the next steps to perform. We evaluate the results of the test cases and review the scope of errors in this phase.
6. Deployment
We need to plan the deployment, monitoring and maintenance and produce a final report and review the project. In this phase, we deploy the results of the analysis. This is also known as reviewing the project.
The complete process is known as business analytics process.
Types of Data Analysis
There are four types of techniques used for Data Analysis:
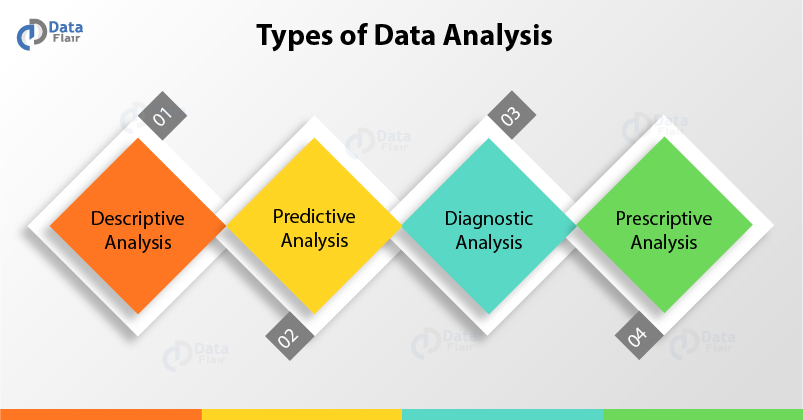
1. Descriptive Analysis
With the help of descriptive analysis, we analyze and describe the features of a data. It deals with the summarization of information. Descriptive analysis, when coupled with visual analysis provides us with a comprehensive structure of data.
In the descriptive analysis, we deal with the past data to draw conclusions and present our data in the form of dashboards. In businesses, descriptive analysis is used for determining the Key Performance Indicator or KPI to evaluate the performance of the business.
2. Predictive Analysis
With the help of predictive analysis, we determine the future outcome. Based on the analysis of the historical data, we are able to forecast the future. It makes use of descriptive analysis to generate predictions about the future. With the help of technological advancements and machine learning, we are able to obtain predictive insights about the future.
Predictive analytics is a complex field that requires a large amount of data, skilled implementation of predictive models and its tuning to obtain accurate predictions. This requires a skilled workforce that is well versed in machine learning to develop effective models.
3. Diagnostic Analysis
At times, businesses are required to think critically about the nature of data and understand the descriptive analysis in depth. In order to find issues in the data, we need to find anomalous patterns that might contribute towards the poor performance of our model.
With diagnostic analysis, you are able to diagnose various problems that are exhibited through your data. Businesses use this technique to reduce their losses and optimize their performances. Some of the examples where businesses use diagnostic analysis are:
- Businesses implement diagnostic analysis to reduce latency in logistics and optimize their production process.
- With the help of diagnostic analysis in the sales domain, one can update the marketing strategies which would otherwise attenuate the total revenue.
4. Prescriptive Analysis
Prescriptive analysis combines insights from all of the above analytical techniques. It is referred to as the final frontier of data analytics. Prescriptive analytics allows companies to make decisions based on them. It makes heavy usage of Artificial Intelligence in order to facilitate companies into making careful business decisions.
Major industrial players like Facebook, Netflix, Amazon, and Google are using prescriptive analytics to make key business decisions. Furthermore, financial institutions are gradually leveraging the power of this technique to increase their revenue.
Don’t forget to check out – How Netflix is using Data Science
Introduction to Data Mining
Data mining also called data or knowledge discovery means analyzing data from different perspectives and summarizing it into useful information – information that we can use to make important decisions. It is the technique of exploring, analyzing, and detecting patterns in large amounts of data. The goal of data mining is either data classification or data prediction. In classification, we sort the data into groups while in prediction, we predict the value of a continuous variable.
In today’s world, data mining is used in several sectors like Retail, Sales Analytics, Financial, Communication, Marketing Organizations, etc. For example – a marketer may want to find who responded and who did not to a promotion. In prediction, the idea is to predict the value of a continuous (ie non-discrete) variable; for example, a marketer may be interested in finding who will respond to a promotion.
Some examples of data mining are:
1. Classification of Trees
The various tree-shaped structures denote the set of executable decisions.
2. Logistic Regression
It predicts the probability of an outcome that can only have two values.
3. Neural Networks
These are non-linear predictive models that resemble biological neural networks in structure and are learned through training.
4. Clustering Techniques like the K-nearest Neighbours
This is the technique that classifies each record in a dataset based on a combination of classes of the k record(s) that are most similar to it in a historical dataset (where k 1). Sometimes we call it the k-nearest neighbour technique.
5. Anomaly Detection
The identification of items, events and other observations that do not observe a standard pattern in the dataset.
Characteristics of Data Analysis
The characteristics of the data analysis depend on different aspects such as volume, velocity, and variety.

In this Data Analytics Tutorial, let us now explore the characteristics of data analysis which make it different from traditional kind of analysis.
1. Programmatic
There might be a need to write a program for data analysis by using code to manipulate it or do any kind of exploration because of the scale of the data.
2. Data-driven
A lot of data scientists depend on a hypothesis-driven approach to data analysis. For appropriate data analysis, one can also avail the data to foster analysis. This can be of significant advantage when there is a large amount of data. For example – machine learning approaches can be used in place of hypothetical analysis.
Get to know about the Top Data Science Skills for becoming a Data Scientist
3. Attributes usage
For proper and accurate analysis of data, it can use a lot of attributes. In the past, analysts dealt with hundreds of attributes or characteristics of the data source. With Big Data, there are now thousands of attributes and millions of observations.
4. Iterative
As whole data is broken into samples and samples are then analyzed, therefore data analytics can be iterative in nature. Better compute power enables iteration of the models until data analysts are satisfied. This has led to the development of new applications designed for addressing analysis requirements and time frames.
Applications of Data Analysis
Following are some of the popular applications of data analysis:
1. Fraud Detection & Risk Analytics
In banking, data analytics is heavily utilized for analyzing anomalous transaction and customer details. Banks also use data analytics to analyze loan defaulters and credit scores for their customers in order to minimize losses and prevent frauds.
2. Optimizing Transport Routes
Companies like Uber and Ola are heavily dependent on data analytics to optimize routes and fare for their customers. They use an analytical platform that analyzes the best route and calculates percentage rise and drop in taxi fares based on several parameters.
3. Providing Better Healthcare
With the help of data analytics, hospitals and healthcare centres are able to predict early onset of chronic diseases. They are able to predict diseases that might occur in the future and help the patients to take early action that would help them to reduce medical expenditure.
4. Managing Energy Expenditure
Public-sector energy companies are using data analytics to monitor the usage of energy by households and industries. Based on the usage patterns, they are optimizing energy supply in order to reduce costs and cut down on energy consumption.
5. Improving Search Results
Companies like Google are using data analytics to provide search results to users based on their preferences and search history. Furthermore, companies like Airbnb use search analytics to provide the best accommodation to its customers. Companies like Amazon are making use of the search analytics to provide personalised recommendations to its users.
6. Optimization of Logistics
Various companies are relying on Big Data Analytics to analyse supply chains and reduce latency in logistics. Amazon is making use of consumer analytics to analyze the customer requirements and direct them the products without creating any form of delay.
How to Get a Better Analysis?
In order to have a great analysis, it is necessary to ask the right question, gather the right data to address it, and design the right analysis to answer the question. Only after careful analysis, we can define it as correct. So, let’s discuss this in detail.
The framing of a problem means ensuring that you are asking important questions and laying out critical assumptions. For example – Is the goal of a new initiative focussed to drive more revenue or more profit? The choice leads to a huge difference in the analysis and actions that follow. Is all the data is required available, or is it necessary to collect some more data? Without framing the problem, the rest of the work is useless.
For performing proper analysis, we can format the problem precisely. So, this includes assessing the data correctly, developing a solid analysis plan, and taking into account the various technical and practical considerations.
We can analyze any business problem for two issues:
1. Statistical Significance
It states how is the problem statistically important for decision making. Statistical significance testing takes some assumptions and determines the probability of happening of results if the assumptions are correct.
2. Business Importance
It means how the problem is related to business and its importance. We will assign the results in the business context as part of the final process of validation.
Skills required to become a Data Analyst
Data Analytics Tutorial is incomplete without knowing the necessary skills required for the job of a data analyst. In today’s world, there is an increasing demand for analytical professionals.
All the data collected and the models created are of no use if the organization lacks skilled data analysts. A data analyst requires both skills and knowledge for getting good data analytics jobs.
To be a successful analyst, a professional requires expertise on the various data analytical tools like R & SAS. He should be able to use these business analytics tools properly and gather the required details. He should also be able to take decisions which are both statistically significant and important to the business.
Wait! Have you checked the complete series of tutorials on SAS
Even if you know how to use a data analysis tool of any type, you also need to have the right skills, experience and perspective to use it. An analytics tool may save a user from some programming part but he/ she still needs to understand the analytics that occurs. Then only we can call a person as a successful data analyst.
Business people with no analytical expertise may want to leverage analytics, but they do not need to do the actual heavy lifting. The job of the analytics team is to enable business people to drive analytics through the organization. Let business people spend their time selling the power of analytics upstream and changing the business processes they manage to make use of analytics. If analytics teams and business teams do what they do best, it will be a winning combination.
Technical & Business Skills for Data Analytics
In this part of data analytics tutorial, we will discuss the required technical and business skills.
Technical skills for data analytics:
- Packages and Statistical methods
- BI Platform and Data Warehousing
- Base design of data
- Data Visualization and munging
- Reporting methods
- Knowledge of Hadoop and MapReduce
- Data Mining
Business Skills Data analytics:
- Effective communication skills
- Creative thinking
- Industry knowledge
- Analytic problem solving
Grab the FREE Tutorial Series of 520+ Hadoop Tutorials now!!
Introduction of Big Data Analytics
Big Data Analytics has transformed the way industries perceived data. Traditionally, companies made use of statistical tools and surveying to gather data and perform analysis on the limited amount of information. Most of the times, the deductions and inferences that were produced based on the information were not adequate and did not lead to positive results. Because of this, companies had to incur losses.
However, with the advancements in technology and a massive increase in the computational capabilities contributed by High-Performance Computing, industries are able to expand their domain of knowledge. What comprised of a few gigabytes in the past is now in the size of quintillions. This is contributed by the massive expanse in mobile phones, IoT devices and other internet services. To make sense of this, industries have resorted to Big Data Analytics.
A Big Data Analytics platform is a comprehensive platform that provides both the analytical capabilities as well as massive storage capacity. Some popular Big Data tools like Hadoop, Spark, Flink and Kafka have the capability to not only store massive bulk of data but also perform analysis on the data. As a result, they provide comprehensive solutions to companies with their big data needs.
Summary
We discussed all the aspects of Data Analytics in this tutorial. Moreover, we looked at the difference between data analysis and data reporting with Data Analysis process, its types, characteristics and applications. Also, we understood the skills required to become a data analyst and Big Data analytics in detail. Now, its time to master R Programming with R Tutorial for Beginners
Still, if you have any question related to Data Analytics Tutorial, ask in the comment section.
Did you know we work 24x7 to provide you best tutorials
Please encourage us - write a review on Google


I am new to big data. your tutorials help understand the basics in simple way. Thank you !!!
Hi Aman
After reading your comment DataFlair decides to help more. So, we are providing you with a good collection of Big Data blogs that contains a complete Big Data series in easy to understand language. You must read them and share your feedback again. Here is the link by which you can get the complete Big Data tutorial package –
https://data-flair.training/blogs/big-data-tutorials-home/
It’s really a good place to get the complete knowledge who wants to see yourself in the world of Data as a data analyst or Data Scientist. Every steps of each section has been described in very easy language and has also used pictorial format that makes more easy to the candidate to build the concepts of topics. In crux I can only say that it is a good platform for analytical knowledge under one roof.
Thanks!! I’am reading from Colombia.
Just Awesome, All Data Fair articles are superb. Thank you so much.
Graphical representations are more attractive . Superrrrrrrr!!!!!!!
Thanks to Data Flair,
This tutorial is of great help to all those who are interested in learning R programming.
Just want to drop by and say thank you for the good job. I hope this site will continue forever. I’m preparing myself for postgraduate studies in data analytics
Thanks for your generous response. We are constantly giving efforts to provide the best content to our readers. Share this data analytics tutorial with your friends & colleagues on social media.
very informative with the approach, thank you for the explanation looking forward to more articles
Very useful !
Hi, i came across your website when i was reading about data and honestly i am so glad i did. I am planning to do masters in this area and are currently in dilemma. Sicne i am mathematics graduate with work experience in Identity and Access Management domain. I perform analysis using excel and evaluate data but not by using any tool or by any other technical aspect, however data does interest me a lot. My problem is whether doing after data analytics will be too technical for me to understand given i have no prior knowledge on any tool or technical language like java or sql. i really need some information please.
Hi Divya Kumari, I am with the exact replica of your Profession. A Math Graduate worked as Sr Exec in Accounts, working only and only on excel with no technical expertise for past 15 years, with no progress in my life. Neither promotion nor a decent Salary Growth. Since 2 years Big Data is dragging my mind like anything. Because of the various Analytical workings which I did in excel for years, it helped me to understand the entire concepts in Big Data almost easily. As an answer to your question, (I am not deep into your domain) but I bet the kind of expertise you used for years to do analysis in Excel would be 100% enough, but with little effort. And Java will not have much role to play in R Programming. Because once you are through with R, probably you are more than half way to Java. And Once you master in Big Data, sql will remain nothing. I am sure with this information as i am more than half way in mastering data science.
Reading and learning from Philippines. Great materials to start for data analytics. What a great help. Thank you so much!!
Amazing blog, love to read it.
hey guys @data flair team, U guys are fantastic yrr. U have given a lot of details about data science and data analytics. I am new to this data and got lot of info from u so THANK U GUYS
Dear Admin, The blog is simply superbbbbbb…….. Your Descriptive Analysis (the way you described) is the best of All those who tried to explain. Kudos to you and your blogs.
Dear Admin, The blog is simply superbbbbbb…….. Your Descriptive Analysis (the way you described) is the best of All those who tried to explain. Kudos to you and your blogs. Your Hardwork behind this is marvellous.
This blog is so useful, a big thanks to the team.!!!
Really , Very Informative Site . The organization of Contents ( I scrolled for R) in Very nice
I am very thankful for such understandable information, like me how is entering in to the would of data science to pursue data analytics .
Thank you
The International Conference on Data Analytics will take place in Dubai, UAE, from April 13 to 15, 2023, and the organising committee of Data Analytics 2023 is glad to announce it.
The International Conference on Data Analytics seeks to bring together top academic scientists, researchers, and research scholars to interact and share their experiences and research findings on all facets of Data Analytics. Additionally, it offers a significant knowledge domain platform for academics, practitioners, and educators to present and debate the most recent breakthroughs, trends, difficulties, practical challenges faced, and solutions taken in the domains of Data Analytics.
Your articles are very helpful, but you should use more gender neutral language in your articles. “He’s” are not the only gender capable of learning or working in the Data Analytics world. Thank you!
Great article. Your content helps me a lot for clearing my concepts.
great. thank you.