Matrix Function in R – Master the apply() and sapply() functions in R
Job-ready Online Courses: Knowledge Awaits – Click to Access!
In this tutorial, we are going to cover the functions that are applied to the matrices in R i.e. apply() and sapply() function. Also, we will see how to use these functions of the R matrix with the help of examples.
I hope you have completed the R Matrix tutorial, before proceeding ahead!
So, let’s start exploring matrix functions in R.
What is R Matrix and Matrix Function in R?
First of all, let’s revise what are matrices. A matrix is a two-dimensional rectangular data set. Thus it can be created using vector input into the matrix function. Also, a matrix is a collection of numbers arranged into a fixed number of rows and columns. The numbers present in the matrix are real numbers. We then carry out the memory replication of the matrix using the matrix function. Hence, the data elements must be of the same basic type. Matrices functions are those functions which we use in matrices.
There are two types of matrix function in R:
- apply()
- sapply()
In the above paragraph, we have discussed about the R matrix. Now let’s proceed to detail understanding of the types of matrix function in R.
You must learn about Vector Operations in R
What is apply() function in R?
Let’s now understand the R apply() function and its usage with examples.
1. apply() function in R
It applies functions over array margins. It returns a vector or array or list of values obtained by applying a function to margins of an array or matrix.
- Keywords – array, iteration
- Usage – apply(X, MARGIN, FUN, …)
Arguments – The arguments for the apply function in R are explained below:
- X – an array, including a matrix.
- … – optional arguments to FUN.
- FUN – The function to apply: see ‘Details’.
- MARGIN – Functions will apply on subscripts in a vector.
For example – A matrix 1 indicates rows, matrix 2 indicates columns, matrix c(1, 2) indicates rows and columns. In this, X is named dimnames and it can be a character vector selecting dimension names.
2. The apply() family
Apply functions are a family of functions in base R, which allow us to perform actions on many chunks of data. An apply function is a loop, but it runs faster than loops and often with less code. And, there are different apply() functions.
The called function could be:
- Some aggregating function which includes meaning, or the sum (including return a number or scalar).
- Other transforming or subsetting functions.
- Some vectorized functions which return more complex structures like lists, vectors, matrices, and arrays.
We can perform operations with very few lines of code in apply().
Have you checked – R Array Function
3. How to use apply() function in R?
So, let us start with apply(), which operates on arrays:
3.1 apply function in R examples
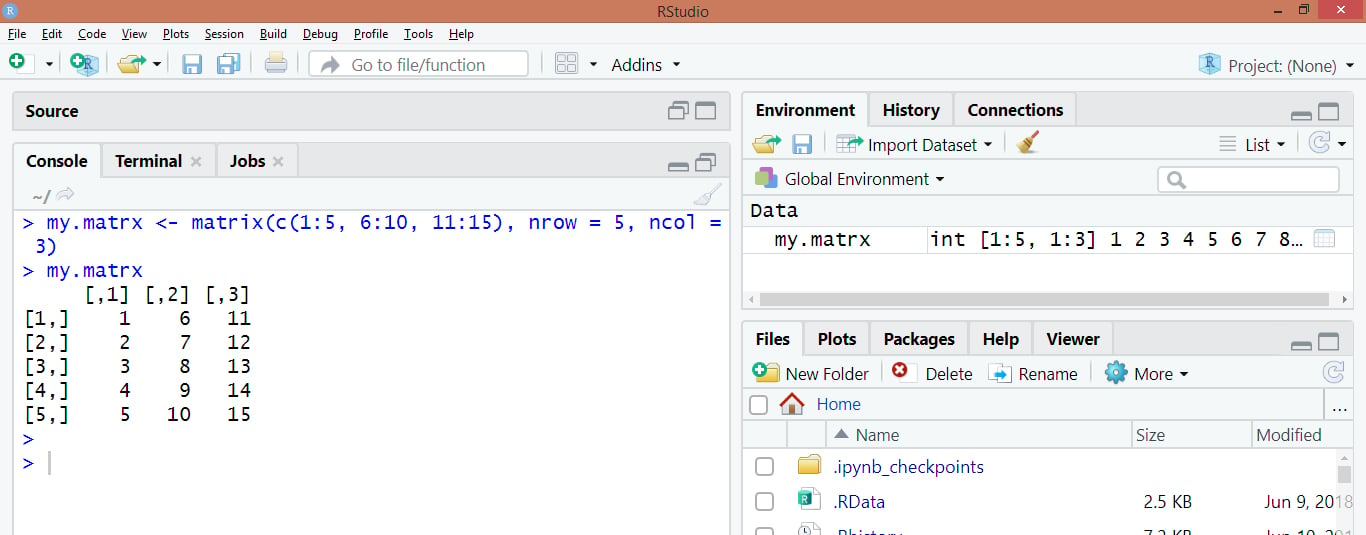
my.matrx is a matrix with 1-5 in column 1, 6-10 in column 2, and 11-15 in column 3. my.matrx is used to show some of the basic uses of the apply function.
my.matrx <- matrix(c(1:5, 6:10, 11:15), nrow = 5, ncol = 3)
my.matrx
Output:
Example 1: Using apply to find row sums
We will summarize the data in matrix m by finding the sum of each row. The arguments are; X = m, MARGIN = 1 (for row), and FUN = sum.
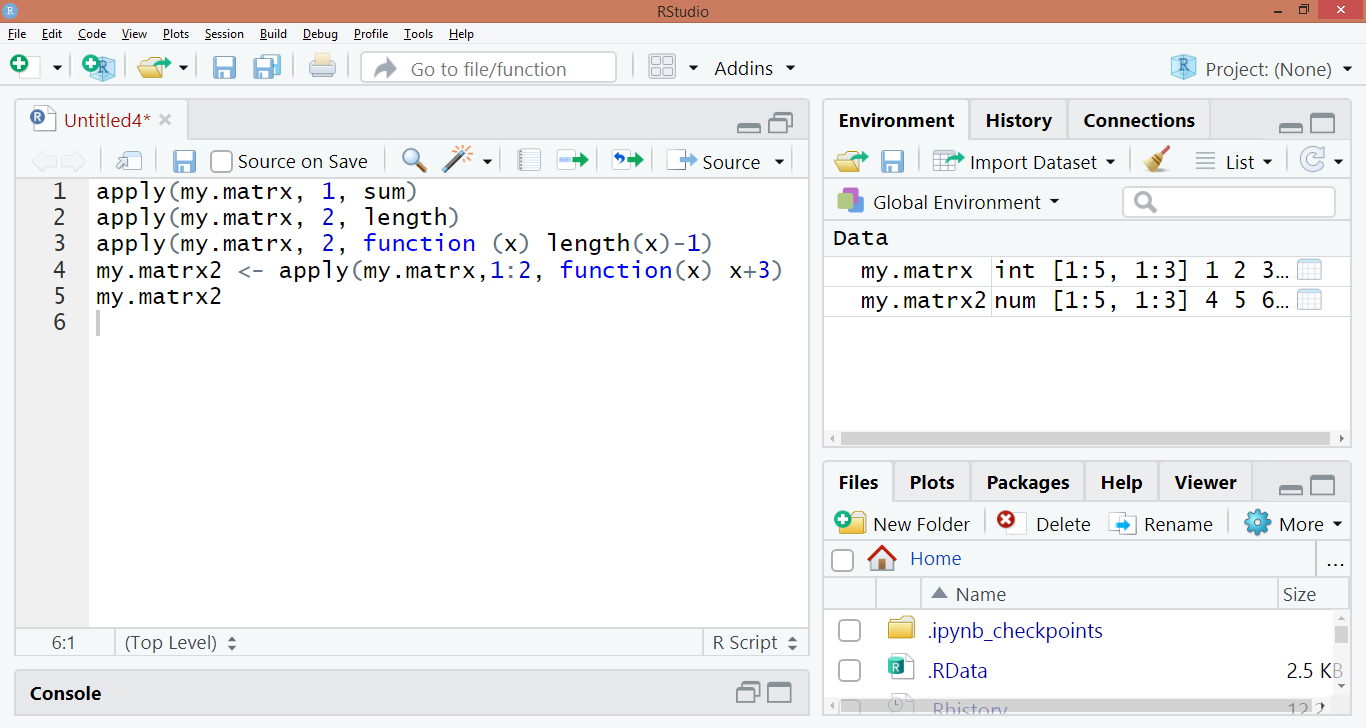
apply(my.matrx, 1, sum)
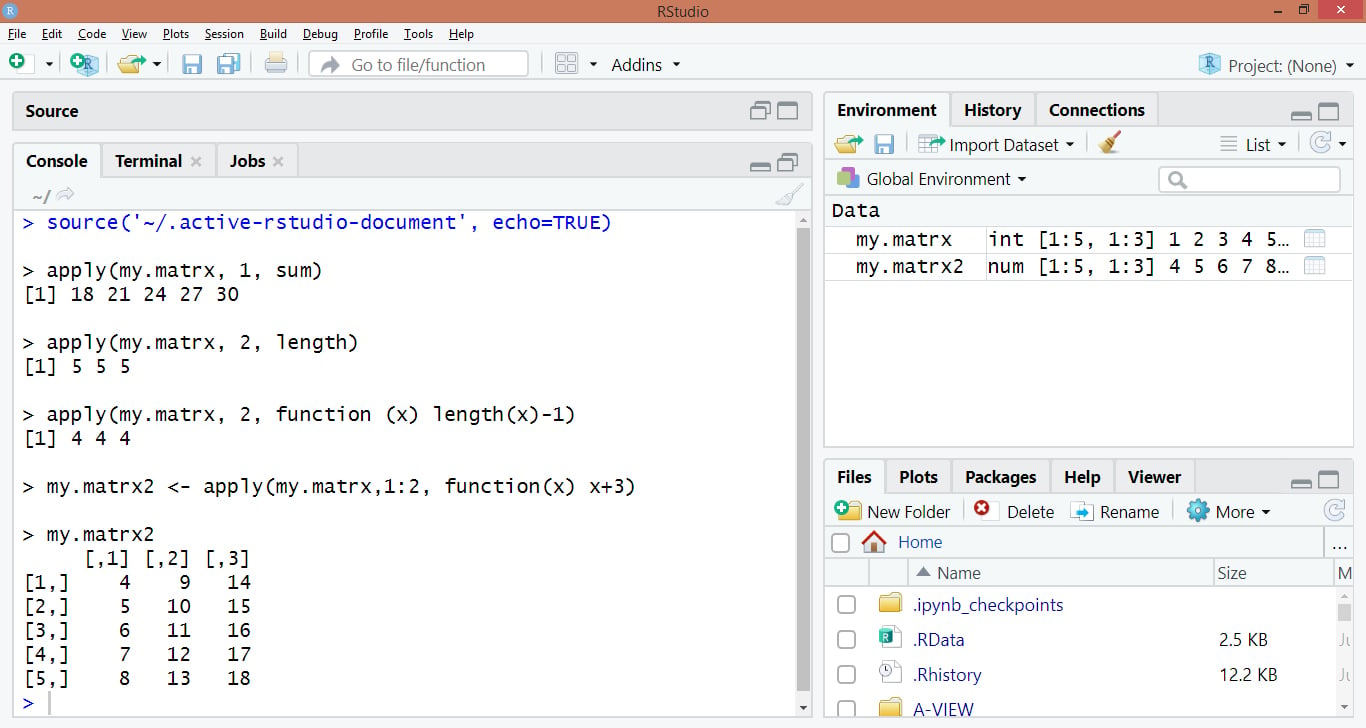
It will return a vector containing the sums for each row.
Example 2: Creating a function in the arguments
Now, we will find how many data points (n) are in each column of m by using columns, MARGIN = 2. Thus, we can use the length function to do this.
apply(my.matrx, 2, length)
There isn’t a function in R to find n-1 for each column. So, if we want to create our own function and if the function is simple, you can create it right inside the arguments for applying. In the arguments, we created a function that returns length – 1.
apply(my.matrx, 2, function (x) length(x)-1)
As we have seen, the function returned a vector of n-1 for each column.
Example 3: Transforming data
In the previous examples, we used apply to summarize over a row or column. We can also use apply to repeat a function on cells within a matrix. Now, in this example, we will learn how to use apply function to transform the values in each cell. Please give more attention to the MARGIN argument.
my.matrx2 <- apply(my.matrx,1:2, function(x) x+3).
my.matrx2
Code Display:
Output:
Example 4: Vectors
In previous examples, we have learned several ways to use the apply function on a matrix. But what if we want to loop it through a vector instead? Will the apply function work? Let’s check.
vec <- c(1:5)
vec
Output:
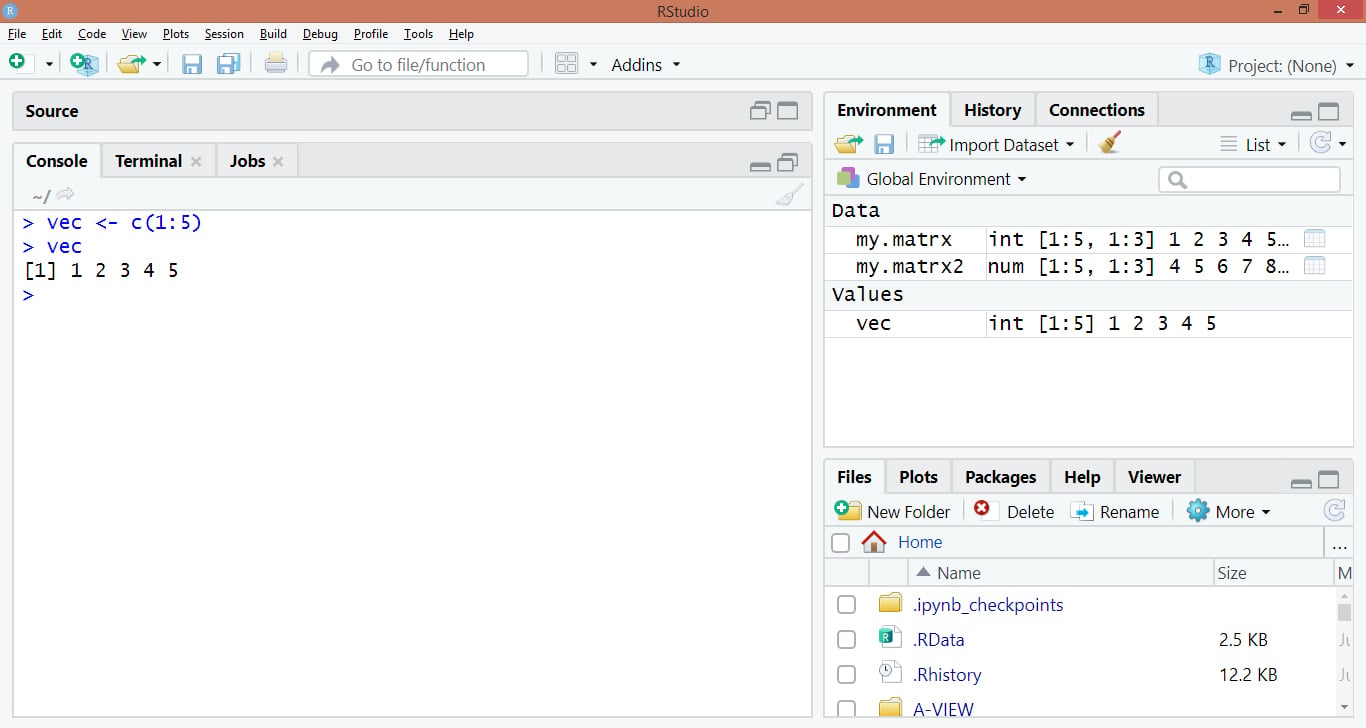
When we will run this function, it will return the error: Error in apply(v, 1, sum): dim(X) must have a positive length. As we can see, this didn’t work because apply was expecting the data to have at least two dimensions. If we are using data in a vector, we need to use lapply, sapply, or vapply instead.
Any doubts in R Matrix Function till now? Please comment below.
What is sapply() function in R?
It is a dimension preserving variant of “sapply” and “lapply”.
sapply is a user-friendly version and is a wrapper of lapply. By default, sapply returns a vector, matrix or an array.
- Keywords – Misc, utilities
- Usage – Sapply(X, FUN, …, simplify = TRUE, USE.NAMES = TRUE)
Lapply(X, FUN, …)
Arguments – The arguments used in the sapply() function are discussed below:
- X – It is a vector or list to call sapply.
- FUN – A function.
- … – Optional arguments to FUN.
- simplify – It is a logical value which defines whether a result is simplified to a vector or matrix (if possible).
- USE.NAMES – Logical; if it is TRUE and X is a character, then use X as names for the result unless it has names already.
Do you know about R Lists
How to use sapply() function in R?
sapply() function applies a function to margins of an array or matrix.
Usage – sapply(x, func, …, simplify = TRUE, USE.NAMES = TRUE)
sapply function in R Example:
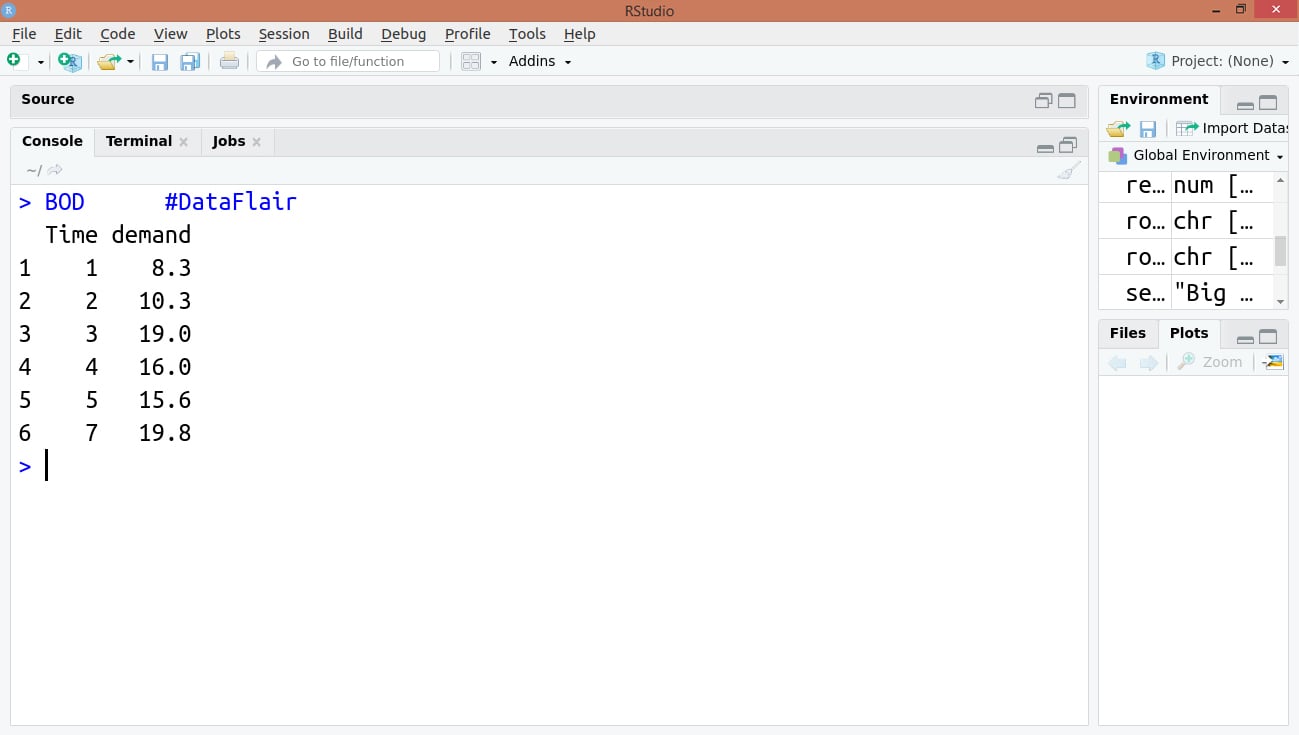
> BOD #R built-in dataset, Biochemical Oxygen Demand
Output:
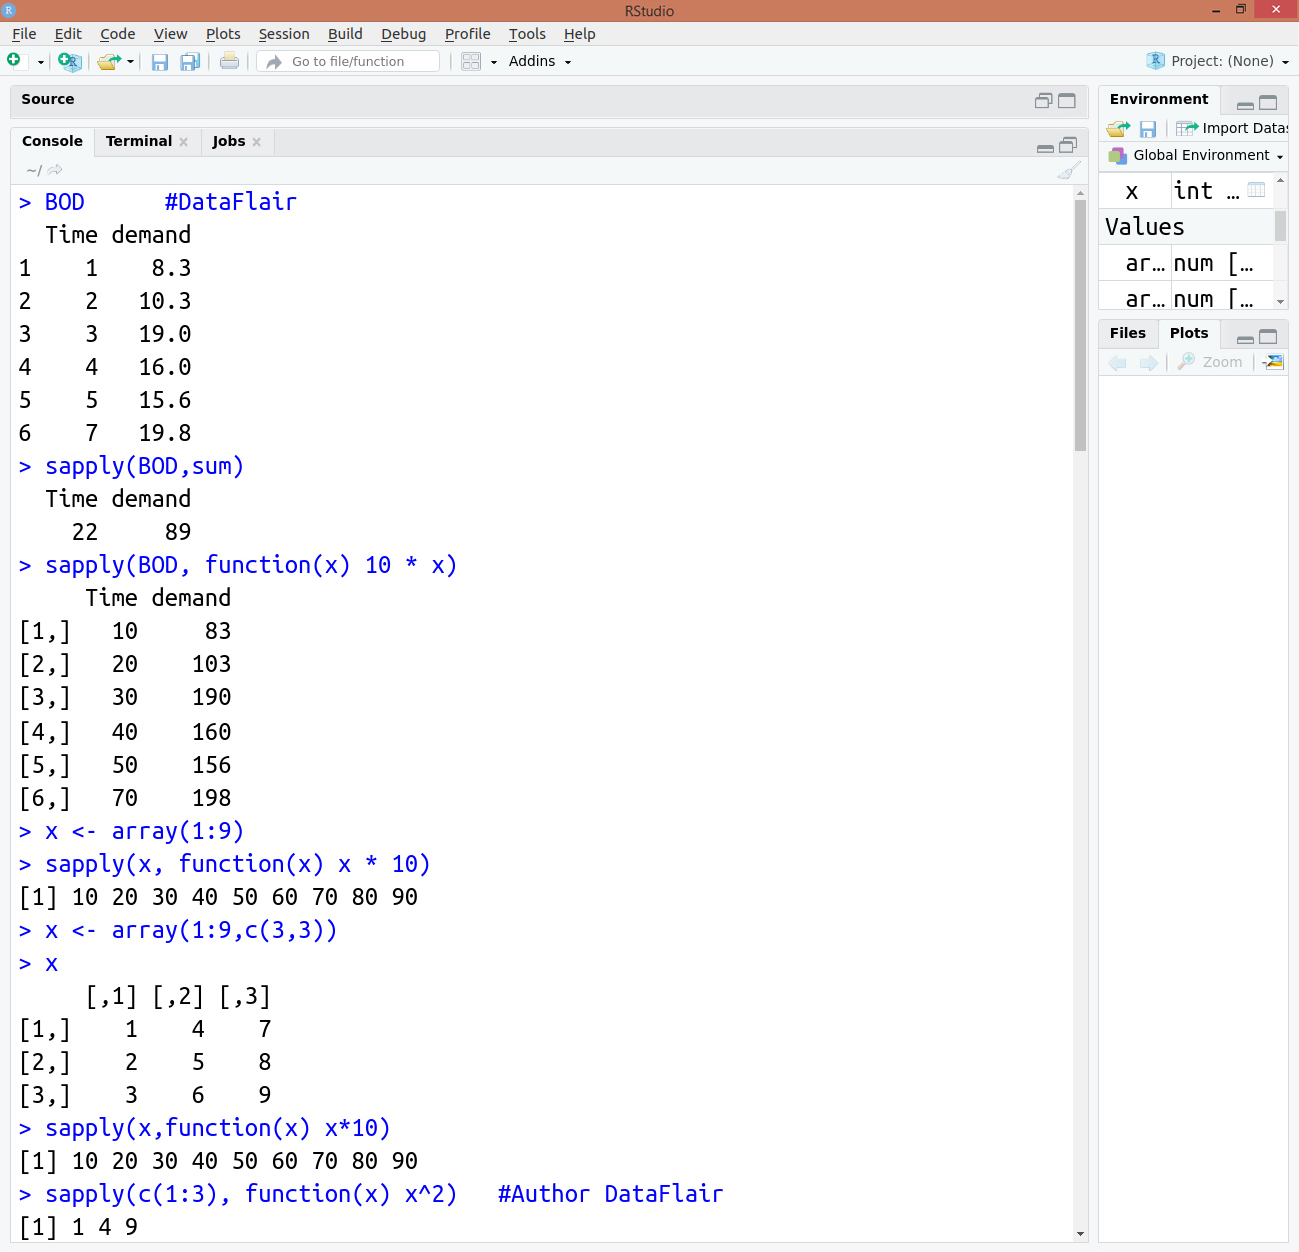
Sum up for each row:
sapply(BOD, sum)
Multiply all values by 10:
> sapply(BOD,function(x) 10 * x)
Used for array, margin set to 1:
x <- array(1:9)
> sapply(x,function(x) x * 10)
Two-dimension array, the margin can be 1 or 2:
> x <- array(1:9,c(3,3))
> x
> sapply(x,function(x) x * 10)
> sapply(c(1:3), function(x) x^2)
Output:
Summary
We have studied about R matrix function in detail. Also, we discussed its most promising uses, examples and how the function is applied over datatypes. Moreover, in this tutorial, we have discussed the two matrix function in R; apply() and sapply() with its usage and examples. Hence, the information which we have discussed in this tutorial is sufficient enough to learn matrices and its functions in R.
Still, if you have any query or suggestions related to this matrix function in R, feel free to share with us in the comment section.
Now, its turn for exploring the R recursive function tutorial.
If you are Happy with DataFlair, do not forget to make us happy with your positive feedback on Google


