Input-Output Features in R Programming – How to use its Functions
Job-ready Online Courses: Click, Learn, Succeed, Start Now!
With this tutorial of R programming, explore the various input-output features in R. Also, learn about the functions used in the features and their implementation with examples. So, let’s start.
Introduction to Input-Output Features in R
We will discuss the different input-output features in R programming one-by-one:
1. Accessing the Keyboard and Monitor
In R, there are a series of functions that can be used to request an input from the user, including readline(), cat(), and scan(). But, the readline() function is the most optimal function for this task.
Reading from the keyboard:
To read the data from the keyboard, we use three different functions; scan(), readline(), print().
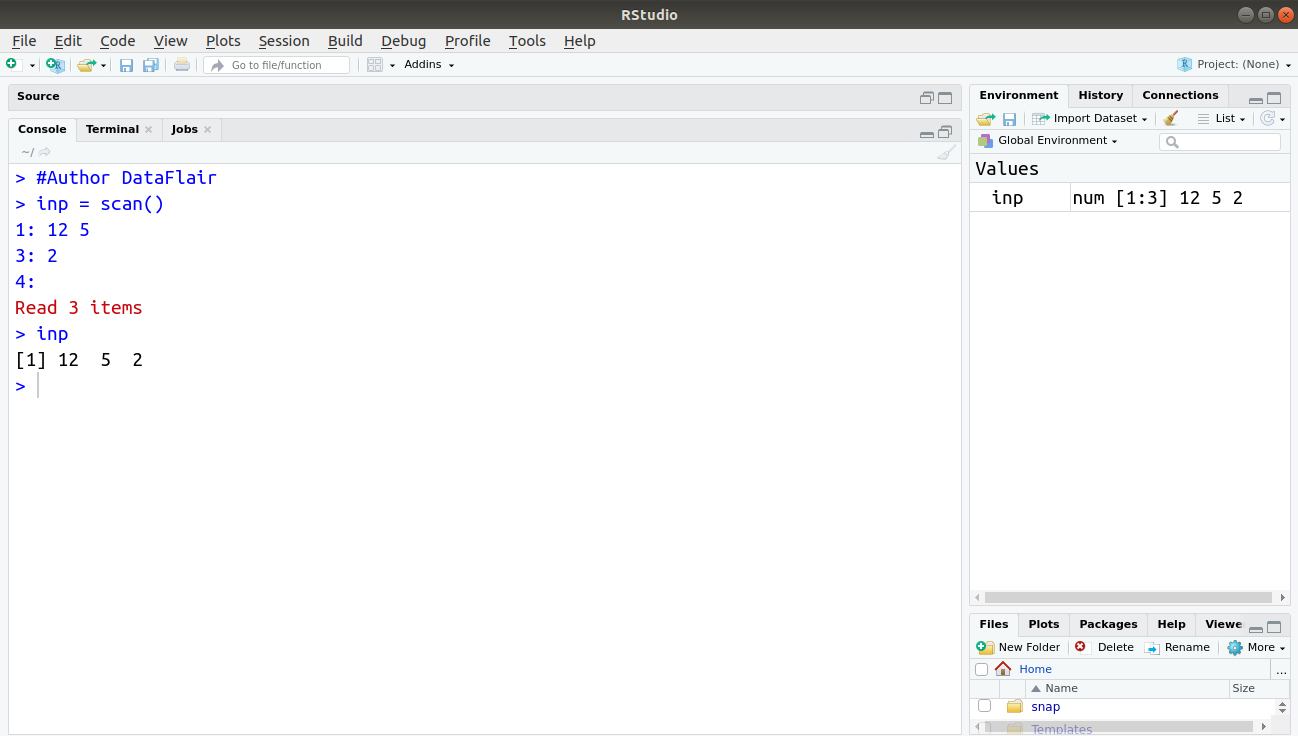
- scan()
Read Data Values: This is used for reading data into the input vector or an input list from the environment console or file.
Keywords: File, connection.
For example:
> #Author DataFlair
> inp = scan()
> inp
Output:
Wait! Have you completed the Principles and Functions of R Debugging
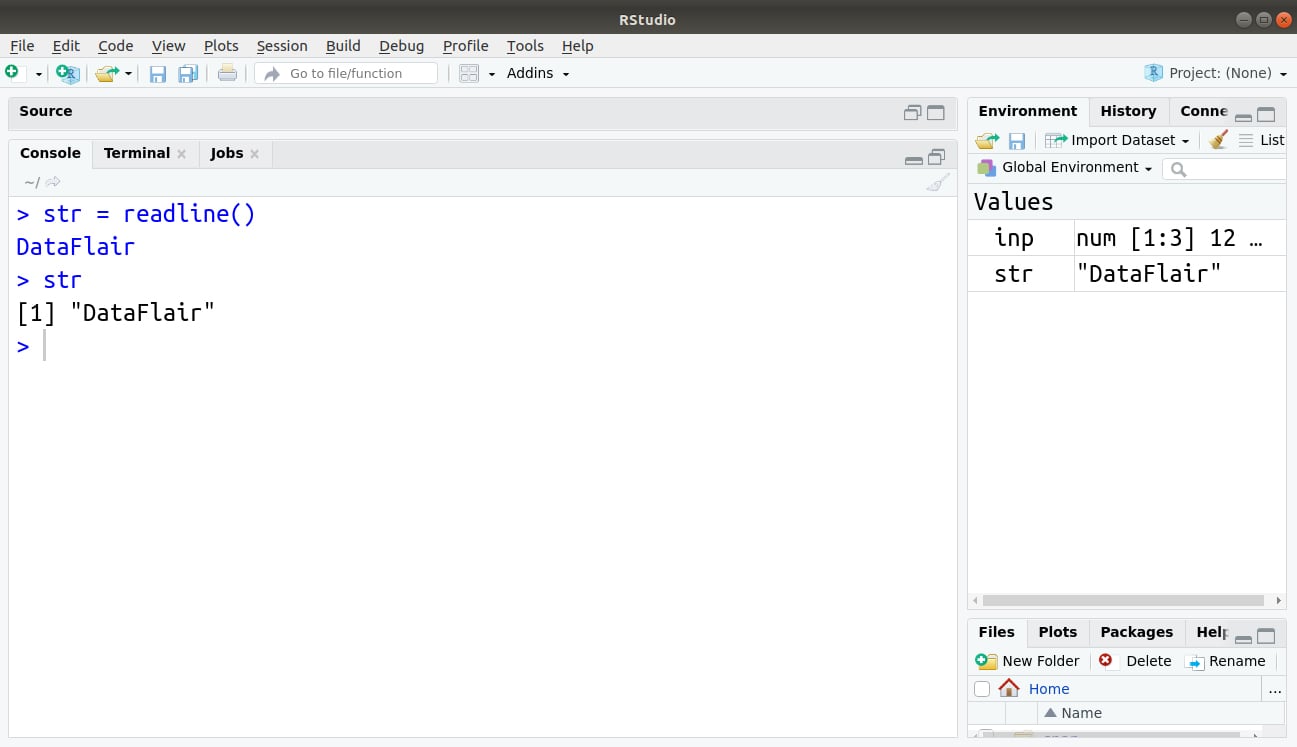
- readline()
With readline(), we read multiple lines from a connection.
Keywords: File, connection.
We can use readline() for inputing a line from the keyboard in the form of a string:
For example:
> str = readline()
> str
Output:
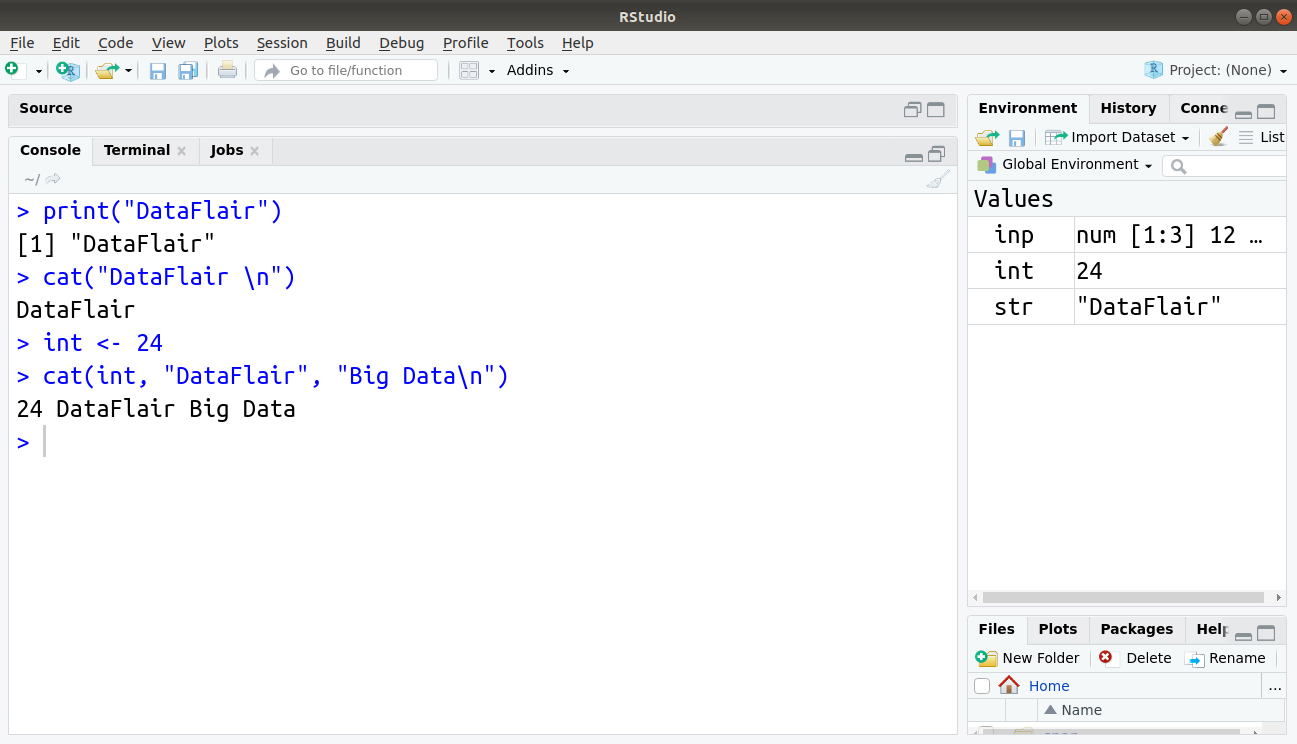
- print()
A print function simply displays the contents of its argument object. New printing methods can be easily added for new classes through this generic function.
Keywords: print
Printing to the screen: In interactive mode, one can print the value of the variable by just typing the variable name or expression. print() function can be used in the batch mode as:
print(x)
The argument might be an object. So it is better to use cat() instead of print(), as the last one can print only one expression and its result is numbered, which may be a nuisance to us. Here is an example written below:
> print("DataFlair")
> cat("DataFlair \n")
DataFlair
> int <- 24
> cat(int, "DataFlair", "Big Data\n")
24 DataFlair Big Data
Output:
Take a sneak peek into Arguments in R Programming
2. Reading and Writing Files
There are many methods to read and write files in R programming:
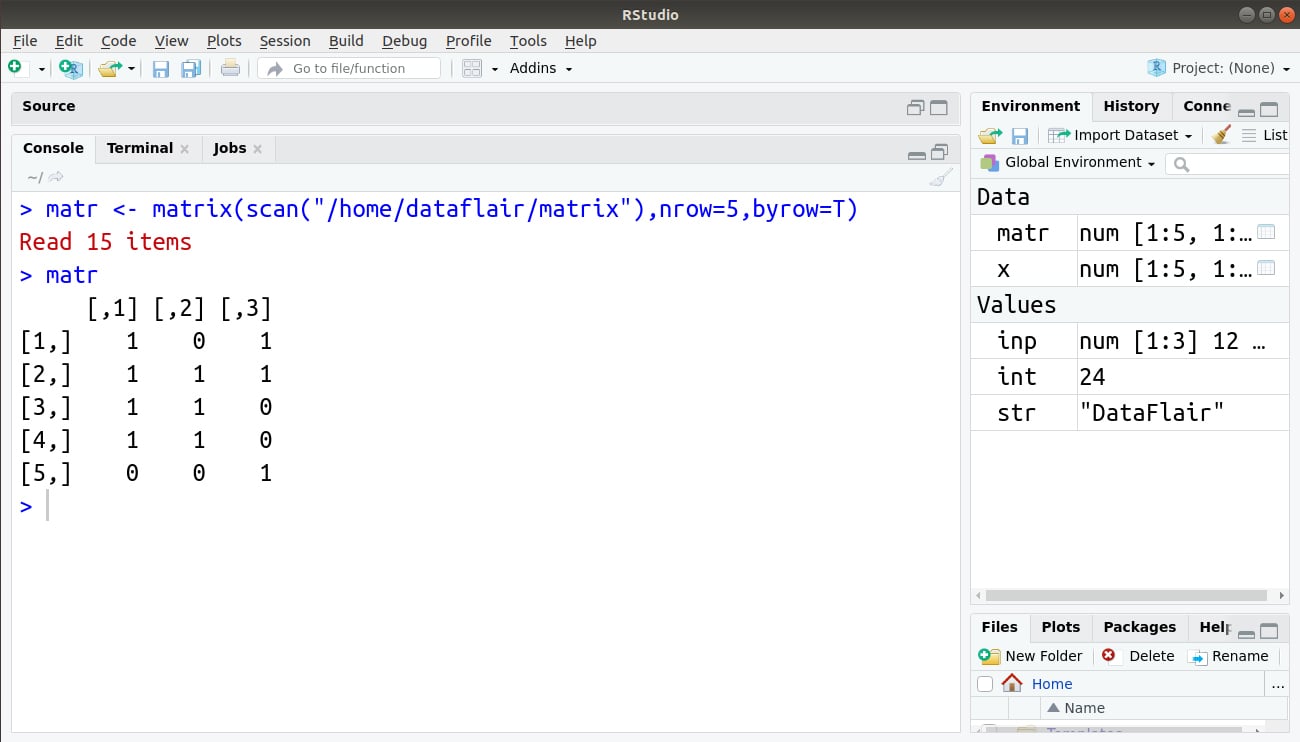
2.1 Reading a data or matrix from a file
Usually we use function read.table() to read data. A header has a default value of ‘FALSE’. Therefore, having no header pertains to no value. R factors are also called as character strings. In order to disable this feature, the argument can be stated as.is = T as a part of your call to read.table().
When you have a spreadsheet export file, i.e. having a type.csv where the fields are divided by commas in place of spaces, use read.csv() in place of read.table(). To read spreadsheet files, we can use read.xls.
When you read in a matrix using read.table(), the resultant object will become a data frame, even when all the entries got to be numeric. A case exists which may followup call towards as.matrix() in a matrix.
For example:
We store this matrix in a file. We will then use the scan() function to read the contents of this file.
> matr <- matrix(scan("/home/dataflair/matrix"),nrow=5,byrow=T)

> matr
Output:
You must definitely check the tutorial on R Matrix Functions
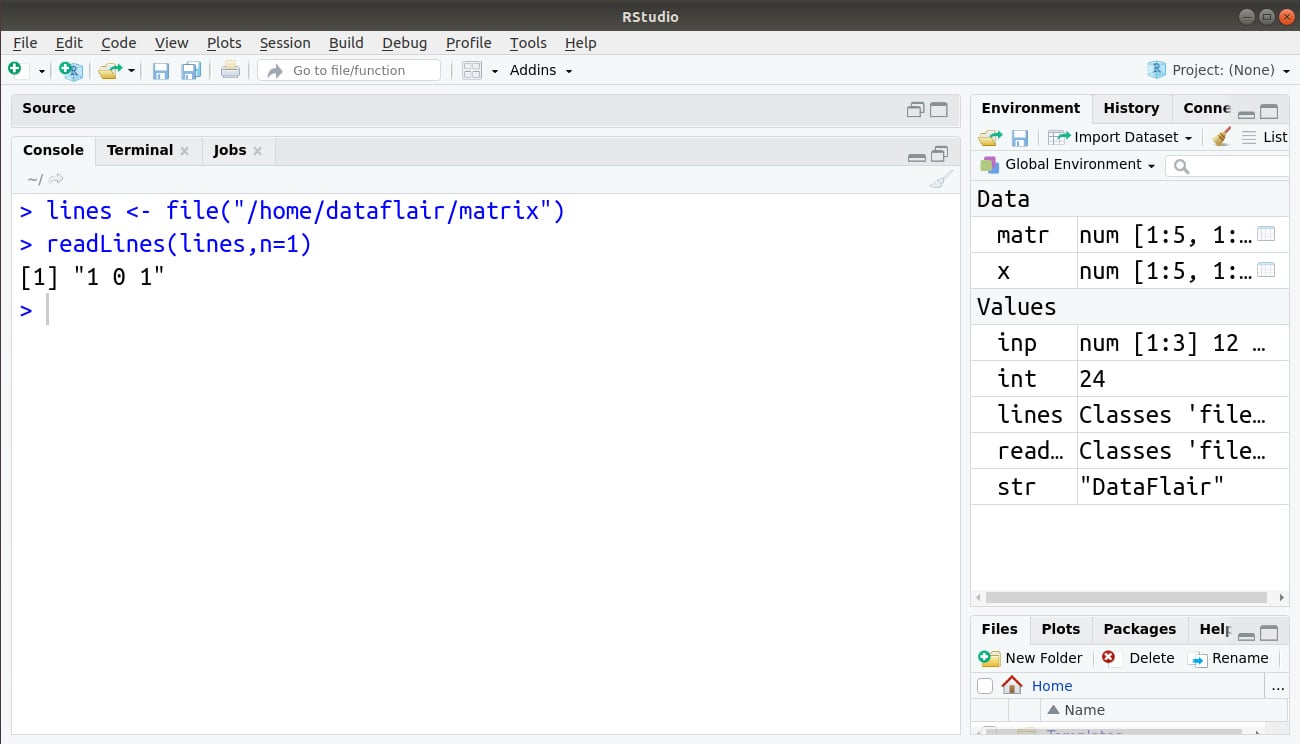
2.2 Reading a single file one line at a time
We can use readLines() for this, but we need to produce a connection first, by calling the file().
For example:
> lines <- file("/home/dataflair/matrix")
> readLines(lines,n=1)
Output:
2.3 Writing a table to a file
In R, we use write.table() function to write a data-frame in the form of a table. It is same as read.table() which writes a data frame instead of reading one. Let us first create our table as follows:
data <- read.table(header=TRUE, text='
subject sex size
1 M 7
2 F NA
3 F 9
4 M 11
')
Output:
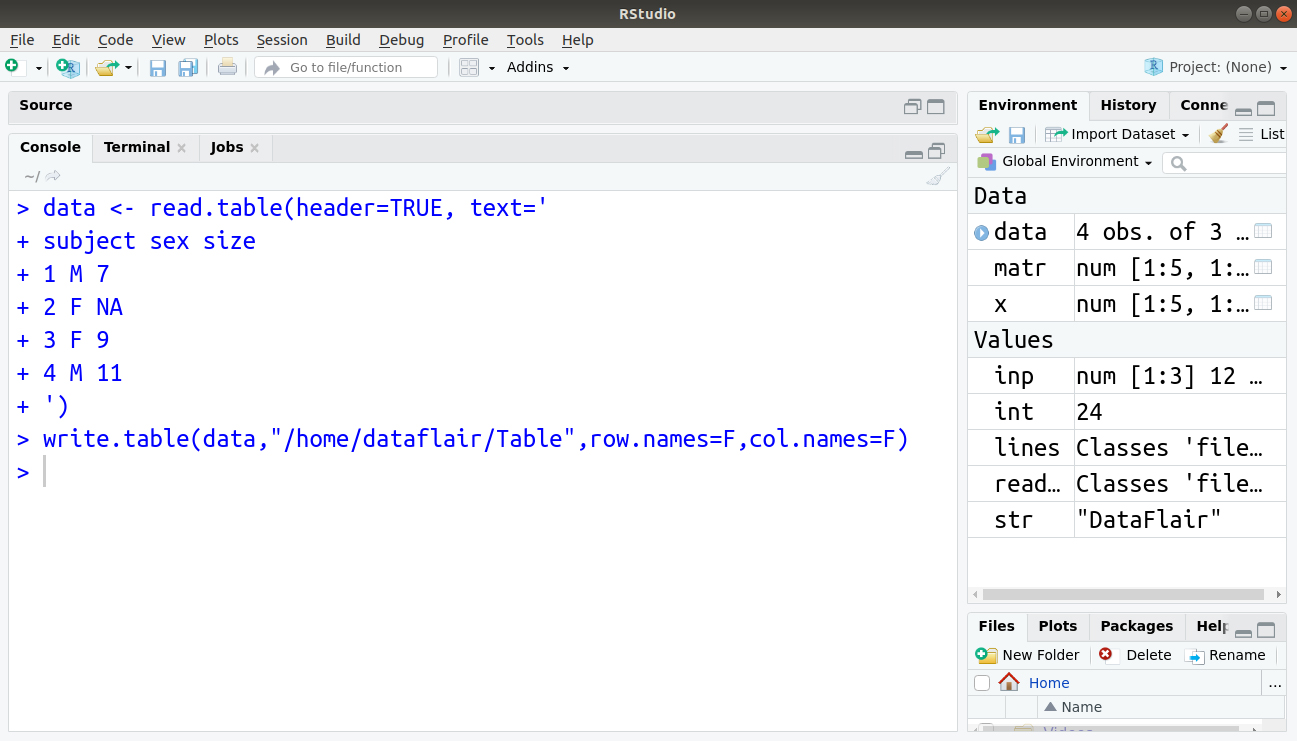
We then write a table to the file as follows:
> write.table(data,"/home/dataflair/Table",row.names=F,col.names=F)
File Display:
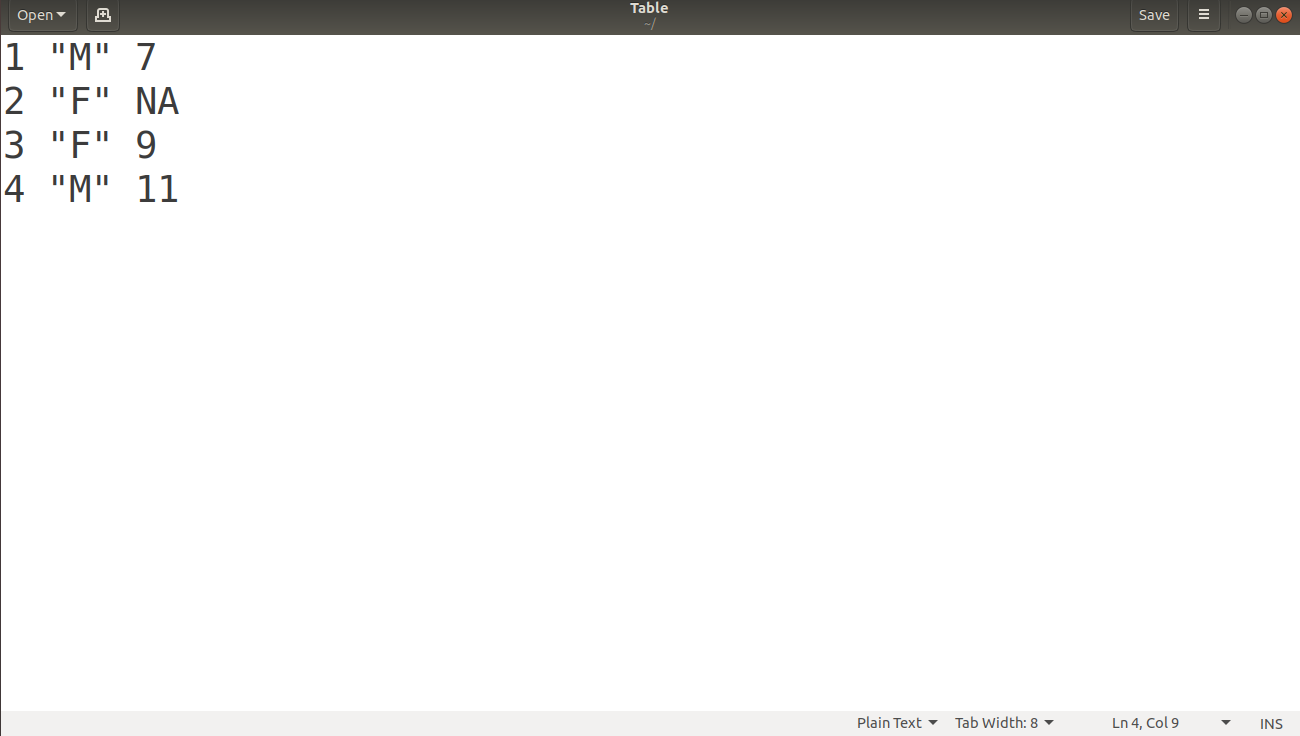
Opening the “Table” file at the saved location, we obtain:
A must learn concept that you can’t miss – R Data Frame
3. Connection Operations
There are functions to Manipulate Connections (Files, URLs,…). Functions to create, open and close connections.
For example: URLs, pipes and other types of generalised files.
Keywords: file, connection
Extended Example: Reading PUMS sample files
There is a collection of records for every sample of housing units that store information about the characteristics of each unit.
a) Why use PUMS?
There is greater accessibility to the inexpensive data, mostly for research purposes. Therefore, for students, this is highly beneficial because they are searching for higher accessibility to inexpensive data. Social scientists often use the PUMS for regression analysis and modeling applications.
b) How can I access PUMS?
Statistical software is a tool used to work with PUMS files.
Do you know about Linear Regression in R Programming
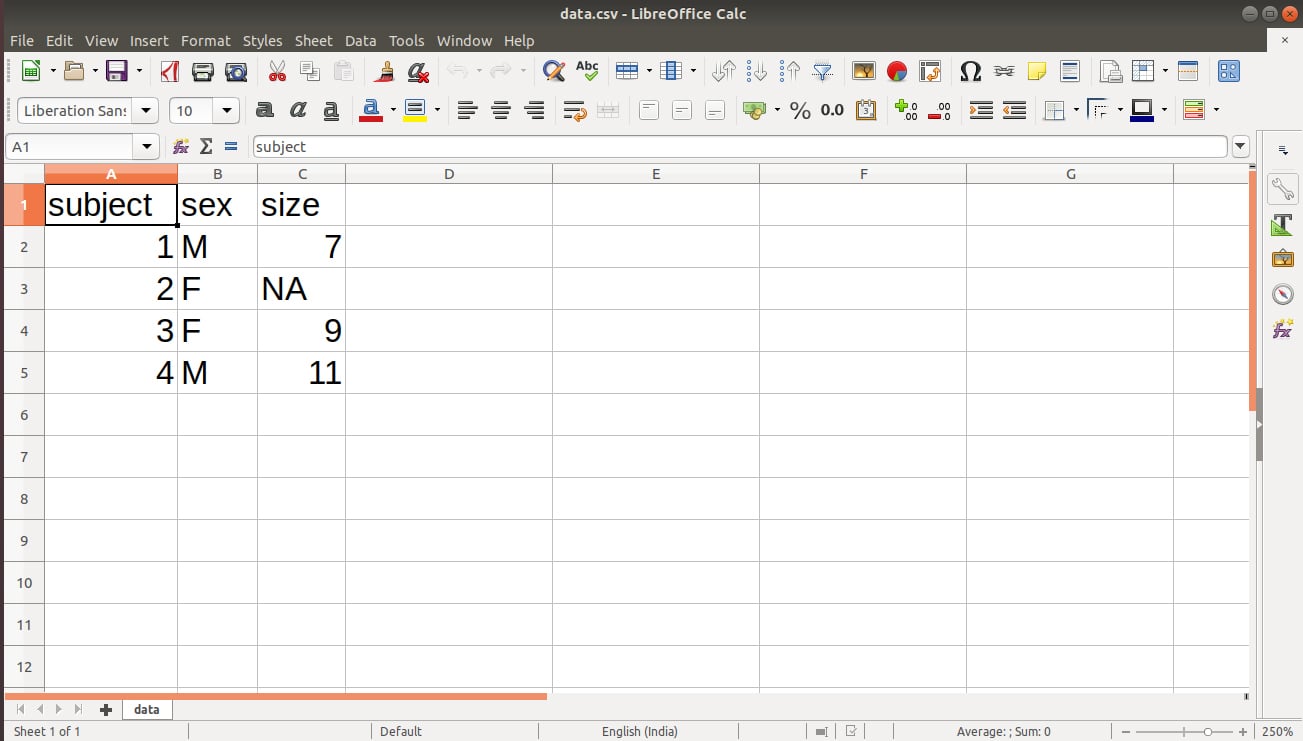
4. Writing to a file
We use write.csv() to write files. By default, write.csv() includes row names.
# Author DataFrame
data <- read.table(header=TRUE, text='
subject sex size
1 M 7
2 F NA
3 F 9
4 M 11
')
# Write to a file, suppress row names
write.csv(data, "/home/dataflair/data.csv", row.names=FALSE)
We obtain the following output in our data.csv file:
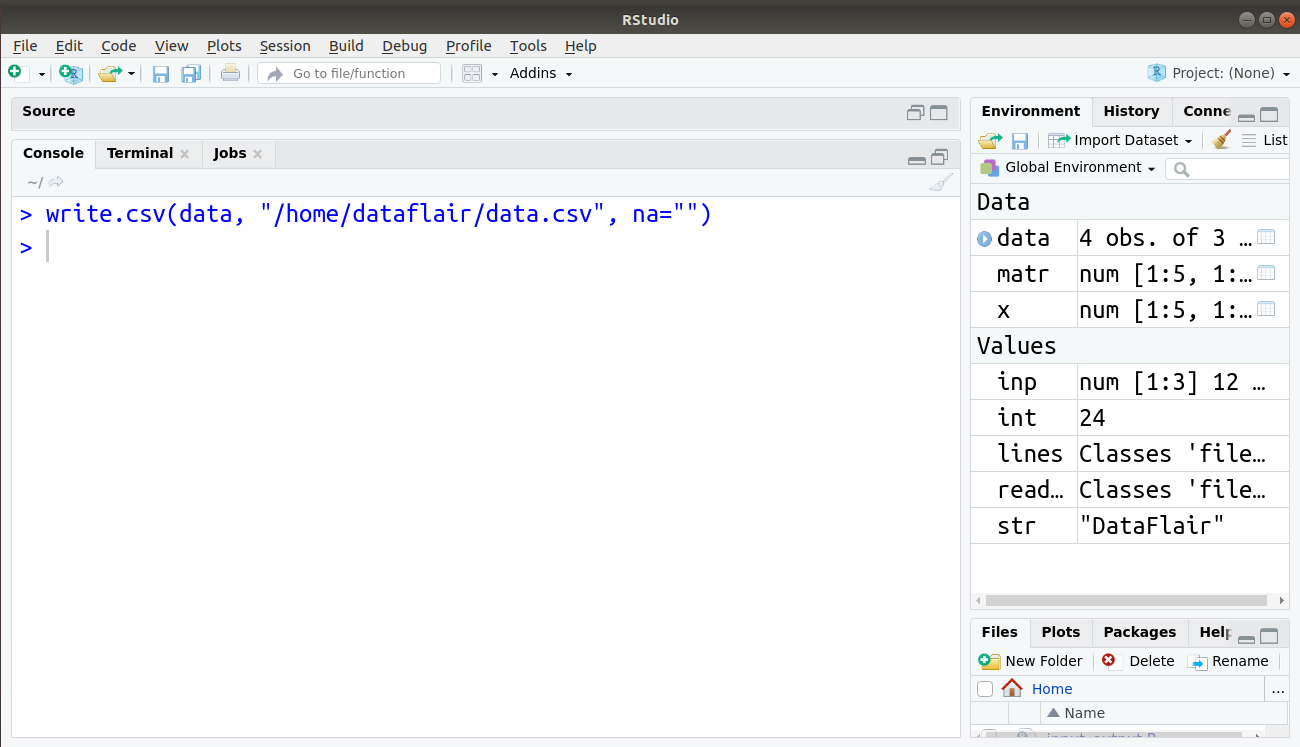
In the above output of our file, we have a missing value denoted by NA. We can replace this NA with “” using the following line of code:
> write.csv(data, "/home/dataflair/data.csv", na="")
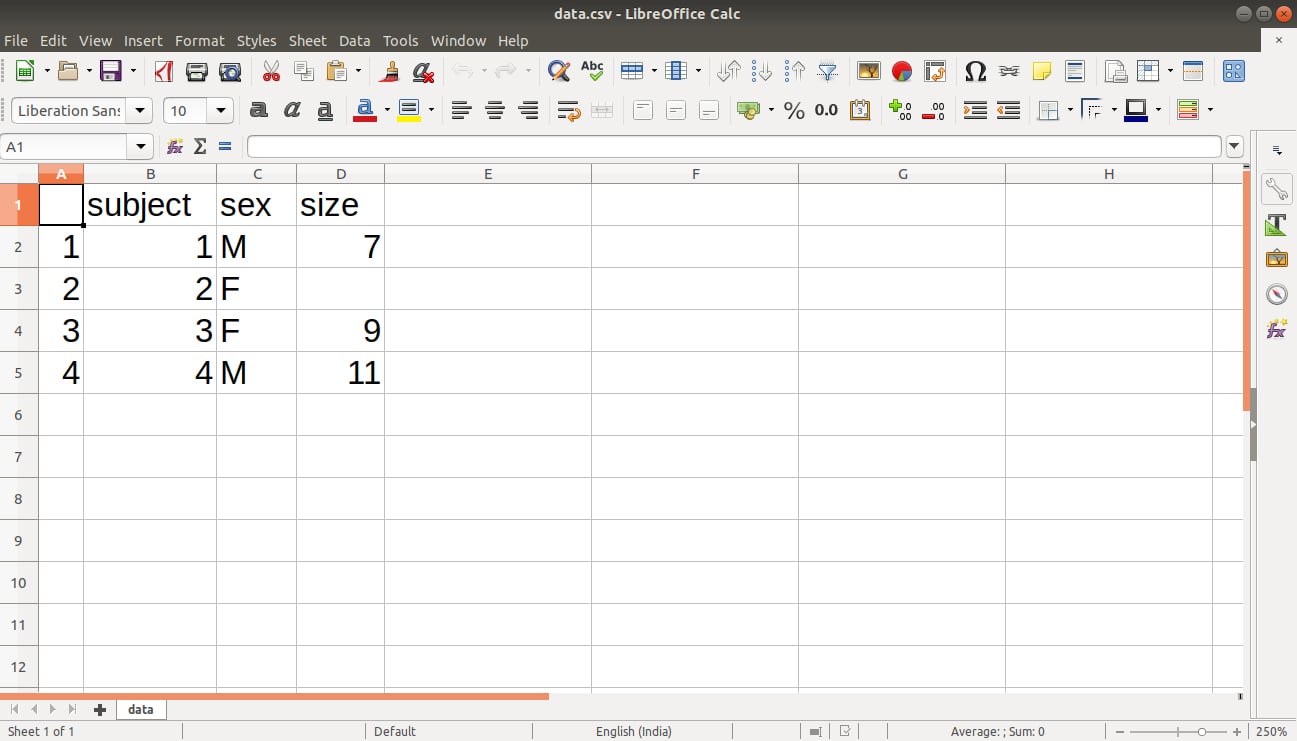
The output is saved in our file data.csv as follows:
The output is saved in our file data.csv as follows:
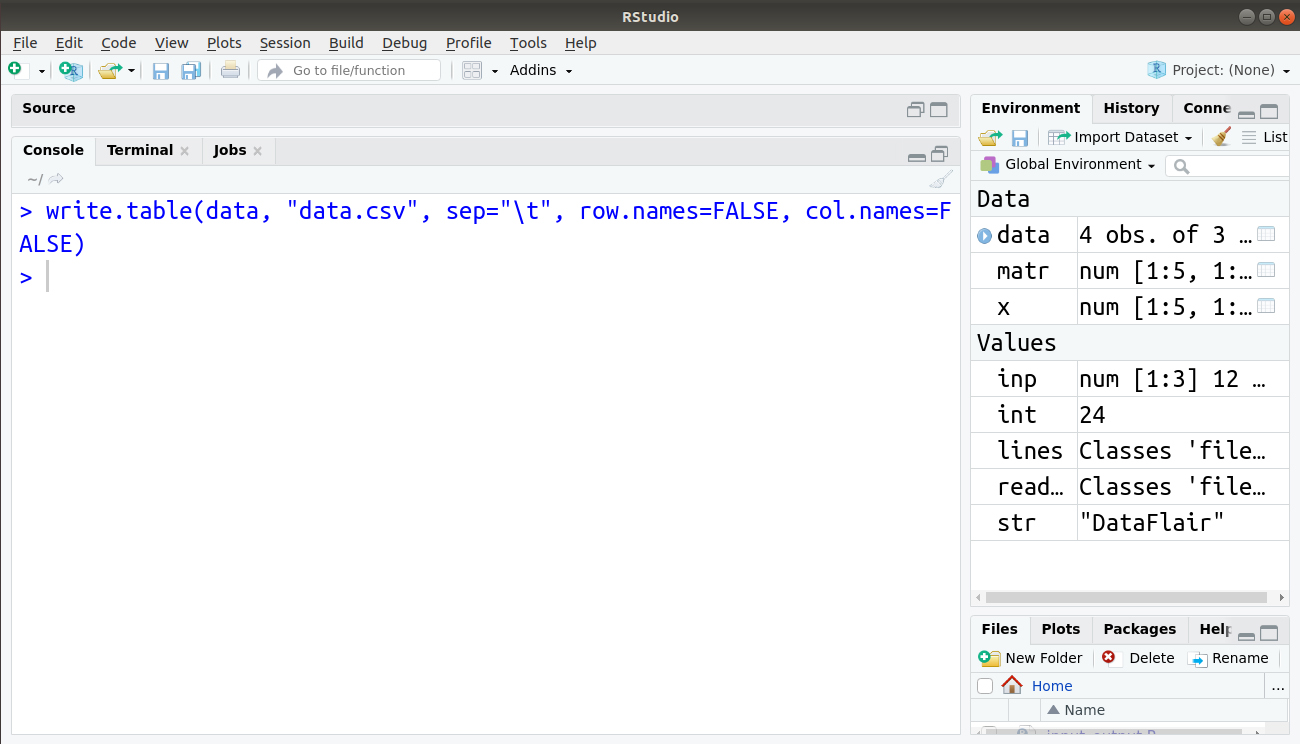
We can also use tabs, suppress row and column names using the following line of code:
> write.table(data, "data.csv", sep="\t", row.names=FALSE, col.names=FALSE)
Our file data.csv is now displayed as follows:
5. File and Directory Information
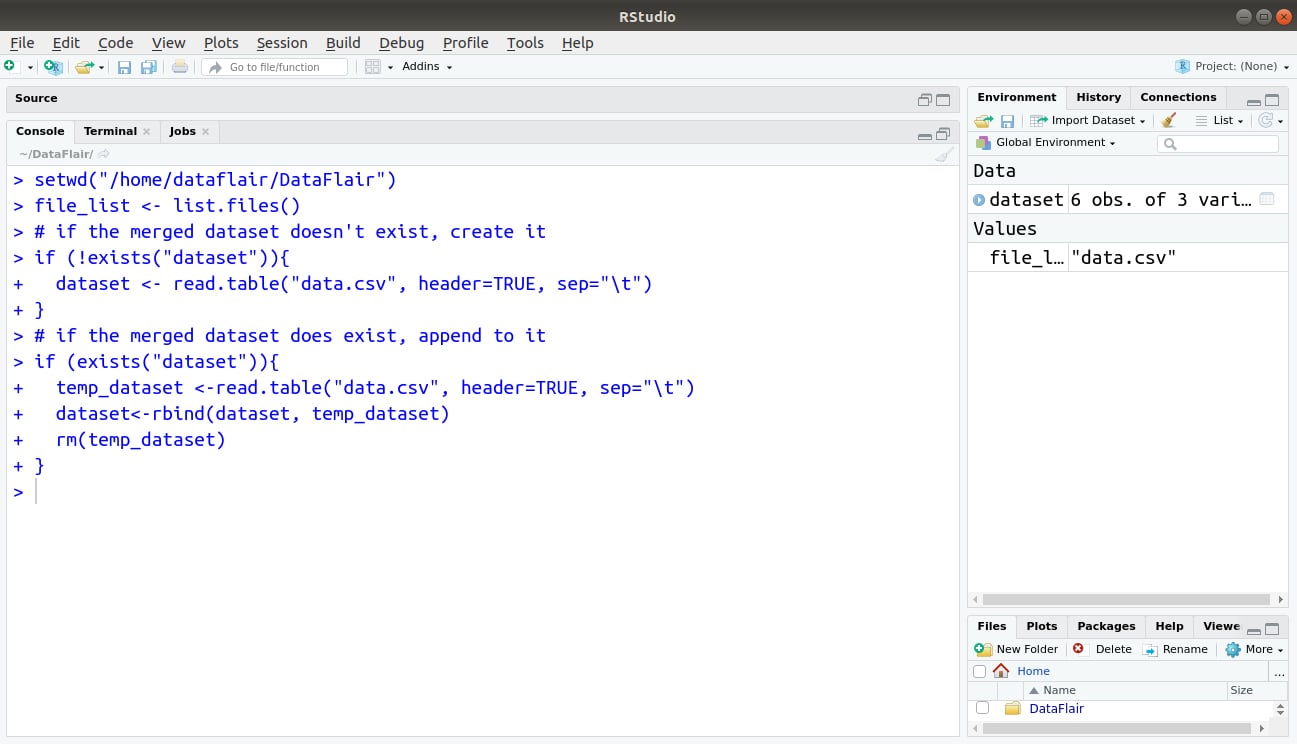
Merge all files in a directory using R into a single data frame.
Set the directory:
setwd("/home/dataflair/DataFlair")
Getting a list of files in a directory:
file_list <- list.files()
If we want to list the files in a different directory, specify the path to list.files.
For example:
If we want the files in the folder C:/foo/, we can use the following code:
file_list <- list.files()
Merging the files into a single data frame
The final step is to iterate through the list of files in the current working directory and put them together to form a data frame. When the script encounters the first file in the file_list, it creates the main data frame to merge everything into (called dataset here). This is done using the !exists conditional:
- If a dataset already exists, then a temporary data frame, called temp_dataset is created and added to the dataset. The temporary data frame is removed when we’re done with it using the rm(temp_dataset) command.
- If the dataset doesn’t exist (!exists is true), then we have to create it.
Here’s the remainder of the code:
if (!exists("dataset")){
  dataset <- read.table("data.csv", header=TRUE, sep="\t")
}
# if the merged dataset does exist, append to it
if (exists("dataset")){
  temp_dataset <-read.table("data.csv", header=TRUE, sep="\t")
  dataset<-rbind(dataset, temp_dataset)
  rm(temp_dataset)
}
The full code:
setwd("/home/dataflair/DataFlair")
file_list <- list.files()
# if the merged dataset doesn't exist, create it
if (!exists("dataset")){
  dataset <- read.table("data.csv", header=TRUE, sep="\t")
}
# if the merged dataset does exist, append to it
if (exists("dataset")){
  temp_dataset <-read.table("data.csv", header=TRUE, sep="\t")
  dataset<-rbind(dataset, temp_dataset)
  rm(temp_dataset)
}
Output:
Summary
We have studied about different input-output features in R programming. Along with this, we have studied a series of functions which request to take input from the user and make it easier to understand the data as we use functions to access data from the user and have different ways to read and write graph. TCP/IP is a set of protocols which is also a way of accessing the data.
The next tutorial in R Programming DataFlair Tutorial Series – R String Manipulation Functions
If you have any query related to Input-output features in R, so feel free to share with us.
If you are Happy with DataFlair, do not forget to make us happy with your positive feedback on Google


how to Plot graphically which categories have the highest and lowest varieties
do you have a tutorial on how to use Rstudion on input-output data? if you have it please send to the link through my email below.