Survival Analysis in R Programming – Learn to Predict Accurately!
Expert-led Courses: Transform Your Career – Enroll Now
Do you like to predict the future? I often love to predict the future of others. The statistical tasks of predictions have always been around which allow you to know about the future based on the patterns of the past history. One of such techniques that allow you to measure the duration of time till the occurrence of a future event is Survival Analysis using R. It is one of the most interesting ways of evaluating future occurrences. This is why R survival analysis is one of the most popular techniques which we will implement in this blog.
Before we start our tutorial of R survival analysis, I recommend you to revise Logistic Regression.
What is Survival Analysis in R?
In R, survival analysis particularly deals with predicting the time when a specific event is going to occur. It is also known as the analysis of time to death.
For example:
To predict the number of days a person in the last stage will survive. We use the R package to carry out this analysis.
In the R survival package, a function named surv() takes the input data as an R formula. It creates a survival object among the chosen variables for analysis. Thus, after this survfit() is being used to create a plot for the analysis.
i. Install Package in Survival analysis
Syntax:
install.packages("survival")Types of R Survival Analysis
1. Kaplan Meier Analysis
In 1958, Edward Kaplan and Paul Meier found an efficient technique for estimating and measuring patient survival rates. This estimator which is plotted over time and is based on a mathematical formula to calculate the response. The response can be failure time, survival time or event time. Some of the examples of Kaplan Meier Analysis are –
- Finding out time until the tumor is recurring
- Estimating time until morbidity after there is an intervention in the treatment.
- In industries, it is used to estimate the time until a machine part fails.
Want to practice your R learning? Check out the latest project designed by DataFlair – R Sentiment Analysis
The survival time response is continuous in nature. It is also greater than or equal to 1. We will plot the survival plot using the Kaplan Meier Analysis. We will make use of the ‘lung’ dataset. You can find out more information about this dataset here.
Code:
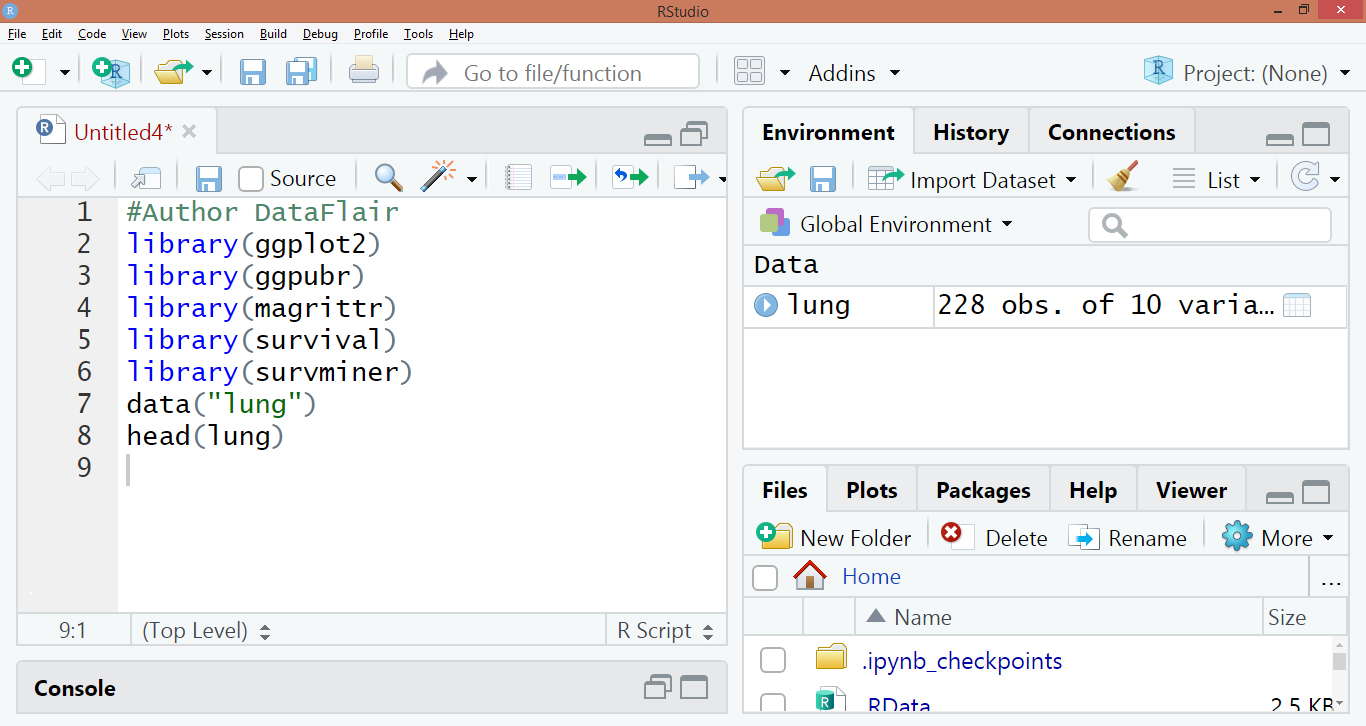
#Author DataFlair
library(“survival”)
library(“survminer”)
data("lung")
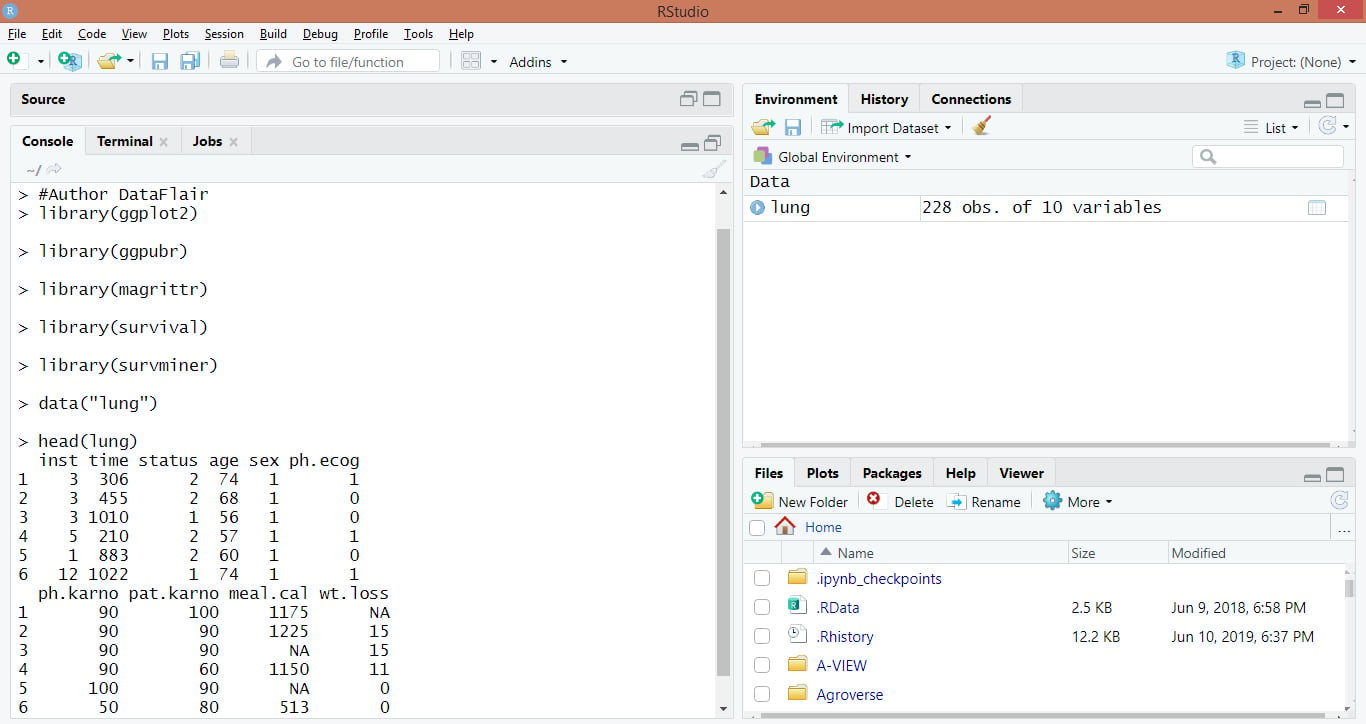
head(lung)Code Display:
Output:
Code:
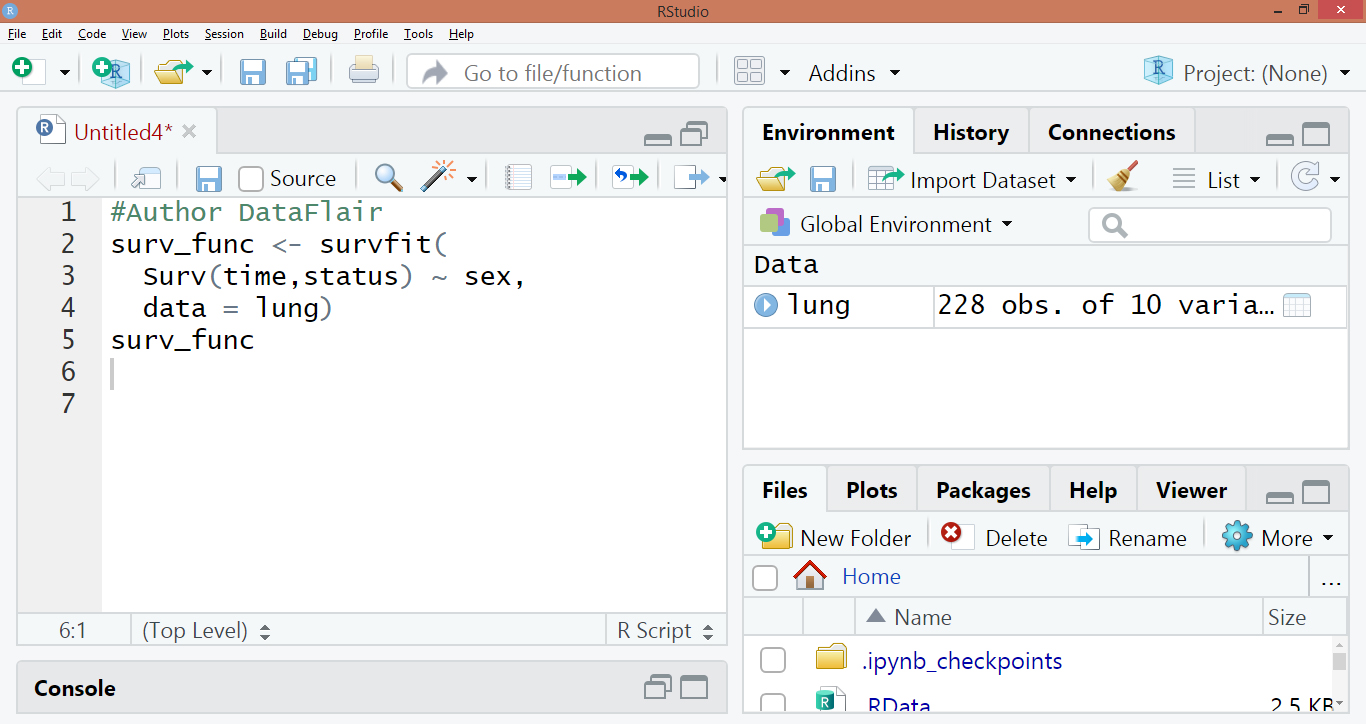
surv_func <- survfit(Surv(time,status) ~ sex, data = lung)
surv_func
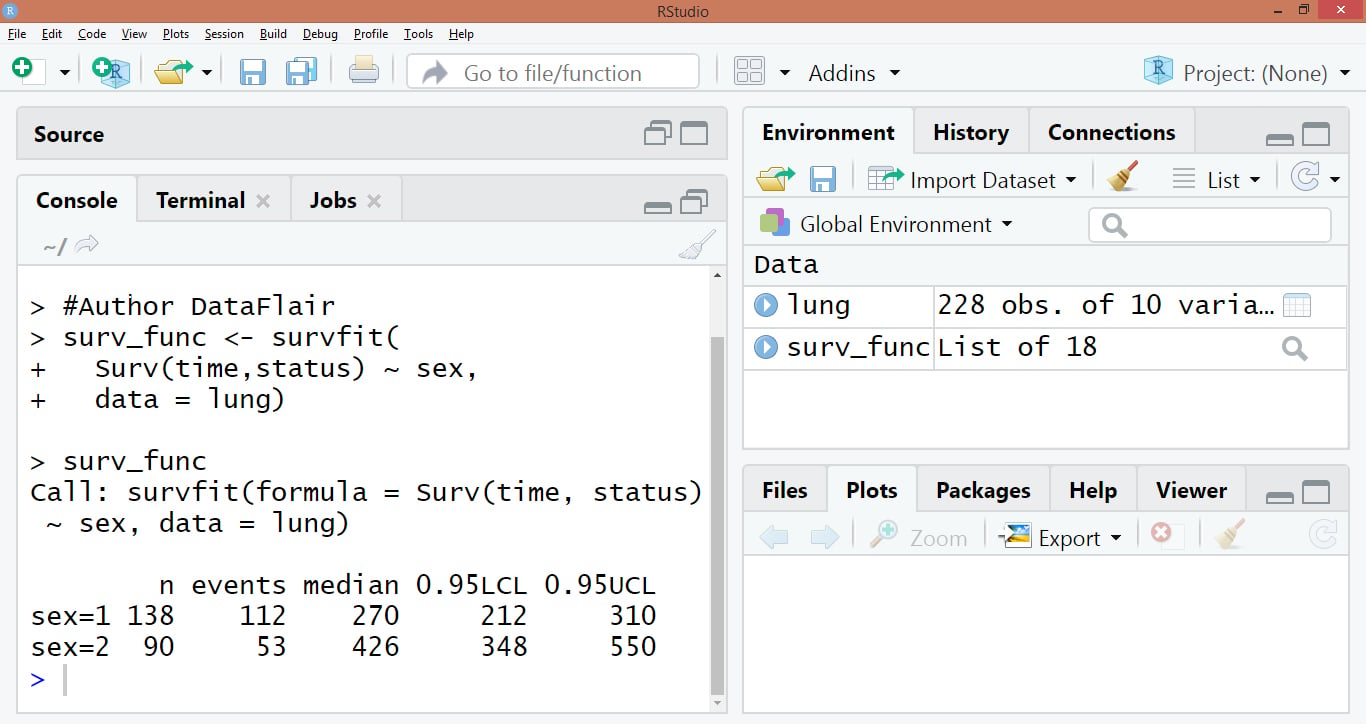
Code Display:
Output:
You must explore the linear model concept in R
Code:
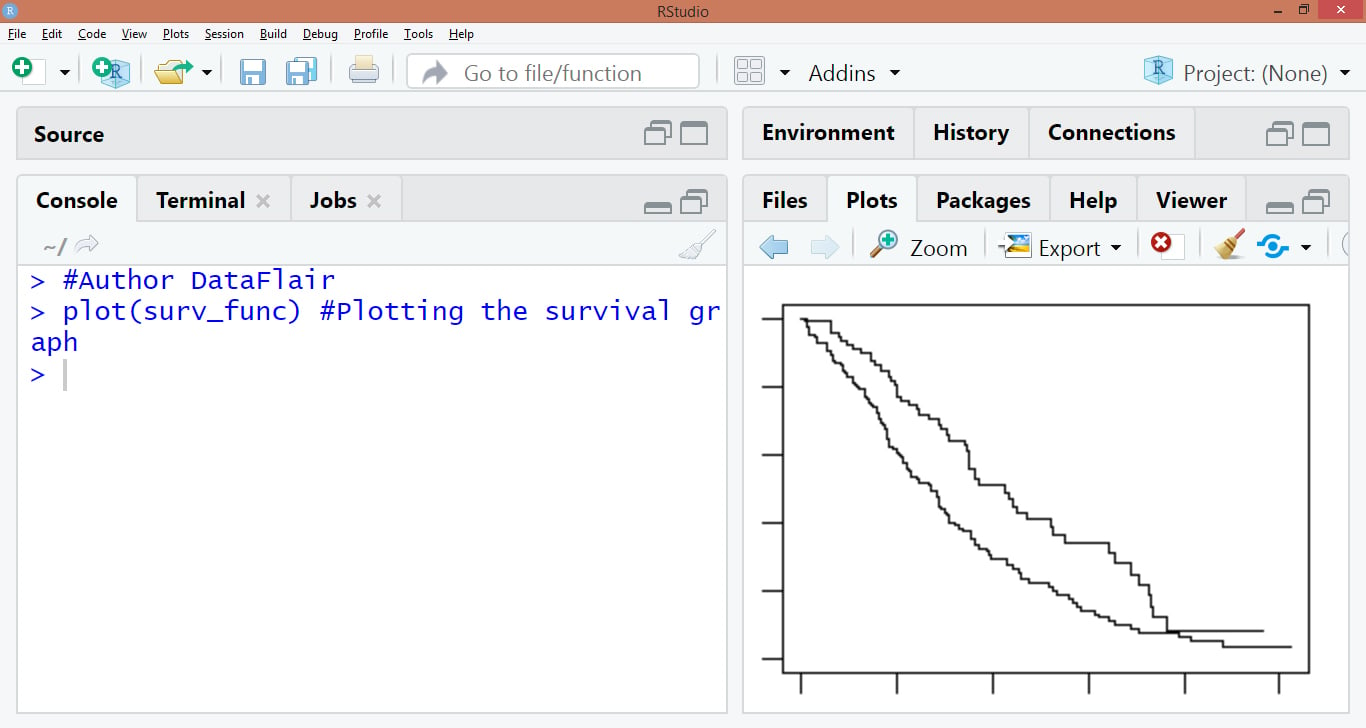
plot(surv_func)
Output:
2. Box Cox Model
The Cox Proportional Hazard model is a popular regression model that is used for the analysis of survival data. It was originally used in the medical area to investigate and assess the relationship between the survival times of patients and their corresponding predictor variables.
The Cox Proportional Hazard Model is an alternative to the above discussed Kaplan-Meier model. It works for both the quantitative predictor as well as for the categorical variable. Therefore, we are able to assess the several risk factors that are involved. In this section, we will implement this model using the coxph() function.
Code:
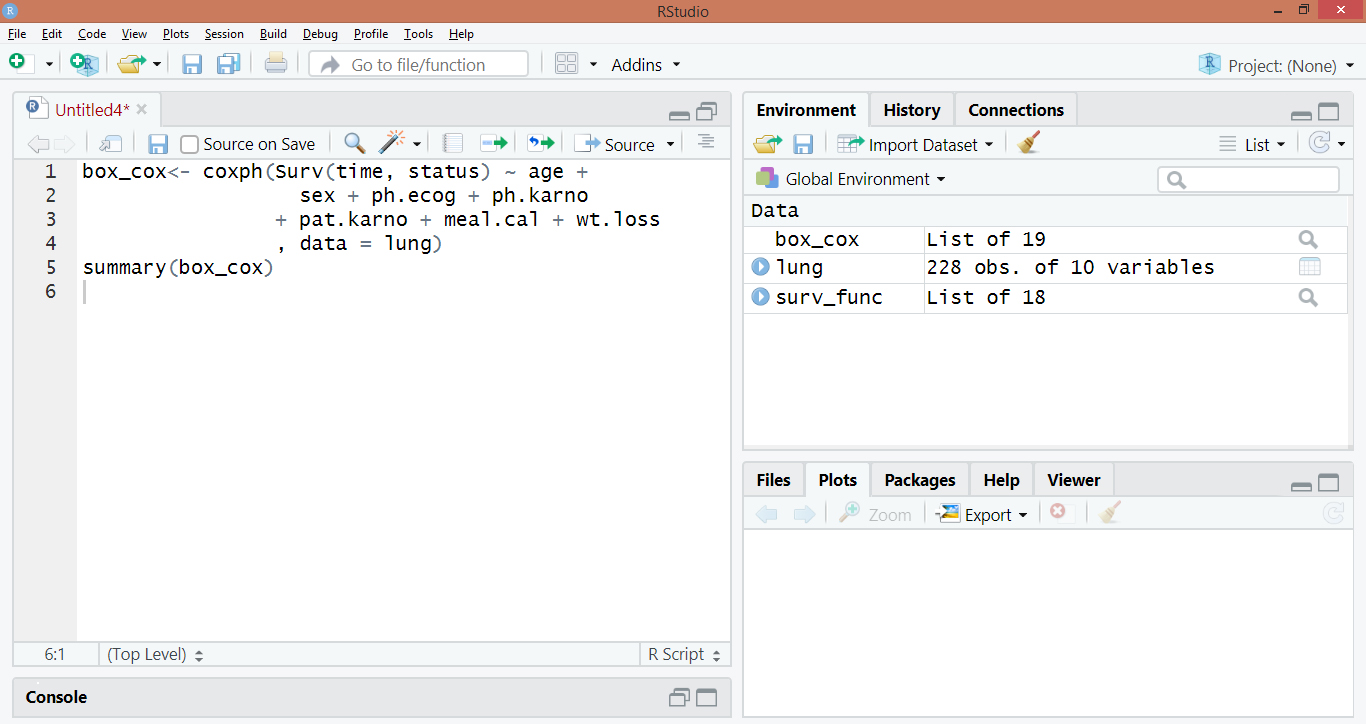
box_cox<- coxph(Surv(time, status) ~ age +
sex + ph.ecog + ph.karno
+ pat.karno + meal.cal + wt.loss
, data = lung)
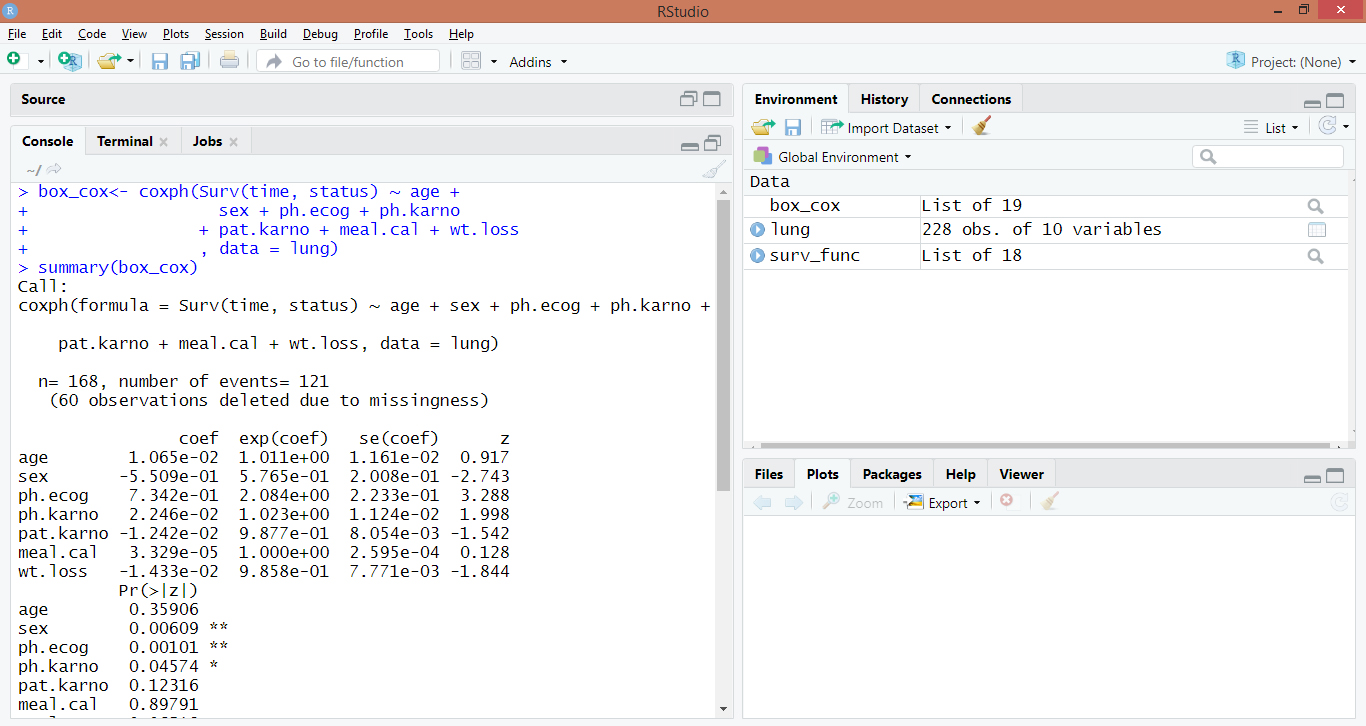
summary(box_cox)Code Display:
Output:
Wait! You forget to check non-linear regression in R
Code:
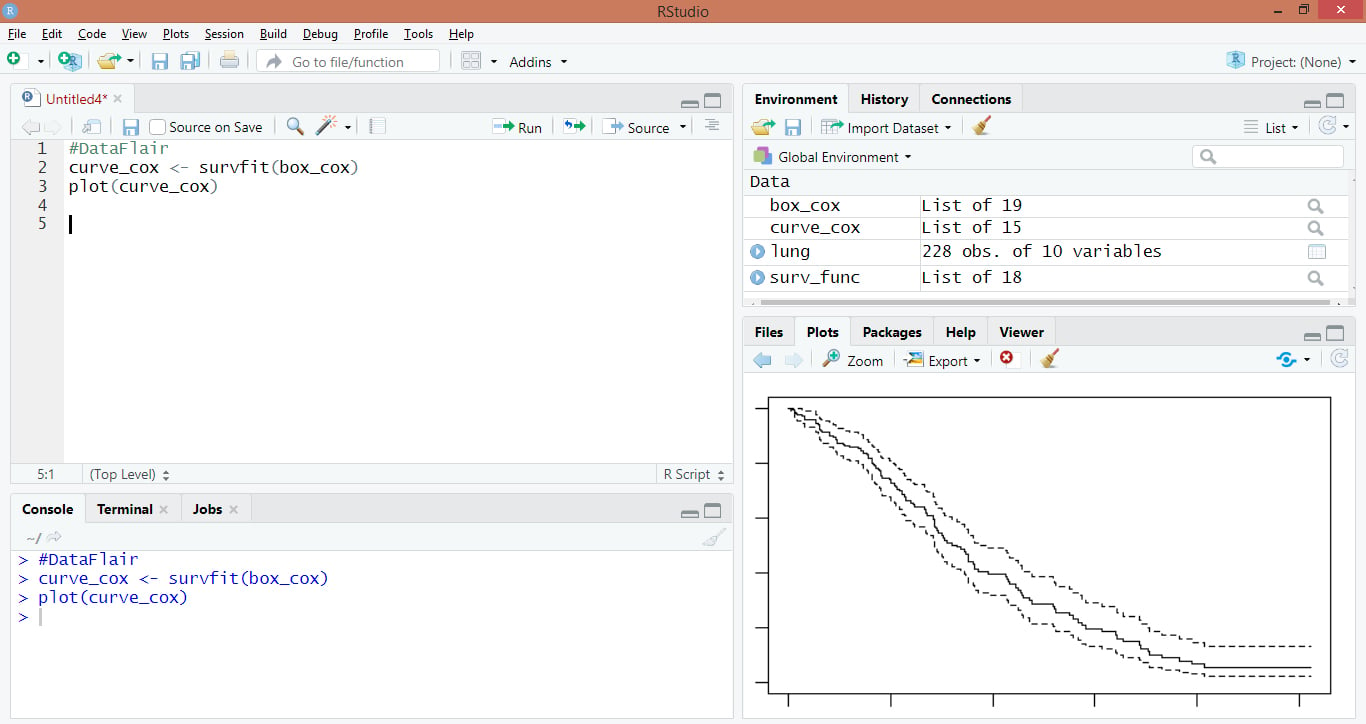
#DataFlair
curve_cox <- survfit(box_cox)
plot(curve_cox)
Output:
Summary
Here completes our tutorial of R survival analysis. We saw installing packages and types of survival analysis. Also, we discussed how to plot a survival plot using Kaplan Meier Analysis. Hope you understand the concept.
Still, if you have any doubts regarding the same, ask in the comment section. Now, what next? No need to think, DataFlair is here to help you. Check out the latest R tutorials series and select a topic of your choice that too for Free. What are you waiting for? Grab the opportunity now!!
Your opinion matters
Please write your valuable feedback about DataFlair on Google


Good work
Its a really great tutorial for survival analysis. I have query regarding the dataset, if dataset is split in training_set, validation_set and testing_set, could you please let me know how we can predict the result on validation_set (to check concordance index, R Square and if it is lower then how we can improve by using optimisation techniques. Can you please elaborate on this please?