Learn R Programming – Taking you closer to your Data Science dream
Job-ready Online Courses: Dive into Knowledge. Learn More!
This guide is for beginners and intermediate-level programmers alike. It will give you the knowledge necessary to be a skilled R programmer and data scientist. Instead of going through scattered resources and tutorials, we have this one-stop guide to being an R ninja. We advise you to go through this article and navigate from the links and resources provided to learn R concepts thoroughly. By following this DataFlair’s guide, you will be a master R programmer in no time.
Learn R Programming from Scratch
Here is the list of topics that we will cover in this R tutorial:
- What is R?
- Features of R
- Applications of R
- Use Cases of R
- R Career Opportunities
- R Installation
- Programming Constructs of R
- Advanced Concepts of R
- Object-Oriented Programming in R
- Data Visualization in R
- Machine Learning in R
- R Interview Questions
- Real-time Projects in R
What is R?
R is a programming language used for statistical computing and analysis. It was created by Ross Ihaka and Robert Gentleman in 1992 at the University of Auckland, New Zealand. The main goal behind the creation of R was to make a tool that was affordable, easy-to-learn and capable of handling complex mathematical and statistical calculations.
Today, R is one of the most popular programming languages used by data analysts and data scientists in the world. It is a programming language with one of the largest user bases. Even more exciting is the fact that it is completely free as R is an open-source programming language. R’s capabilities do not end at data analysis or statistics. It is useful for many disciples like data science, machine learning, data visualization, etc.
For more details regarding what is R, check out R Tutorial
Features of R
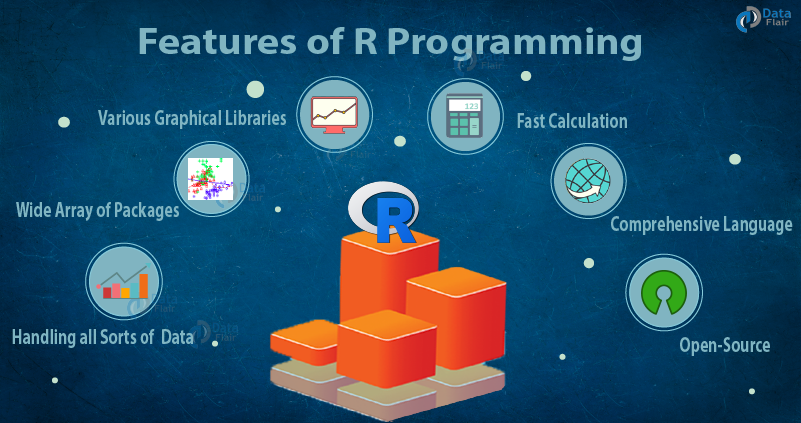
The R programming environment comes packed up to brim with exciting features. Let’s learn some of these features:
- Open-source: R is an open-source programming language. It is completely free for anybody to use.
- Variety of packages: There are more than 15,000 packages for R on online repositories like CRAN, Bioconductor, and GitHub.
- Powerful graphics: R’s graphical capabilities are amazing. It can produce publication-quality graphs and plots of any kind with its base package. With added packages like ggplot2 and plotly the possibilities are endless.
- No need for a compiler: The R language is interpreted. It does not need a compiler to convert the code into a program.
- Cross-platform support: R is cross-platform supportive that is it can run on any OS and in any software environment without any hassle.
Explore the complete list of R Features
Why Learn R?
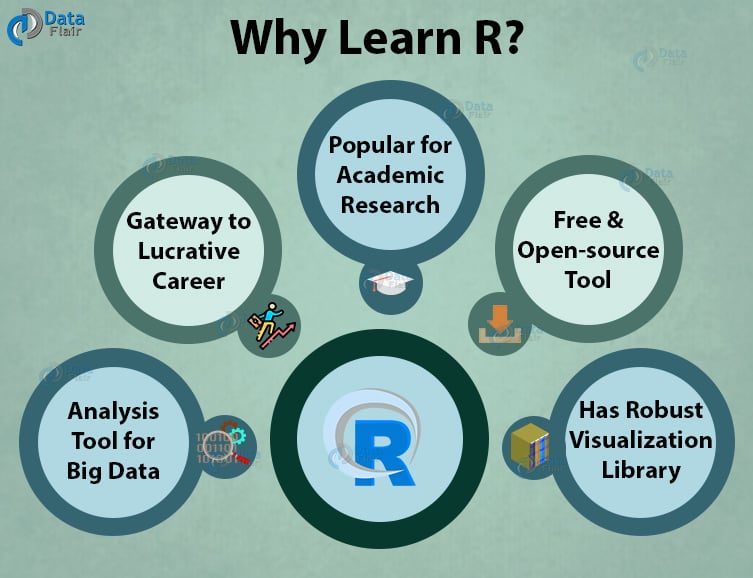
R is a very popular programming language and analysis tool. It is used by more than 2 million people around the globe. All of them have their own reasons to learn and use R:
- Useful as an analysis tool for big data.
- Most popular for academic research.
- Can visualize the results of data analysis.
- Useful for building machine learning models.
- It has a plethora of features that make it the preferred tool over many others for professionals and hobbyists alike.
- Open-source and, therefore, everybody can contribute to it in their own way.
- It has more than 15,000 packages that expand its powers.
- R can be useful for data analysis, data visualization, software development, web development, making attractive analysis reports and more.
Still not convinced? Explore more reasons to learn R
R Applications
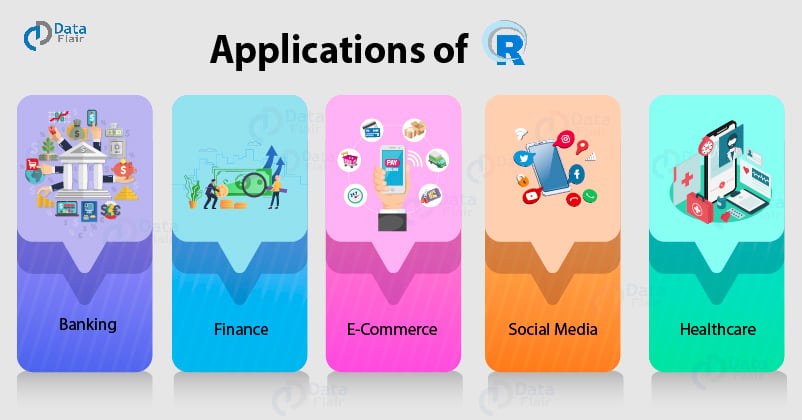
R is a very flexible programming language with a lot of varied applications. It is useful in some way or form in most industry sectors.
- Academics: R is a programming language created for statistical computing. It is widely used by students, professors, and researchers for developing statistical models and also for analyzing large results from studies and surveys.
- Healthcare: R is the most popular analysis tool used for pre-clinical drug trials. New medicines and medical procedures are tested using R. It is also used to analyze genetic sequences to identify genetic anomalies and to analyze various chemical compositions to identify their uses and side-effects.
- Finance: The finance sector deals with a lot of statistics. R is the most preferred technology for this purpose among them. They use it to identify and predict market trends. They also use it to calculate statistics like annual profits or loss, recovery models, etc.
- Banking: Bank uses R for risk modeling and mortgage rate calculation. They also use it for credit risk modeling.
- IT Sector: IT companies use R for business intelligence and to develop statistical computing software. They also use R to devise their business strategy.
- Manufacturing: Manufacturing companies use R to predict market demand. They alter their production according to the demand predictions. They also design their products according to sentiment analysis results of their customer reviews.
- Social Media: Social media companies use R for machine learning and sentiment analysis research. They analyze their users’ posts and activities to draw insights from it and try to improve their user experience according to the results.
That’s not it! There are many other Applications of R in different sectors
Use Cases of R
Now, in the R programming tutorial, we will learn about use cases of R in the real world:
- Cornell University: Cornell recommends their researchers and students to use R for all their research involving statistical computing.
- Microsoft: Microsoft uses R as a statistical engine within the Azure ML framework. They also use it for the Xbox matchmaking service.
- Bajaj Allianz Insurance: Bajaj Allianz uses R to make their upsell propensity models and recommendation engines. They also use it to mine data and generate actionable insights to improve customer experience.
- Amazon: Amazon uses R and data analysis to improve their cross-product suggestions.
- Facebook: Facebook uses R to update its social network graph and to predict colleague interactions.
- Bank of America: Bank of America uses R for financial reporting and to calculate financial losses.
- Ford Motor Company: Ford uses R for statistical analyses to support its business strategy and to analyze customer sentiment about its product which helps them in improving their future designs.
- The Food and Drug Administration: FDA uses R for drug evaluation and to perform pre-clinical trials. It also uses it to predict possible reactions and medical issues caused by various food products.
Career Opportunities in R
R is used in every sector of the industry. From academic research to business intelligence, from pre-clinical trials for pharmaceuticals to sentiment analysis for customer reviews, from analyzing genetic sequences to generating easy-to-read graphical reports for market analysis, R is a popular tool throughout the industry for a surprisingly wide number of applications. There are more than 3 million job openings for R programmers all around the world. Learning R can lead to a lucrative career. A good professional R programmer with experience 0-4 years can earn anywhere between ₹7,00,000 and ₹15,00,000 PA.
Take your career to new heights with 100+ Free R Tutorials
Job Roles
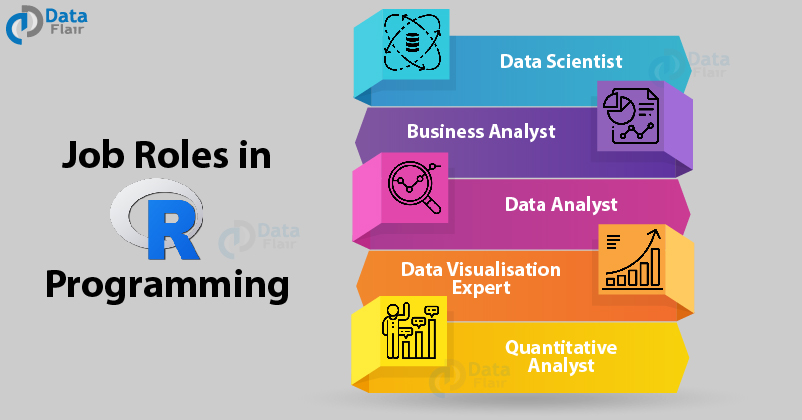
There is a high demand for people with R programming skills for many different job profiles. A person with decent R programming skills can earn upwards of ₹15,00,000 per year. Companies hire R programmers for different posts. Some of them are:
- Data Scientist (Average salary – ₹26,20,000)
- Data Analyst (Average salary – ₹5,80,000)
- Business Analyst (Average salary – ₹4,90,000)
- Business Intelligence Expert (Average salary – ₹8,80,000)
- Data Visualization Expert (Average salary – ₹7,20,000)
- Quantitative analyst (Average salary – ₹6,40,000)
NOTE: The above-mentioned salary range has been collected from various job portals and surveys, it could vary based on the experience and skill set.
Future Scope
While there may be more than enough requirement for R programmers out there today, will there be enough demand for them five years down the road? What about ten years? One of the biggest reasons for R’s popularity in the industry is its flexibility and variety in applications. Data Science has wormed its way into every industry today and it is here to stay. As one of the most popular programming languages for data science, R’s relevance in the future is confirmed. Its popularity is still increasing and with it, the increase in innovation is also steady.
Have a look at the lucrative Career Opportunities in R Programming
Install R
Let us now start our journey towards being a master R programmer. The first step is to install R and an IDE for it. R is a cross-platform supportive programming language. You can use it on any OS without any changes or compatibility issues. You can also integrate it with many different programming languages and software frameworks like C, C++, FORTRAN, Java, Python, or Hadoop.
Here is our step-by-step guide to install R for Windows, Linux, and Mac OS.
Basic R Programming Concepts to Learn
Moving on in the R tutorial for beginners, let’s learn about the basic concepts of the R programming language:
R Data Types
R has five basic data types. These are:
- Numeric
- Integers
- Character
- Logical
- Complex
- Data structures
Practical: Implement Data Types in R
R Data Structures
R has many different data structures that provide specialized properties for different types of data.
These are the basic data structures of R:
- Vectors
- Matrix
- Arrays
- Data-frames
- Factors
- Conditional and loops
Practical: Work on Data Structures in R
R Control Structures
R has a few control structures that control the flow of an R program. They provide R with conditional reasoning and iterative processing. These control structures are:
- If-else statements
- ifelse() function
- Switch
- For loops
- While loops
- Break statement
- Next statement
- Repeat loops
Practical: Examples of Control Structures in R
R Functions
You can create functions in R by using the function keyword. Functions are small sequences of code with a definite, pre-defined purpose. They input as arguments and return an output. There are four components of a function, these are:
- Function name
- Arguments
- Function body
- Return statement
Practical: Use Built-in R Functions to solve real-world problems
Advanced Concepts in R that You Must Learn
Here are a few other topics that you should definitely know about as an R programmer:
- Principal Component Analysis
The principal component analysis is a technique used when there are too many variables that affect the required analysis. Using principal component analysis, you can reduce the number of variables without affecting the information conveyed by the original variables.
- Factor Analysis
The factor analysis is another such multivariate analysis technique that reduces the number of variables that need processing to make the analysis and calculation easier.
Practical: Implement Principal Components & Factor Analysis in R
- Bootstrapping

Bootstrapping is a statistical method that takes small samples of the given dataset and performs the required analysis on the samples. It is then used to make predictions about the entire data based on the results produced by the samples.
Practical: Learn R Bootstrapping with Use Cases
- Graphical Models
Graphical models are the different techniques used to visualize data in graphical formats.
Practical: Understand R Graphical Models
- Debugging Functions
R has many functions that help in debugging R code and programs. It also has packages that help in the same.
Practical: Debug R Code
- Bar Charts
Bar charts in R are an important way of presenting data graphically in an easier-to-understand format.
Practical: Visualize R Bar Charts & Histograms
- Lattice Package
Lattice package is a very popular and powerful graphics package in R programming.
Practical: Work on R Lattice Package
- Performance Tuning
Performance tuning deals with efficient coding practices. It also includes habits and acts to avoid to degrade the performance of your R programs.
Practical: Fine Tune R Setup to get optimum performance
- Hypothesis Testing
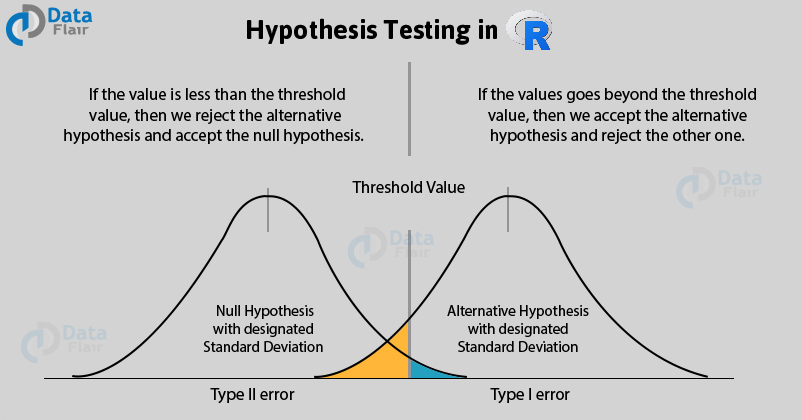
Hypothesis testing is the process of validating an assumption made about data. We use random samples of data to test the hypothesis against and judge its validity based on the results.
Practical: Learn Hypothesis Testing with Use Cases
- Linear Regression
Linear regression analysis is the technique to find and determine linear relations between two or more variables.
Practical: Build a Linear Regression Model in R to solve real-time problems
- Non-linear Regression
The non-linear analysis is the technique to find non-linear relationships between independent variables.
Practical: Implement Non-Linear Regression in R
- Logistic Regression
Logistic regression analysis is a type of non-linear analysis that deals with categorical data.
Practical: Work on R Logistic Regression in Real-time Use Case
- Decision Trees

Decision trees are a machine learning algorithm. Decision trees in R is a popular data mining technique that uses a tree-like structure to simulate the consequences of various decisions.
Practical: Build R Decision Trees
- Random Forest
Random forest in Ruses multiple decision trees to emulate decision making in complex situations with multiple variables.
Practical: Develop Random Forest in R
- Clustering
Clustering partitions data into multiple groups based on similarity.
Practical: Work on Clustering in R
- Classification
Classification is used to categorize data based on certain characteristics.
Practical: Build Classification Model in R
- SVM Training
SVM or a Support Vector Machine studies the current data and its characteristics and learns from it to classify future examples.
Practical: Work on SVM Model in R
- Testing Models
There are various testing models to test machine learning algorithms. The R package e1071 can be very useful for this.
- Bayesian Networks
Bayesian networks model variables and their relationships. They are useful to answer probabilistic queries.
Practical: Understand R Bayesian Network
- Bayesian Inference
Using a Bayesian network to draw insights about the data is called bayesian network inferencing.
Practical: Learn Bayesian Network Inferencing
- Normal Distribution
The Normal distribution is a probability distribution that is symmetric about the mean of the data.
Practical: Understand Normal Distribution with Case Study
- Poisson Distribution
The Poisson distribution shows how many times an event is likely to occur in a given period of time.
- Binomial Distribution
Binomial distribution is a discrete distribution used in statistics.
Practical: Understand R Binomial & Poisson Distribution
- Predictive Analysis
Predictive analysis is the technique of analyzing the current data or its sample to make predictions about a larger data.
Practical: Develop Predictive Analytics Model
- Survival Analysis
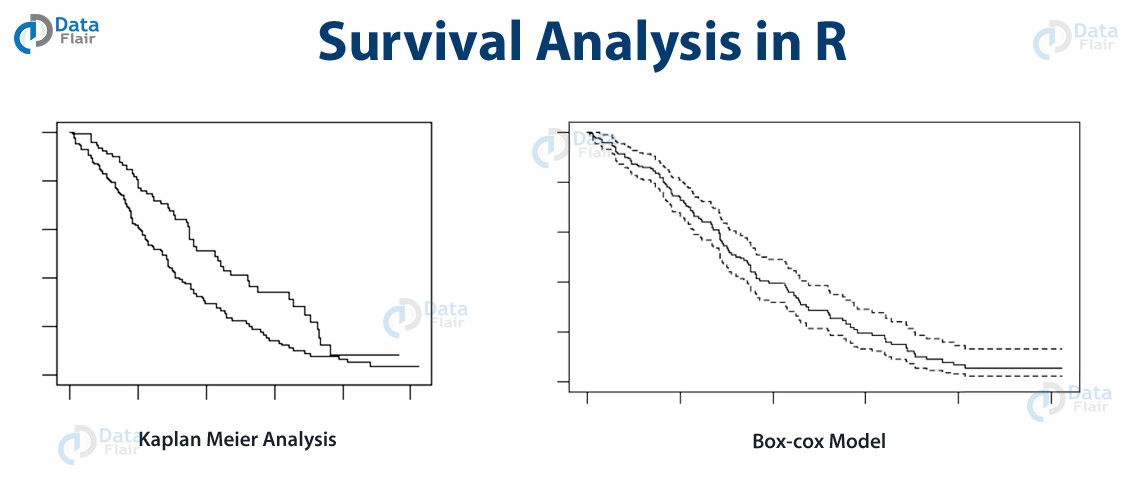
Survival analysis is a predictive statistical technique that is useful to predict the time at which an event will occur.
Practical: Predict the future outcome with Survival Analysis in R
- Chi-square Test
The chi-square test determines the correlation between the two variables.
Practical: Chi-square Test with Examples
- T-test
T-tests are useful to determine the equality of the means of two data groups.
Practical: Perform T-tests in R
- ANOVA Algorithm
ANOVA is a statistical algorithm that measures the difference between the means of two groups.
Practical: Implement R ANOVA Test
Packages in R
One of R’s most enticing features is its massive package collection. You can find R packages on online repositories like GitHub and Bioconductor. CRAN or the Comprehensive R Archive Network is the largest online repository for R packages and is maintained by the R development team.
Here is a list of useful and recommended packages in R:
- Tinyverse
- Ggplot
- Ggraphs
- Dygraphs
- Leaflet
- Shiny
- R markdown
- Ggmap
- Glue
- Plotly
- Reshape
- Stringr
- Digest
- Dichromat
- MLR
- Caret
- MASS
- Randomforest
- Sentimentr
- e1071
Practical: Make your hands dirty with R Packages
Data Reshaping in R
Data reshaping is the first step in any data analysis. It is the process of cleaning and formatting the data to make it uniform and easy-to-analyze. R provides many useful functions like the cbind(), rbind() and t() functions. It also has packages like tidyr, reshape and reshape2 that are extremely helpful for this purpose.
Practical: Reshape the data for further processing
Object-Oriented Programming in R
R programming is functional in nature by default i.e. an R program is a collection of various functions that are called when needed. Despite this, R has different object models to facilitate object-oriented programming as well. R’s base package has three of these object models known as S3, S4, and R5. There are other object models like the R6 system that can be used through additional R packages. A program using one of these object models acts as a collection of objects that interact with each other.
Practical: Examples of Object-Oriented Programming in R
Useful Functions in R
R provides many useful functions by default. The R functions are categorized based on what type of objects or structures they operate on and what they do:
1. Input and Output Features in R
R Input and output functions either request and get input from the user or display output to the screen. For example – scan(), readline(), etc or print() and cat().
Practical: Read/write the Input/Output Functions in R
2. R String Manipulation
R string manipulation functions take strings as inputs or return strings as output. They can manipulate strings in various ways like splitting them into substrings, concatenating them into a single string or changing a string in the desired way.
They can also provide more information on string objects. For example – substr(), cat(), grep(), nchar(), etc.
Practical: Manipulate string with in-built functions in R
3. R Data Manipulation
R data manipulation functions can manipulate data in various ways. They take large or small data objects as arguments and change or edit them in the required way. For example – the sample() function takes a random sample of specified size from the given dataset and, the duplicate() function creates a duplicate of the given data with certain modifications if required, etc.
Practical: Work on Data Manipulation in R
4. Descriptive Statistics in R
Descriptive statistics functions are useful for descriptive statistics that is they describe the given data. They provide further insights into the data and highlight patterns. Eg: summary(), name(), apply(), simple complex(), etc.
Practical: Implement Descriptive Statistics with Examples
5. Contingency Tables in R
Contingency tables are useful when condensing large complex data into smaller tables. We use the table() function to create and manipulate them.
Practical: Create Contingency Tables in R
6. Generalized Linear Models in R
R has simple functions that are useful for creating linear models and non-linear regression models. The glm() function is the easiest way to create logistic regression or Poisson regression models.
Practical: Build Generalized Linear Models in R
Data Visualization in R
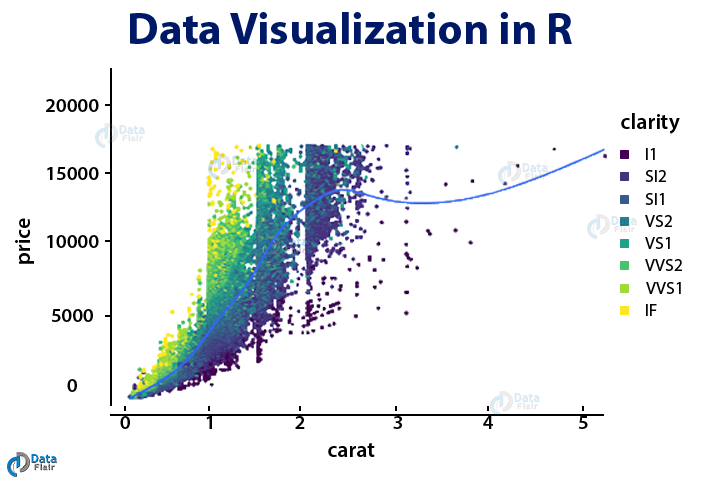
Data visualization is R’s strongest aspect. Other tools used for data analysis do not come anywhere close to R when it comes to data visualization. R can make publication-quality graphs and plots with single commands. Any kind of graphical representation is possible. The base package in R is powerful enough but it also has other packages like ggplot2 and plotly that make it, even more, easier and increase the number of possibilities to endless.
Practical: Visualize the Data in R
R for Data Science
R provides an intuitive environment for analyzing, processing, transforming and visualizing information. It is great for complex calculations and statistical modeling. It has several tools to churn raw data. All this makes it the perfect tool for data science. R programming can facilitate every step of data analysis like data cleaning, data analysis, data modeling, and data visualization. You can interface R programs with databases to enable data extraction as well. It also provides you with other options for advanced data analytics like image processing and prediction models.
Must Learn – How R acts as weapon for data scientists
Machine Learning for R
R provides many different packages for machine learning to its users. There are packages that can implement single machine learning models as well as ones that can facilitate complete machine learning suites. Some of these packages are:
- MICE: Multivariate imputation by Chained Sequences.
rpart: The rpart package is useful for partitioning and repetitive machine learning models like decision trees and classifications. - randomforest: The randomforest package helps in implementing the random forest algorithm which is the most popular machine learning algorithm.
- MLR: The MLR package stands for Machine Learning in R and is a complete machine learning package for R.
Check out all the essential Machine Learning Tools for R
Real-time Projects in R
Developing a project is a good way of evaluating, increasing and solidifying your skills in R. It provides a hands-on experience that no amount of theoretical studying and tutorials can give you. You should start small with a simple descriptive analysis of a dataset.
After that, you can move on to complete visualization of the analysis using different packages.
For advanced project ideas, you can take a look at the following:
1. Sentiment Analysis using R
In sentiment analysis, you process natural language sentences to extract opinions or emotions from them.
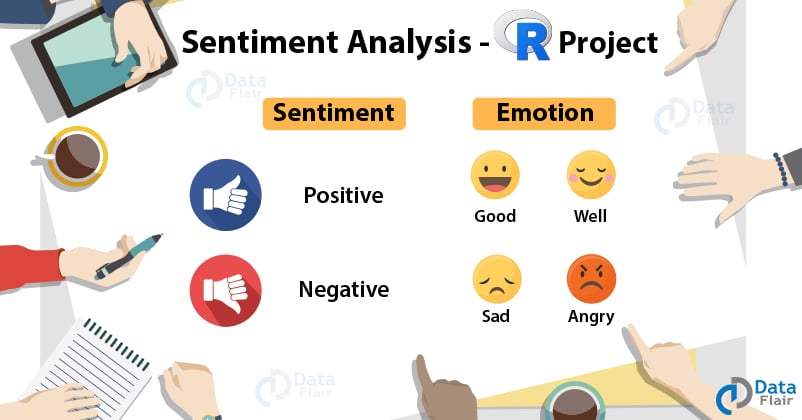
Source Code: Data Science Project of Sentiment Analysis
2. Uber Data Analysis using R
This project is the analysis of the data of uber rides in new-york in the year of 2014.
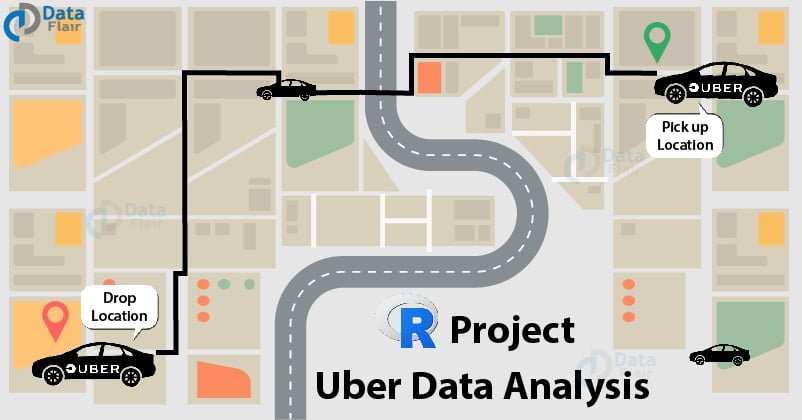
Source Code: Uber Data Analysis Project in R
3. Movie Recommendation System using R
This project uses the recommended lab package to recommend movies based on their user ratings.
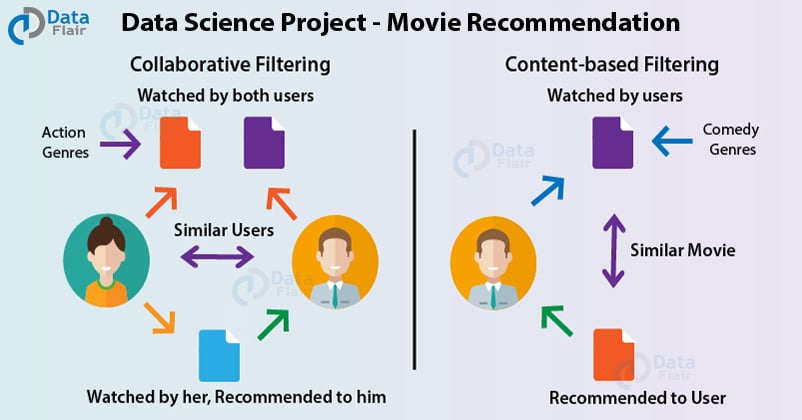
Source Code: Data Science Movie Recommendation Project
4. Credit Card Fraud Detection System using R
This project processes a credit card transaction dataset to identify anomalies.
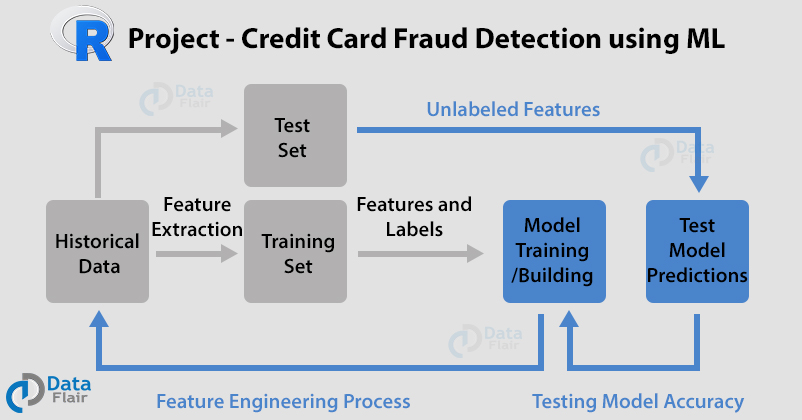
Source Code: Credit Card Fraud Detection Machine Learning Project
5. Customer Segmentation using R
Customer segmentation is the process of using clustering algorithms to classify customers in different groups. This is done in an effort to identify relevant customer base. This is an example of unsupervised learning.
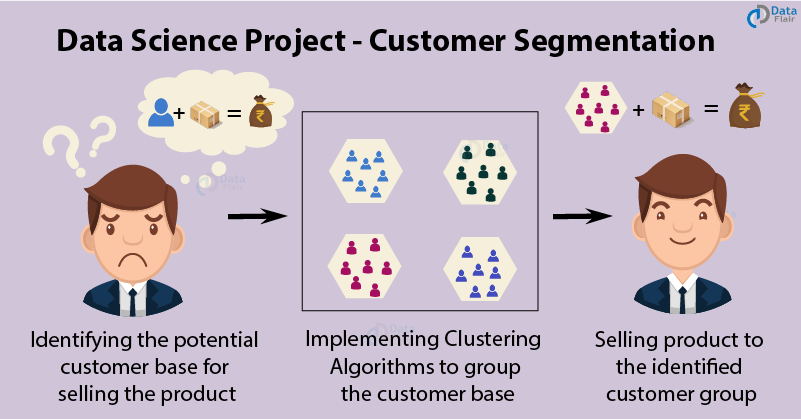
Source Code: Customer Segmentation with Machine Learning Project
List of R Books
Here is a list of must-read books to learn R programming:
- Hands-on Programming with R – Garrett Grolemund
- R for Data Science – Hadley Wickham & Garrett Grolemund
- The art of R Programming – Norman Matloff
- Learning Rstudio for R Statistical Computing – Mark P.J.van der Loo & Edwin de Jonge
- Practical Data Science with R – Nina Zumel & John Mount
- R for Everyone: Advanced Analytics and Graphics – Jared P. Lander
There are more such interesting books. For their names & descriptions, check the complete article on Top R Books
R Programming Interview Questions
Studying a programming language is different from cracking an exam or an interview about it. Worry not! As DataFlair has prepared a comprehensive list of commonly asked interview questions for jobs for R programmers. We have classified them based on the level of their difficulties. Here they are:
- Beginner level R Interview Questions
- Intermediate level R Interview Questions
- Advanced level R Interview Questions
Summary
Here we come to the end of DataFlair’s complete guide for R. We advise you to follow the material provided in this guide and to learn all the R topics thoroughly. The interview questions will help you to crack any R interview. With this guide, a glamorous career as an R programmer is sure to be in your future.
Did you know we work 24x7 to provide you best tutorials
Please encourage us - write a review on Google


Verrrrryyyy nice article 🙂
Thanks for writing this blog, this gives deep learning of R programming, how it can be used in Data Science, and its functions of analyzing, processing, transforming, and visualizing. R programming is the best in analyzing data, and so it is required most by data science. Data science helps industries to analyze the future using its tools and programs. To know more about data science and learn this valuable course visit Learnbay.co