R Data Reshaping – 4 Major Functions to Organise your Data!
Expert-led Online Courses: Elevate Your Skills, Get ready for Future - Enroll Now!
In this tutorial, we will discuss about data reshaping in R. We will also cover data frame concepts as data reshaping is totally dependent on a data frame in R. Along with this, we will also learn different properties of a data frame which will help you out in understanding these concepts.
Introduction to R Data Reshaping
R data reshaping is all about changing the way in which data is organized into rows and columns. Most of the time data processing in R is done by taking the input data as a data frame. Also, extracting data from the rows and columns of a data frame is an easy task but there are situations when we need the data frame in a format that is different from the format in which we received it. In R, it has many functions to split, merge and change the rows to columns in a data frame.
Why Reshape R Package?
For analytic functions, the data obtained as a result of an experiment or study is generally different. Usually, the data from a study has one or more columns that can identify a row followed by a number of columns that represent the values measured. The columns that identify the row can be thought of as a composite key of a database column.
To understand this concept of reshaping data R, knowledge of the matrix is very necessary. So, here is the R Matrix tutorial for you.
Joining Columns and Rows in a Data Frame
We use vectors to create a data frame using the cbind()function.
1. cbind()
We use cbind() function to combine vector, matrix or data frame by columns.
cbind(x1,x2,…)
x1,x2: vector, matrix, data frames
2. rbind()
We use rbind() function to combine vector, matrix or data frame by rows.
rbind(x1,x2,…)
x1,x2: vector, matrix, data frames
You must have a look at R Vector Operations
3. melt()
We use melt() function in R to convert an object into a molten data frame. It takes input in the form of a wide format and stacks multiple columns into a single column of the data. The melt() function has the following attributes –
melt(data, …, na.rm = FALSE, value.name = “value”)
- data – The input data that is to be melted.
- …. – Arguments that are passed to or from.
- na.rm – Used for converting explicit missings into implicit missings.
- value.name – Used for storing values in variables.
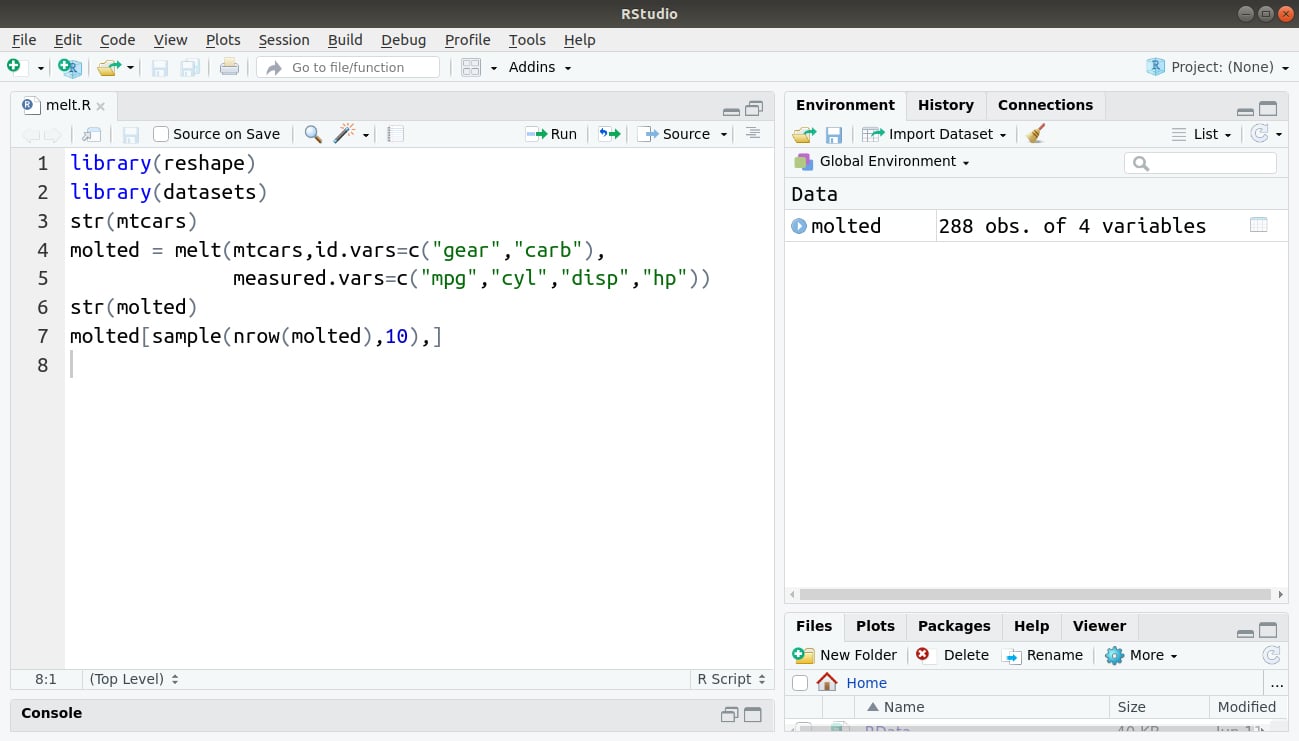
In the following example, make use of the mtcars data and apply melt() function to the id variables – ‘gears’ and ‘carbs’ and the measured variables – ‘mpg’, ‘cyl’, ‘disp’, ‘hp’. We use this melt function to melt the mtcars data frame.
library(reshape)
library(datasets)
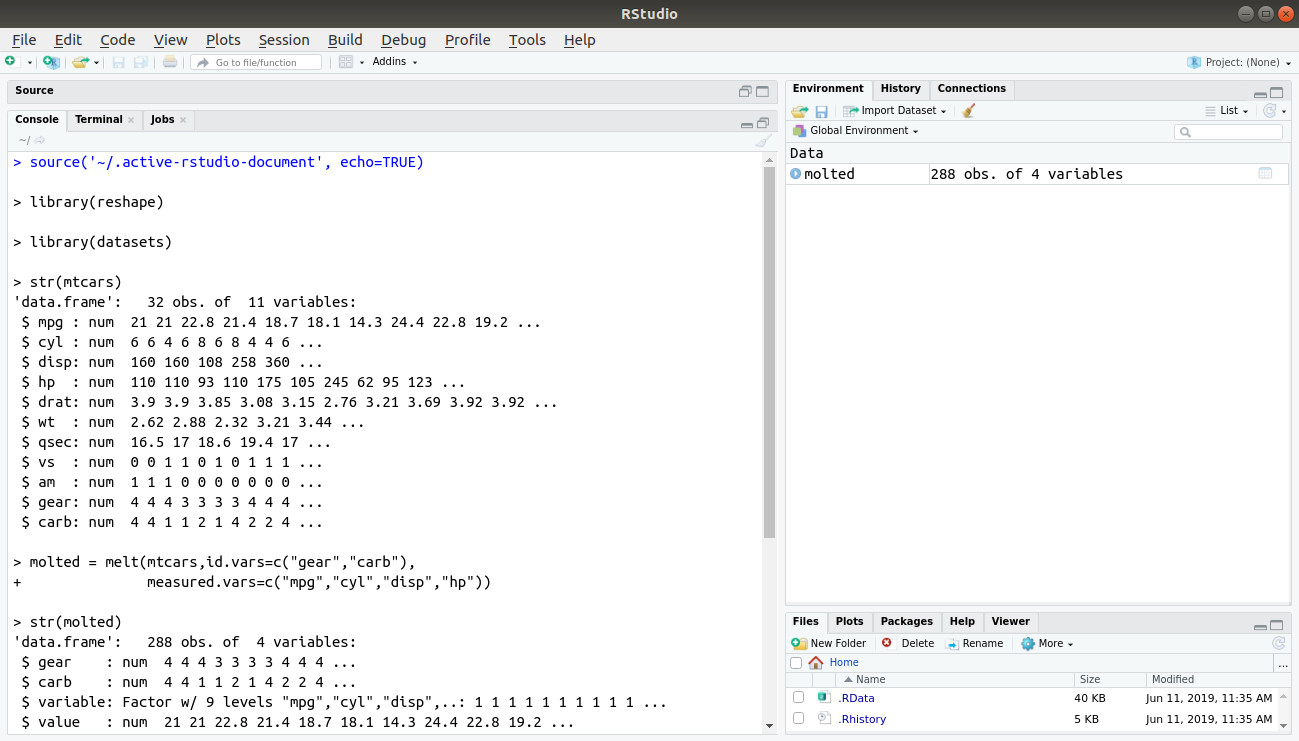
str(mtcars)
molted = melt(mtcars,id.vars=c("gear","carb"),measured.vars=c("mpg","cyl","disp","hp"))
str(molted)
molted[sample(nrow(molted),10),]Code Display:
Output:
Take a deep dive into R Data Frame Operations
4. dcast()
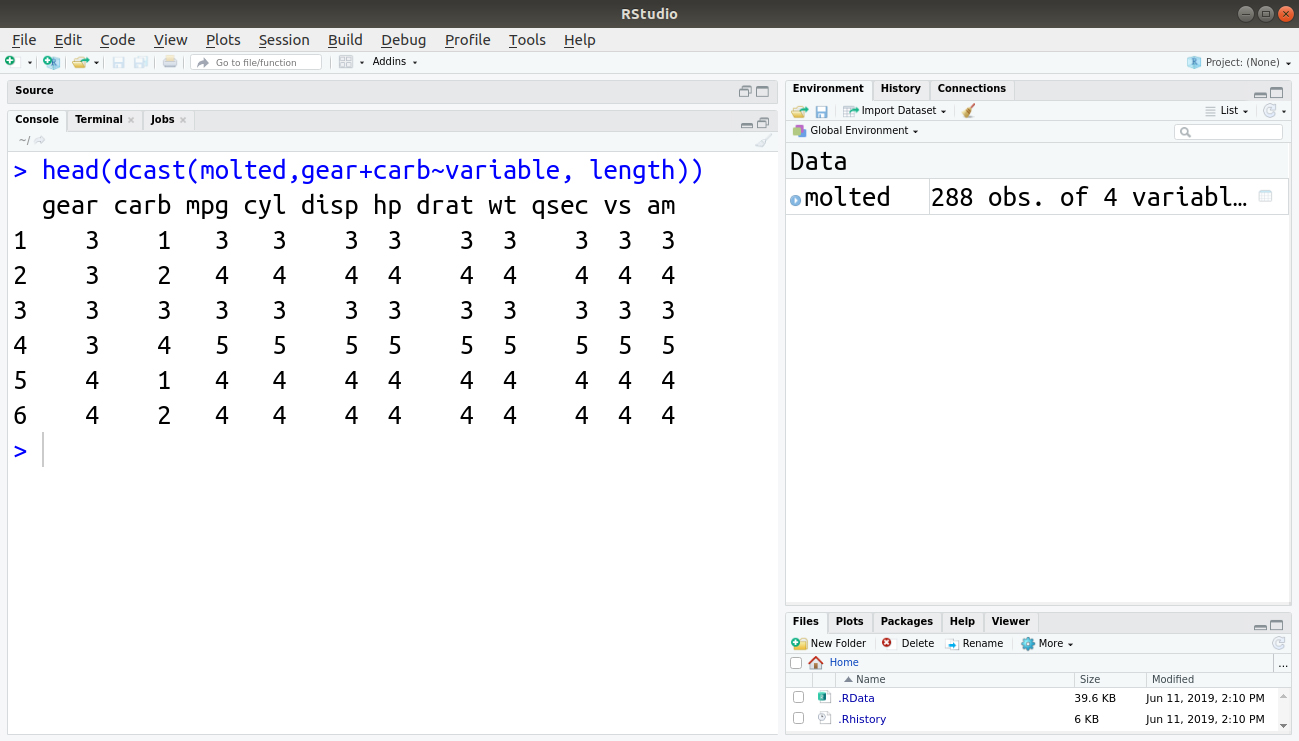
Once you have a molten dataset with you, it is ready to be cast or reshaped. We will construct the original dataset using the dcast() function. The dcast() function:
head(dcast(molted,gear+carb~variable, length))
Output:
There are three arguments in dcast():
- data – The data attribute taken in the molten data frame.
- formula – The formula specifies how the data is to be cast. The formula is present in the form of x_variable ~ y_variable, but there can be multiple variables present.
- fun.aggregate – We use this function if there is data aggregation due to implementation of the casting formula. (example – length(), mean() and sum() ).
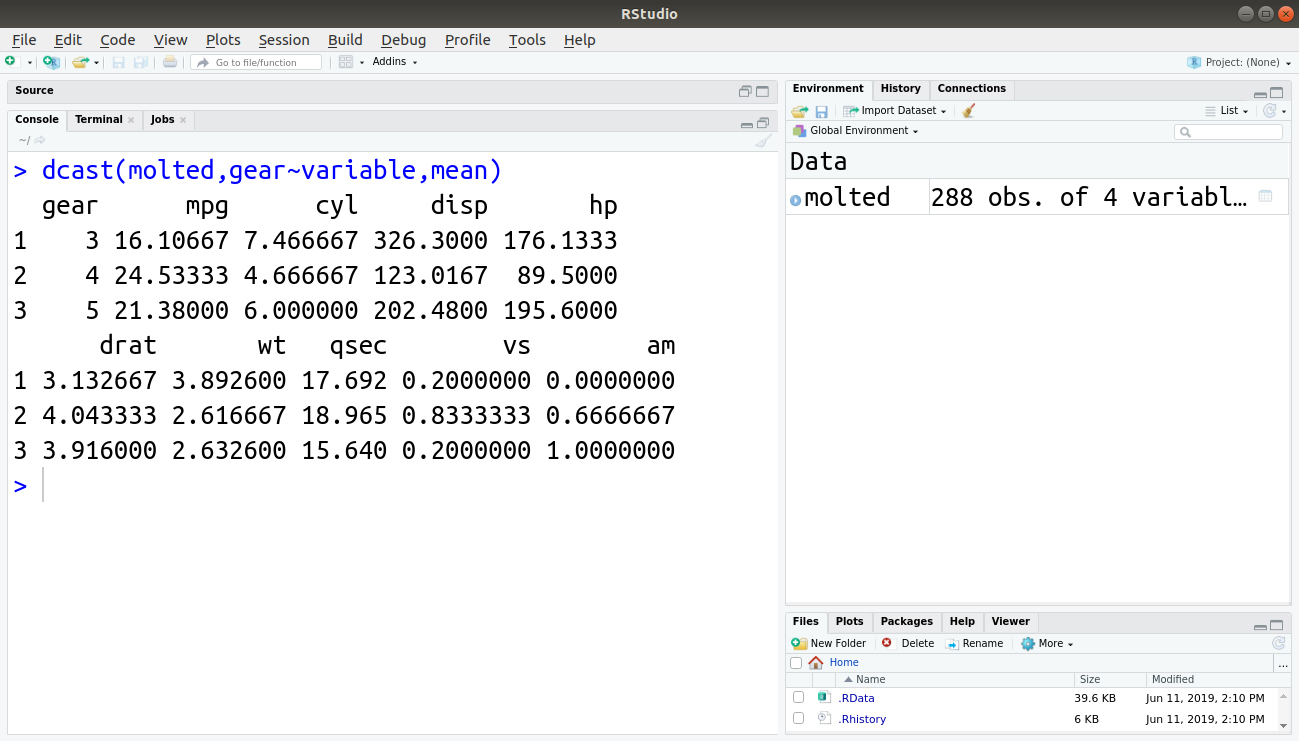
What if we use only one of the variables gear or carb in dcast()?
dcast(molted,gear~variable,mean)
Output:
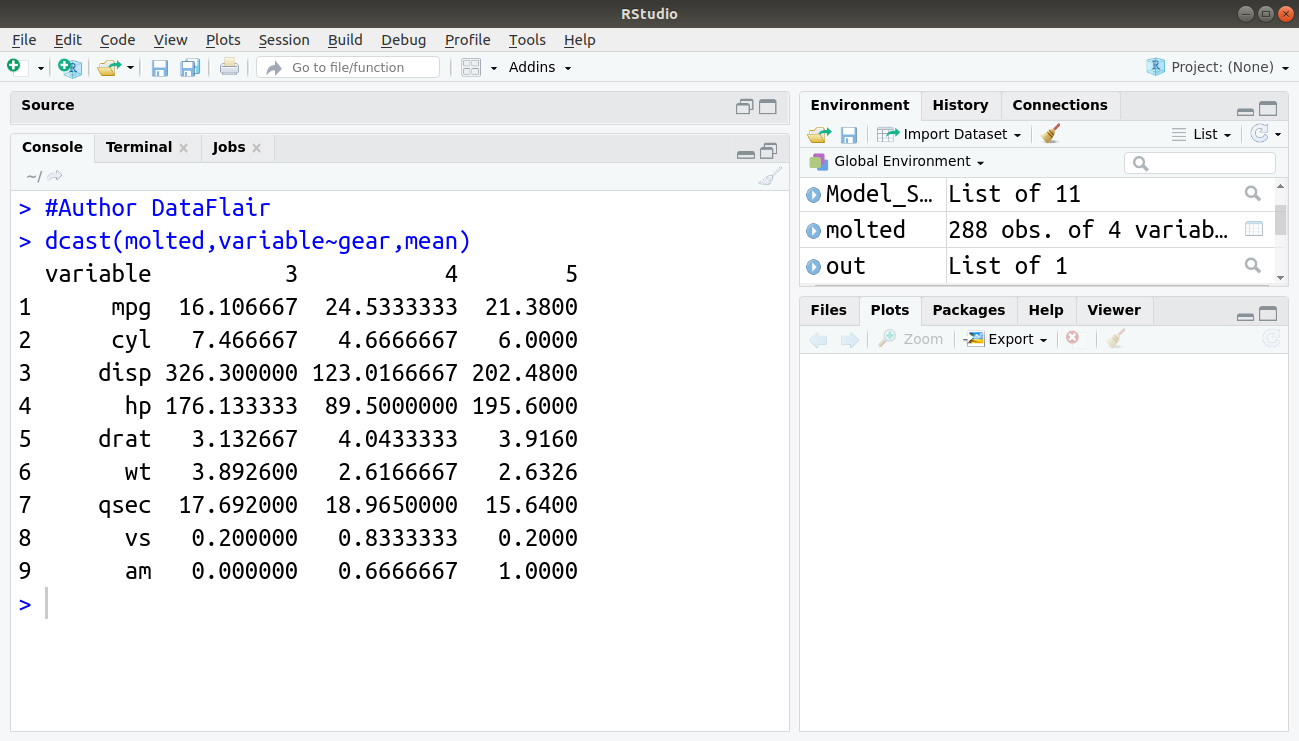
We can also perform a transpose operation on this as follows:
> dcast(molted,variable~gear,mean) #Author DataFlair
Output:
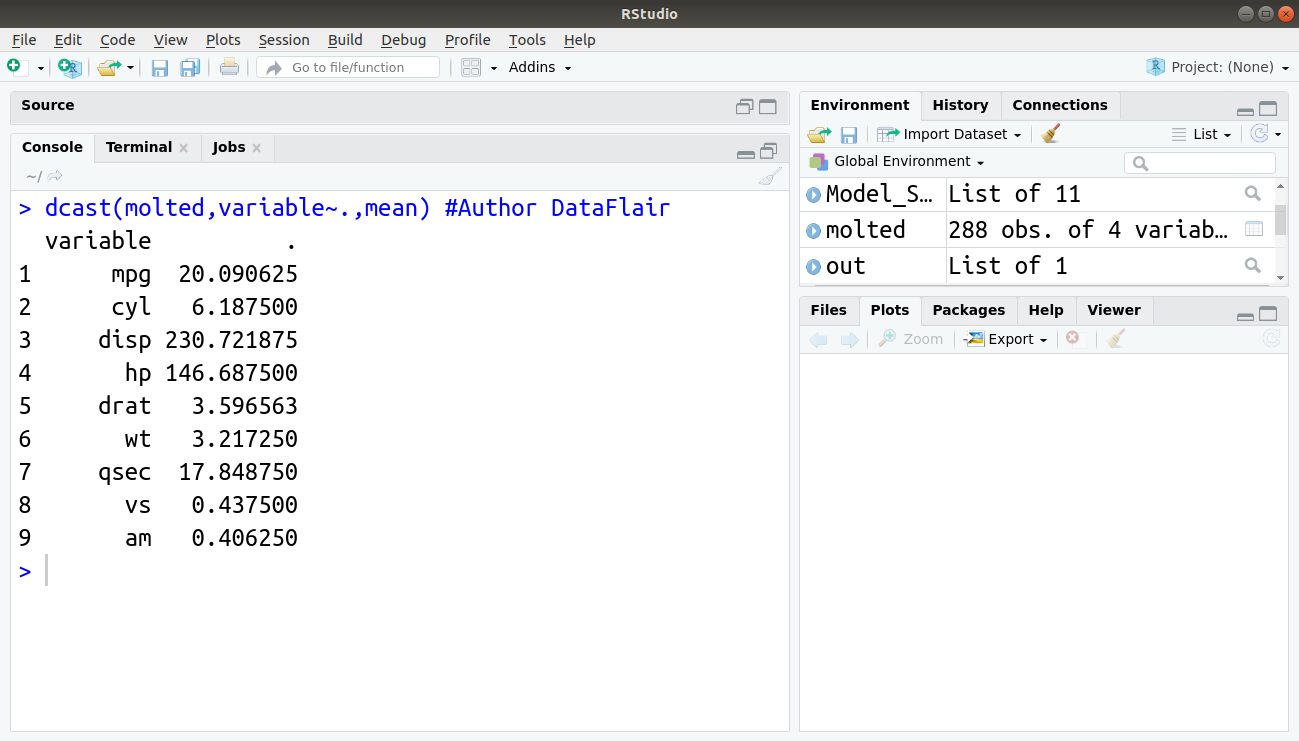
We can also avail . (dot) which does not signify any variable:
> dcast(molted,variable~.,mean) #Author DataFlair
Output:
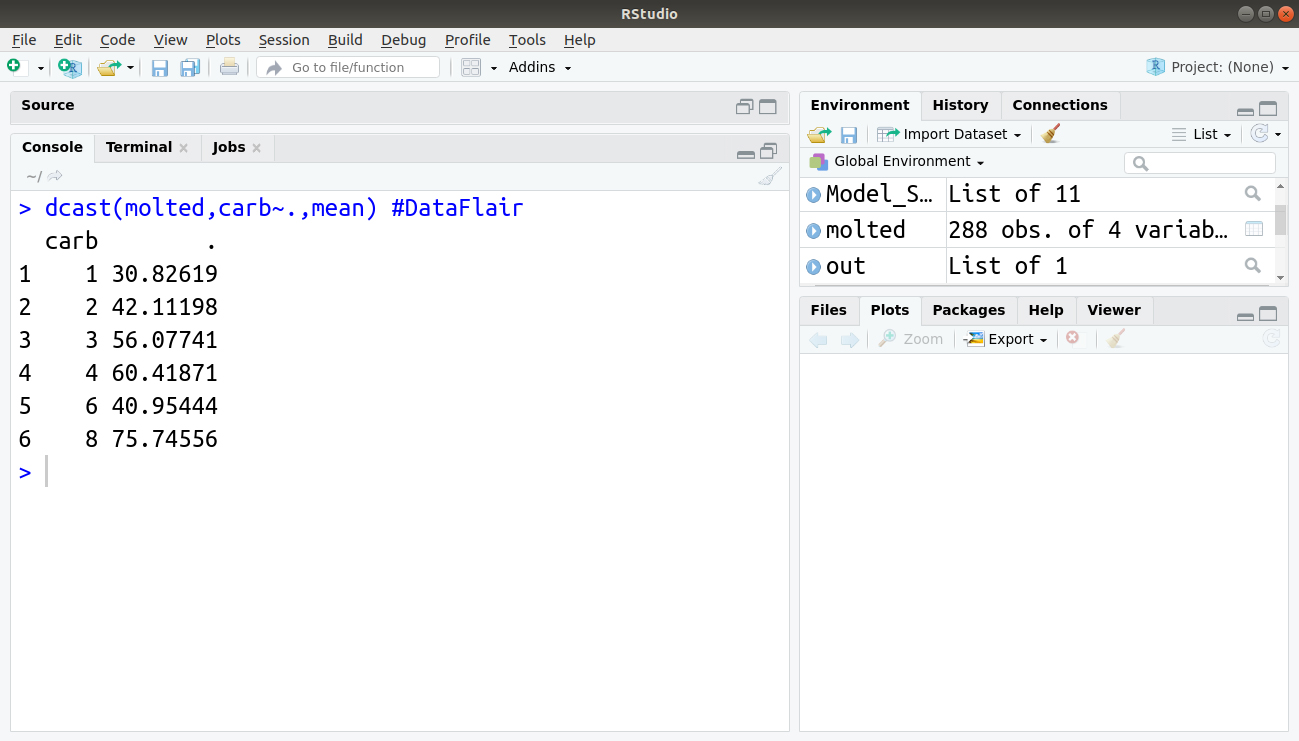
We can also perform:
> dcast(molted,carb~.,mean) #DataFlair
Output:
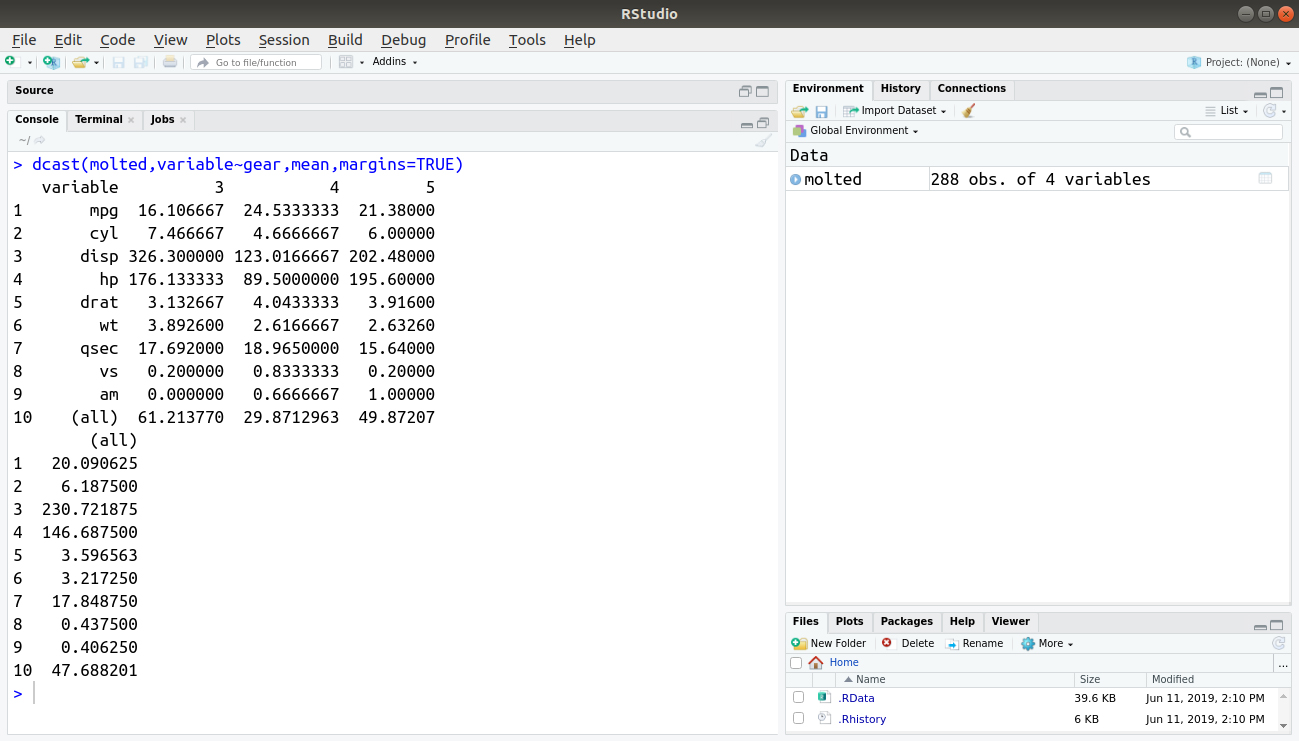
Margins, that are known as column totals can be created by specifying an attribute ‘margin’ and setting it to TRUE.
dcast(molted,variable~gear,mean,margins=TRUE)
Output:
Merging Data Frames in R
In order to combine the two data frames in R, we make use of the merge() function. The data frames must have the same column names on which the merging happens.
Adding Columns
To merge two data frames (datasets) horizontally, we use the merge function. Mostly, we use it to join two data frames by one or more common key variables (i.e., an inner join).
# merge two data frames by ID
total <- merge(data frameA,data frameB,by=”ID”)
# merge two data frames by ID and Country
total <- merge(data frameA,data frameB,by=c(“ID”,”Country”)) .
This was all in the R Data Reshape tutorial. Hope you liked the article.
Summary
We have studied how to reshape data in R in a detailed manner. We have also learned about the data frame and its properties. Data frame helps you in every single concept of data reshaping as they are linked to data frame only.
Next up in our R programming DataFlair tutorial series – Object Oriented Programming (OOP ) in R
If you have any questions regarding the R data reshaping, leave the comment below. We’ll answer it and help you out. Thank you for reading😀
Did you know we work 24x7 to provide you best tutorials
Please encourage us - write a review on Google


