R Data Science Interview Questions based on top projects
Interactive Online Courses: Elevate Skills & Succeed Enroll Now!
This is the third and final part of R data science interview questions and answers series, specially designed at the expert level. Why this is an expert level? The answer is it contains project-related interview questions on R and Data Science which you should not miss.
Let’s have a look at the R interview questions and answers series –
- R Language Interview Questions and Answers for Freshers
- R Language Interview Questions and Answers for Intermediate Level
- R Language Interview Questions and Answers for Experienced
To crack Data Science Interview is not a cakewalk and requires in-depth expertise in various topics. Furthermore, the projects you have worked on can attract a lot of interviews. In order to be well versed with your project, we have compiled a set of sample questions for you to relate with. Since data science is a vast field, there is no boundary or limitation to the set of questions that can be inquired. DataFlair recommends you to bookmark this article of top R Data Science Projects for better performance in your interview.
Project-Based R Data Science Interview Questions
Let’s start R data science interview questions and answers based on our first project – Movie Recommendation System Project
1. Recommendation Engine Project
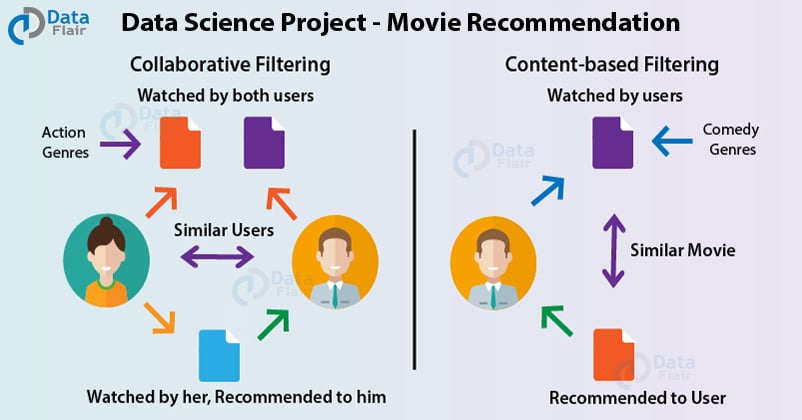
Q.1 What are content-based and collaborative filtering systems?
Ans.
Content-Based Filtering – In a content-based filtering recommendation system, the user is given recommendations based on past preferences and likes. For example, on Amazon, based on the previous purchases, you are provided new recommendations.
Collaborative Filtering – In this form of recommendation system, the suggestions are provided to one user based on the preferences and likes of another user. For example, if on Netflix, if user A and user B like action films and user A also likes thriller genre, then user B is provided recommendations of thriller films as well.
Q.2 What methods are used for measuring the similarity?
Ans. Some of the methods that are used for measuring word similarity are –
- Cosine Similarity
- Euclidean Distance
- Pearson’s Coefficient
- Jaccard Similarity
Q.3 What evaluation metrics are used in recommendation systems?
Ans. Some of the important evaluation metrics that are used in recommendation systems are –
- Recall
- Precision
- Normalized Discounted Cumulative Gain (NDCG)
- Mean Reciprocal Rank
- RMSE
Q.4 How can Item2Vec be used in recommendation systems?
Ans. Item2Vec is basically Word2Vec for recommendation systems. The Item2Vec approach does not involve the users directly, and does not consider them while making recommendations. It is a useful procedure if the goal is to provide alternate recommendations based on their historical purchases or reviews.
Q.5 What algorithms can be used for designing recommendation system?
Ans. Association Rule Mining, KNN, Matrix Factorization, and Artificial Neural Networks can be used for designing recommendation systems.
2. Customer Segmentation Project
Here comes our second project, that is customer segmentation using R. You can practice this project here – Customer Segmentation project in R
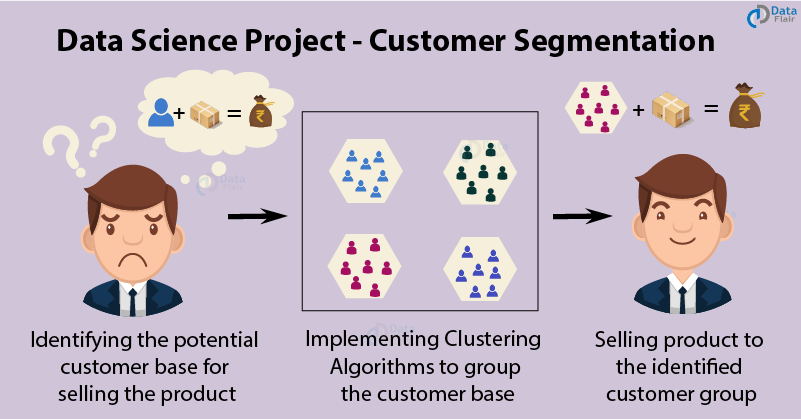
Q.1 What type of Machine Learning classifier did you utilize in this project? Also, state the reason why.
Ans. In this type of Machine Learning project, we utilized unsupervised learning algorithm. The key reason for this was the nature of our dataset. Since the data contained within had unlabeled features, we sought the usage of an unsupervised learning algorithm like K-means.
Q.2 What are some of the key stats that you derived about the customers through data analysis?
Ans. Some of the key stats that we derived from the project are as follows –
- The number of female customers are much higher than male counterparts
- The most frequently purchasing age group is between 30-35. Whereas, the age group of 60-65 constitute the least part of the customer segment.
- Majority of customers lie in the income group of 70-80 units. The average salary of all the customers is 60.56 units.
- The customers between class 40 and 50 have the highest spending score among all the classes.
Q.3 What algorithm did you use for performing clustering operations on the dataset? Explain.
Ans. For performing clustering operation on our dataset, we deployed k-means clustering which is a type of unsupervised learning algorithm.
The k-means clustering algorithm works as follows –
Firstly, we specify the number of clusters to be created.
1.The K-means algorithm performs the selection of k objects randomly. This object is generally the initial cluster.
2.The centroid closest to the data point claims it as a new observation. We calculate the assignment based on the Euclidean Distance between object and the centroid.
3. Using the k clusters, one can update the centroid through the calculation of new mean values that a cluster contains. The kth cluster centroid has a length of p that contains mean of all observation variables in the cluster k.
4. We then perform iterative minimization of the total within sum of squares. When the assignment halts, we achieve maximum iteration.
Q.4 How did you determine optimal clusters in your model?
Ans. For determining optimal clusters in our model, we used three methods –
- Elbow method
- Silhouette method
- Gap statistic
From the above methods, we concluded that 6 was the optimal number of clusters for our model.
Q.5 You have utilized KMeans Clustering in your project. What are some of the disadvantages of KMeans Clustering Algorithm?
Ans. One of the main disadvantages of using K-means clustering is that it suffers from the problem of convergence at local optima. It is also difficult to predict the number of cluster. Furthermore, KMeans Algorithm is sensitive to outliers.
3. Sentiment Analysis Project
Time to practice the third project and questions related to it. Practice Sentiment Analysis Project
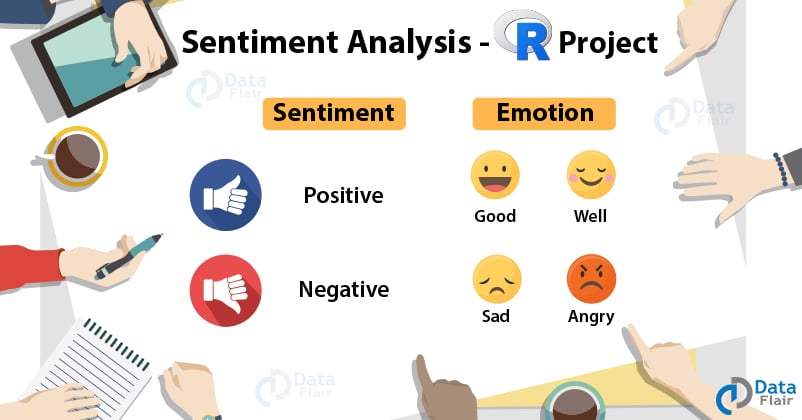
Q.1 What is sentiment analysis?
Ans. Sentiment Analysis is a text classification technique that analyzes a message and predicts whether the incoming message is positive, negative or neutral.
Q.2 What is the unnest_tokens() function? How have you used this function in your project?
Ans. We use the unnest_tokens() function to convert a dataframe with a text column that is taken in one-token-per-row. For structuring our project properly, we make use of this one-token-per-row format.
Q.3 What is a lexicon? Which lexicon model did you use in your project?
Ans. The lexicon-based approach for extracting sentiments from the text is one of the most popular techniques in sentiment analysis. It is applied for carrying out the polarity classification task such that the assignment of positive or negative label to a text is capable of capturing the opinion towards the subject matter.
In our project, we made use of the ‘bing’ lexicon model. The bing lexicon is also responsible for categorizing words into binary categories of positive and negative.
Q.4 What is the use of mutate() function. How was it used in your project?
Ans. The mutate() function is a function for creating new variables while preserving the older variables. In our project, for keeping track of which line and chapter of the book each word is coming from, we make use of the mutate() function to construct those columns. We will also use mutate() to add another column variable that consists of net sentiment analysis.
Q.5 How is frequency table created?
Ans. In order to create the frequency table, all the words in the word bank are first iterated. These words are then stored in an array. Then, the tweets in the positive training set are iterated. If the word that is being looked out for appears more than 1, then the counter is increased by 1. These values are then stored in an array. This array represents the frequency of the occurence of words. Finally, the same process is repeated for negative training set.
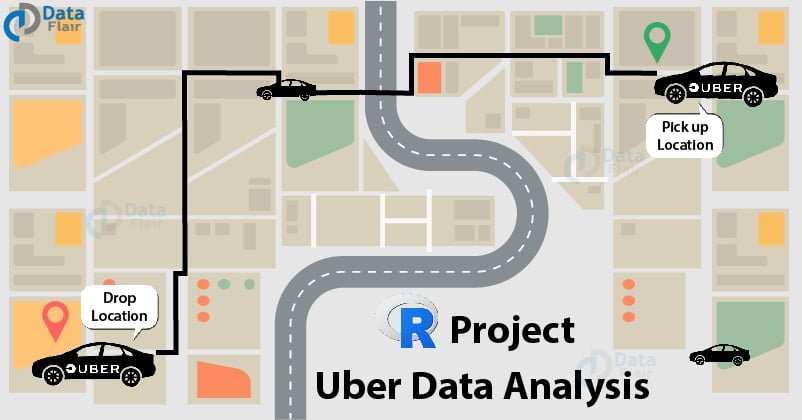
4. Uber Data Analysis Project
One of my favorite R data science project. You must try this – Uber Data Analysis Project
Q.1 What are some of the essential packages that you used for this project? Also, give the reason behind using these packages.
Ans. For this project, the essential packages that were used are – ggplot2, ggthemes, dplyr, tidyr, scales etc.
ggplot2 – ggplot2 is a statistical visualization package that provides various functionalities for building graphs. Due to its aesthetic features that impart the graph
ggthemes – This graph provides extra themes, geoms and scales for ggplot2 that were used in the project. These geoms are the visual representations of data objects.
dplyr – This is the main grammar of data manipulation operations. They provide a consistent set of verbs that allow you to solve common data manipulation challenges. The various functions like mutate(), select(), filter() and summarize() provide easy data manipulation functionalities.
tidyr – The aim of tidyr is to help you in tidying the data. We can tidy data where:
- Each variable is present in a column
- Each observation is basically a row.
- Each value is denoted by a cell.
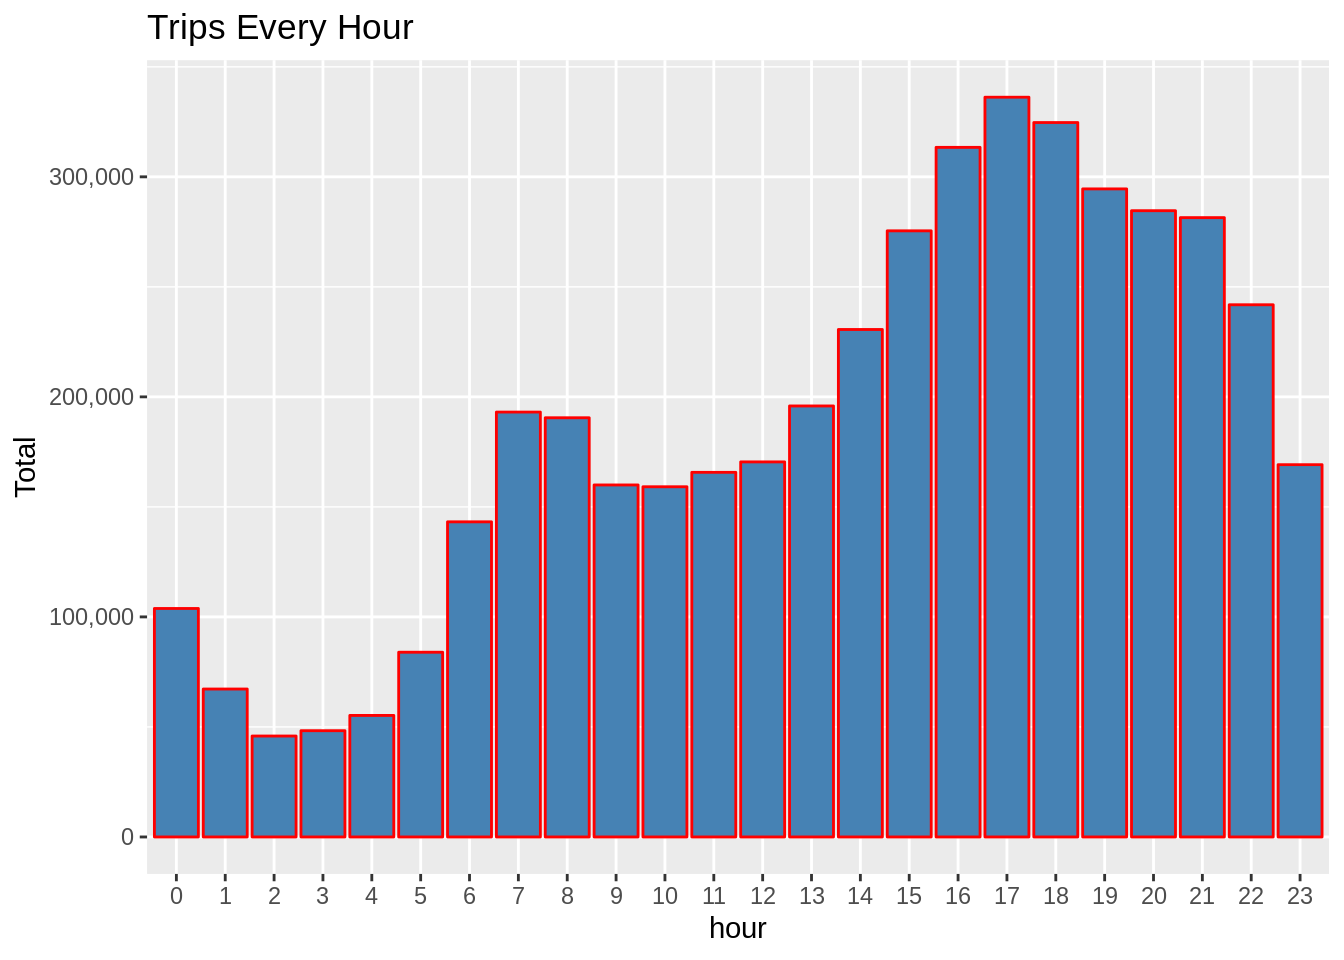
Q.2 After you plotted the data about the number of trips made by passengers in a day, what were the conclusions that you inferred from the resulting visualization?
Ans. In the visualization of the trips made by passengers in a day, we observed that the number of trips that were made around 5PM – 6PM were highest during the day. More than 300,000 passengers were commuting in this time-frame.
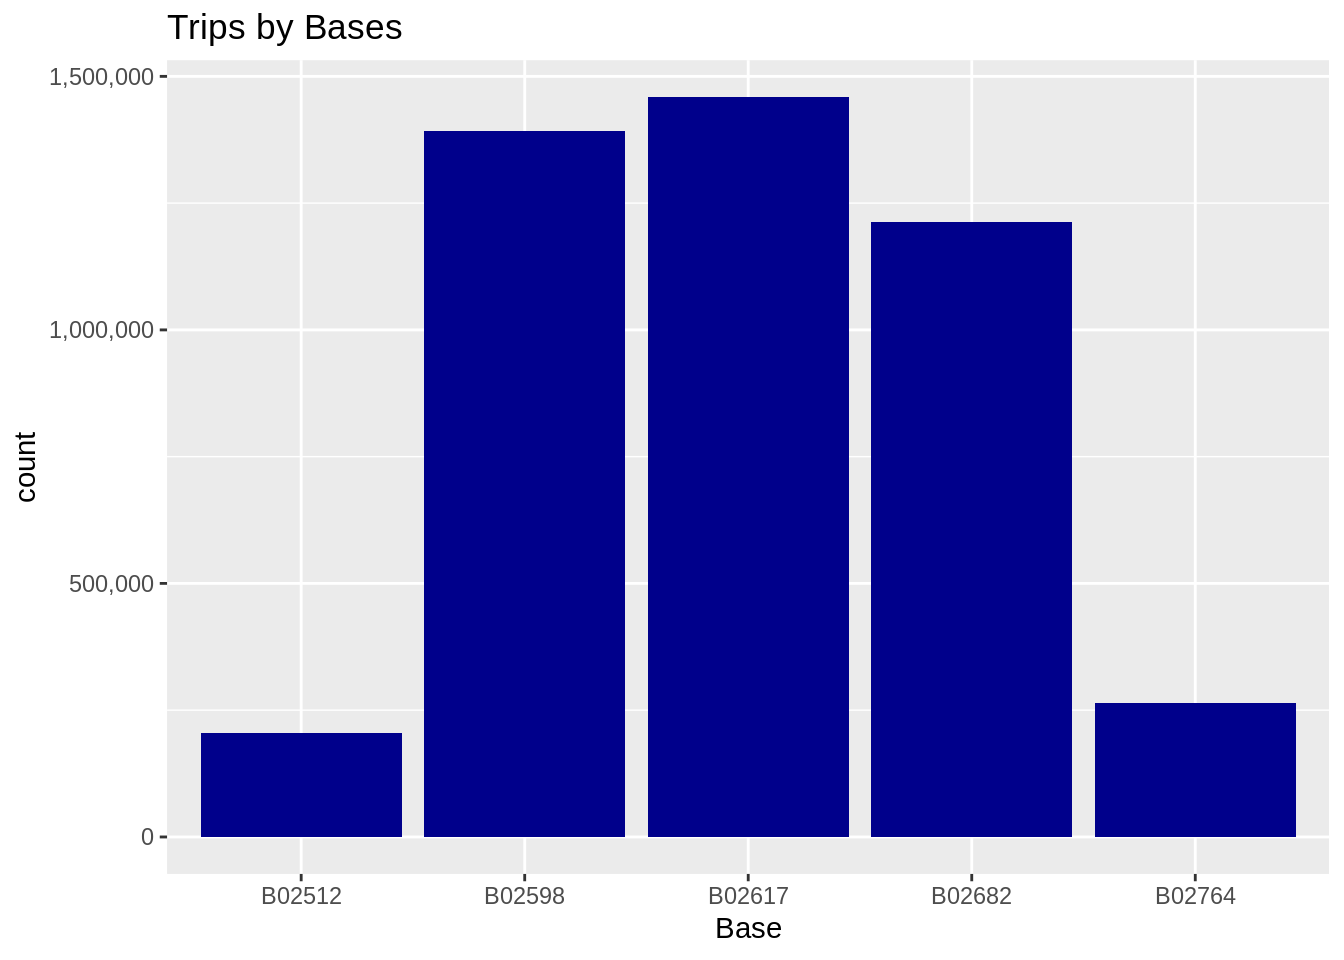
Q.3 There are in total 5 bases. Which base according to you received the highest number of passengers?
Ans. Among all the 5 bases, the third base – B02617 catered to the highest number of passengers.
Q.4 How can you plot multiple visualizations in one graph? What function would you use for this operation?
Ans. For plotting multiple visualizations in a single output, we can make use of the par() function. Furthermore, the ggplot package provides us with the function – ggarrange() through which we can easily plot multiple visualizations on a single page.
Q.5 What were the key inferences that you mined from the project?
Ans. Some of the key inferences that we mined from this project are as follows –
The evening period between 5-6 PM observes the rush hour of the highest commuter traffic.
The month of September observed the highest number of commuters using Uber services.
Base B02617 served the most customers and observed peak commutation on Fridays.
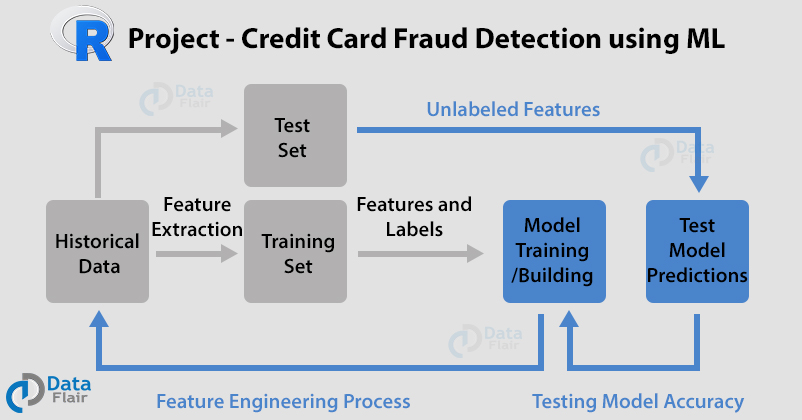
5. Credit Card Fraud Detection
Finally here comes our last project – Credit Card Fraud Detection. Let’s explore R Data Science Interview Questions related to this project.
Q.1 What algorithms did you use to detect the fraud in credit cards?
Ans. In this project, we utilized the following algorithms for fraud detection in credit cards –
- Logistic Regression
- Artificial Neural Networks
- Decision Trees
- Gradient Boosting
Q.2 How did you evaluate the performance of your algorithm in this project?
Ans. For evaluating the model performance, we plotted ROC graphs. The ROC or Receiver Operating Characteristics is a quantification of the True Positive Rate (TPR) against False Positive Rate (FPR). We compute True Positive (TP) as TPR = TP/ (TP + FN). On the contrary, false positive rate is computed as FPR = FP/FP+TN where TP = true positive, TN = true negative, FP = false positive, FN = false negative.
Q.3 What are decision trees? How are boosting algorithms related to it?
Ans. Decision Trees are a popular data mining technique that possess a tree like structure to deliver consequences based on the input decisions. We use decision trees for classification as well as regression. With this type of classification methodology, one can handle heterogeneous as well as missing data. We can further obtain understandable rules with the help of decision trees.
Boosting Algorithms like Gradient Boosting are an ensemble of weak learners. These weak learners are often weak decision trees. Combination of many of these decision trees are able to build a strong classifier.
Q.4 If you want to carry out logistic regression on the same dataset that takes less time but also outputs analogous accuracy, what would you do?
Ans. We will increase the learning rate and decrease the number of iterations. If you want to decrease the number of iterations while carrying out model training, it would take less time but it would not yield exact accuracy.
Q.5 In your project, you have utilized boosting algorithms. While utilizing boosting algorithms, we always consider weak learners. What is the main reason behind having weak learners?
Ans. For preventing model overfitting, the complexity of overall learner increases at every step. While starting with weak learners, the final classifier is very less likely to possess overfitting.
Summary
Have you practiced these projects earlier? If yes, then how many questions you have answered on your own. And if your answer is no, then don’t waste time. Work on at least 3 projects before you face any interview. These five projects ranged from easy to difficult which are also proportional to the interview questions. We hope that you gain insights through these interview questions.
If there is any concept that is not clear to you, refer to our FREE Data Science Tutorials Library.
Your 15 seconds will encourage us to work even harder
Please share your happy experience on Google


