Learn to Save Graphs to Files in R Programming with R Graphical Devices
Interactive Online Courses: Elevate Skills & Succeed Enroll Now!
In our previous R tutorial, we have discussed about R Lattice Package, now, it’s time for learning how to save graphs to files in R programming. We will discuss its different methods along with various R graphic devices.
So, let’s start the tutorial.
What is a Graphics Device?
A graphics device is something where we can delineate a plot. When we make a plot in R, it has to be “sent” to a specific:
- Window on your computer (screen device)
- PDF file (file device)
- PNG or JPEG file (file device)
- Scalable vector graphics (SVG) file (file device)
In order for the plot to be “sent”, the most common place is the screen device.
- On Mac, the screen device is launched with the help of quartz().
- On Windows, the screen device is launched with windows().
- And, on Unix/Linux, the screen device is launched with x11().
You must definitely check the tutorial on Data Visualization in R
R Graphical Devices
The following devices are currently available:
- PDF – Write PDF graphics commands to file.
- xfig – Device for XFIG graphics file format.
- pictex – Writes TeX/PicTeX graphics commands to a file (of historical interest only).
- postscript – Writes PostScript graphics commands to a file.
- bitmap – bitmap pseudo-device via Ghostscript (if available).
- SVG – Device for the SVG File Format
- libgd – Supports fast image creation
- GTK – Supports gtkDevice.
- quartz – Graphics Device Driver for MacOS.
- x11 – Provides functions in Windows for opening interactive graphics device.
The following devices will be functional if R is compiled to use them:
- png – PNG bitmap device
- jpeg – JPEG bitmap device
- bmp – BMP bitmap device
- tiff – TIFF bitmap device
- X11 – This is for the X11 windowing system.
- svg – SVG device based on Cairo graphics.
- cario.pdf, – cairo_ps PDF and PostScript devices based on Cairo graphics.
- quartz – The graphics device for the macOS native Quartz 2d graphics system.
R runs on many different operating systems and also supports different graphics formats.
Format Driver Notes |
| JPEG jpeg It is used everywhere but it does not facilitate resizing. |
| PNG png similar to JPEG and it does not resize. |
| WMF win.metafile It is based on the Windows platform only. It is best suited for MS word and it facilitates flexible resizing. |
| PDF pdf pdflatex; easily resizable |
Postscript postscript latex and Open Office; easily resizable |
Wait! Have you checked – Graphical Data Analysis with R Programming
Method to Save Graphs to Files in R
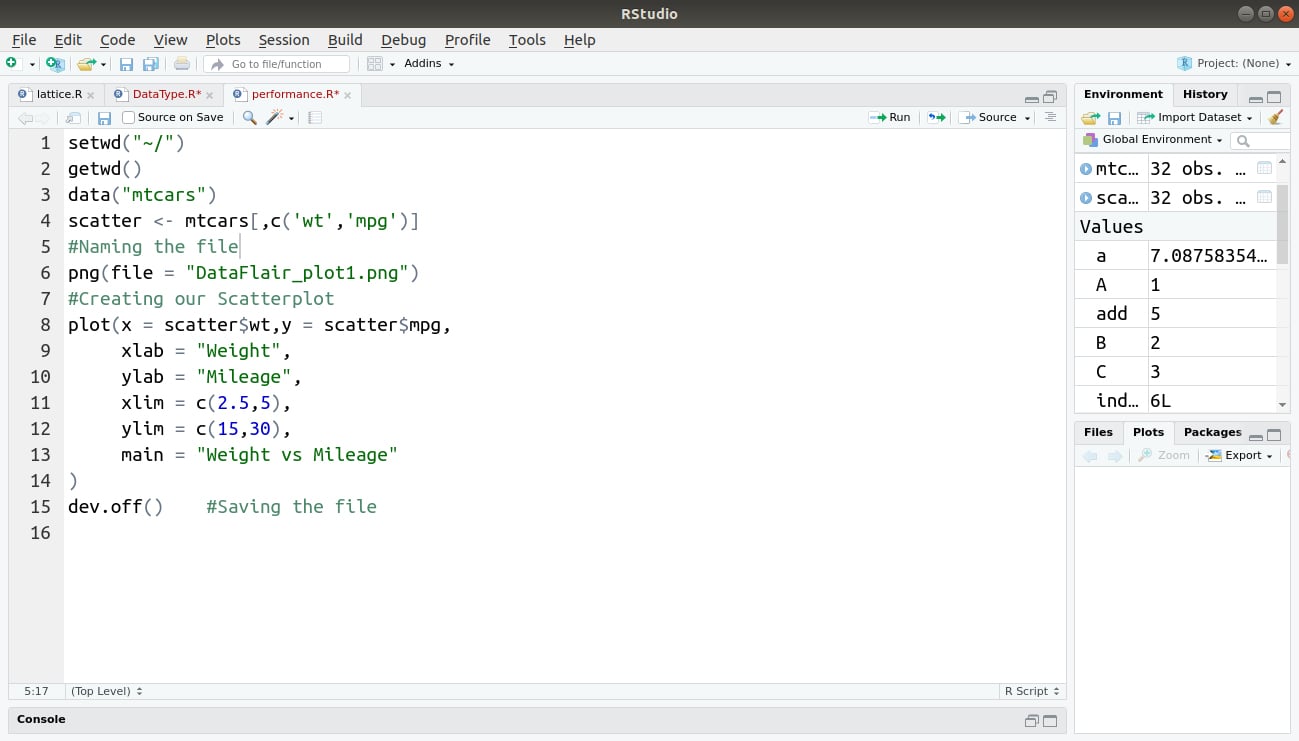
In order to save graphics to an image file, there are three steps in R:
- You can create a graphics device of PNG format using png(), JPG format using jpg() and PDF format using pdf().
- Plot your data.
- Closing the graphics device and saving the image using dev.off.
setwd("~/")
getwd()
data("mtcars")
scatter <- mtcars[,c('wt','mpg')]
#Naming the file
png(file = "DataFlair_plot.png")
#Creating our Scatterplot
plot(x = scatter$wt,y = scatter$mpg,
xlab = "Weight",
ylab = "Mileage",
xlim = c(2.5,5),
ylim = c(15,30),
main = "Weight vs Mileage"
)
dev.off() #Saving the file
Output:
Local Sessions with Windows or OS X
The graphical user interface makes it easy to save files. Right-click inside the graph on Windows platform. Then you can select either “Save as metafile …” or “Save as postscript …”. If you are working on MS Word, then be sure to save the file as a metafile.
On Mac, click on the graphics window to make sure it’s the active one, then go to File -> Save in the menubar, and choose a location to save the file. It will save as a PDF file, which we can double-click to open in Preview, and then use the File -> Save as menu choice to convert it to another format.
Summary
We learned the different methods and functions which we use to save graphs to files. By using these different functions and methods, it’s easier to plot graphs and save files. As R runs on many operating systems, the R commands are very helpful in the above case to plot graphs and to save them in a file.
Now, it’s the turn for R Performance Tuning Techniques
Still, if you have any doubts regarding the tutorial, ask in the comment section. We will be glad to help you.
Did you like this article? If Yes, please give DataFlair 5 Stars on Google


Let’s say you want to put 4 graphs together as panels A, B, C and D, into one figure. How would you do that?
Can’t say, I’m very green with this. For those reading this years later, par(mfrow = c(1, k)) will allow your to arrange k images in a single row. For example, k = 2 would be two images side by side. K= 3, three images side by side and so on. Best of luck!