Data Science K-means Clustering – In-depth Tutorial with Example
Machine Learning courses with 100+ Real-time projects Start Now!!
One of the most popular Machine Learning algorithms is K-means clustering. It is an unsupervised learning algorithm, meaning that it is used for unlabeled datasets. Imagine that you have several points spread over an n-dimensional space.
In order to categorize this data on the basis of their similarity, you will use the K-means clustering algorithm. In this article, we will go through this algorithm in detail. Then, we will discuss the basic Python libraries that can be used to implement this algorithm.
K-means clustering algorithm is an unsupervised technique to group data in the order of their similarities. We then find patterns within this data which are present as k-clusters.
These clusters are basically data-points aggregated based on their similarities. Let’s start K-means Clustering Tutorial with abrief about clustering.
What is Clustering?
Imagine that you have a group of chocolates and liquorice candies. You are required to separate the two eatables. Intuitively, you are able to separate them based on their appearances.
The process of segregating objects into groups based on their respective characteristics is called clustering. In clusters, the features of objects in a group are similar to other objects present in the same group.
Clustering is used in various fields like image recognition, pattern analysis, medical informatics, genomics, data compression etc. It is part of the unsupervised learning algorithm in machine learning.
This is because the data-points present are not labelled and there is no explicit mapping of input and outputs. As such, based on the patterns present inside, clustering takes place.
What is K-means Clustering?
According to the formal definition of K-means clustering – K-means clustering is an iterative algorithm that partitions a group of data containing n values into k subgroups. Each of the n value belongs to the k cluster with the nearest mean.
This means that given a group of objects, we partition that group into several sub-groups. These sub-groups are formed on the basis of their similarity and the distance of each data-point in the sub-group with the mean of their centroid.
K-means clustering is the most popular form of an unsupervised learning algorithm. It is easy to understand and implement.
The objective of the K-means clustering is to minimize the Euclidean distance that each point has from the centroid of the cluster. This is known as intra-cluster variance and can be minimized using the following squared error function –
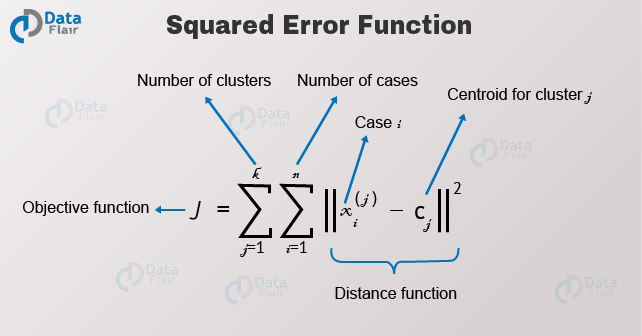 Where J is the objective function of the centroid of the cluster. K are the number of clusters and n are the number of cases. C is the number of centroids and j is the number of clusters.
X is the given data-point from which we have to determine the Euclidean Distance to the centroid. Let us have a look at the algorithm for K-means clustering –
1. First, we randomly initialize and select the k-points. These k-points are the means.
2. We use the Euclidean distance to find data-points that are closest to their centreW of the cluster.
3. Then we calculate the mean of all the points in the cluster which is finding their centroid.
4. We iteratively repeat step 1, 2 and 3 until all the points are assigned to their respective clusters.
K-Means is a non-hierarchical clustering method.
K-Means in Action
In this section, we will use K-means over random data using Python libraries.
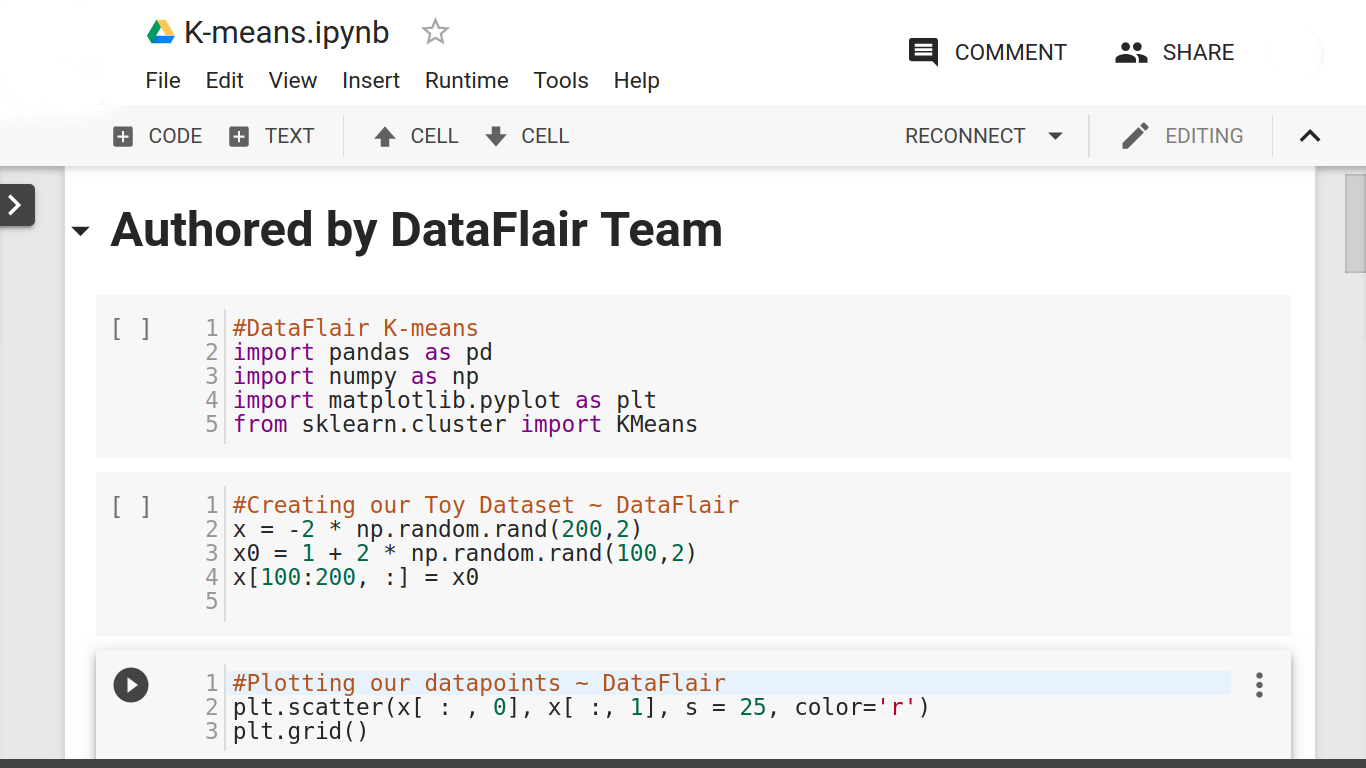
- First, we import the essential Python Libraries required for implementing our k-means algorithm –
import numpy as np
import pandas as pd
import matplotlib.pyplot as plt
from sklearn.cluster import KMeans
- We then randomly generate 200 values divided in two clusters of 100 data points each.
x = -2 * np.random.rand(200,2)
x0 = 1 + 2 * np.random.rand(100,2)
x[100:200, :] = x0
- We proceed to plot our generated random values and obtain the following graph.
plt.scatter(x[ : , 0], x[ :, 1], s = 25, color='r')
plt.grid()
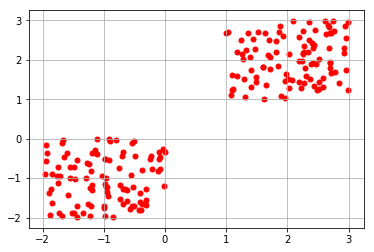
From the above graph, we observe that about 200 data points have been partitioned in two clusters, where each cluster contains 100 data points.
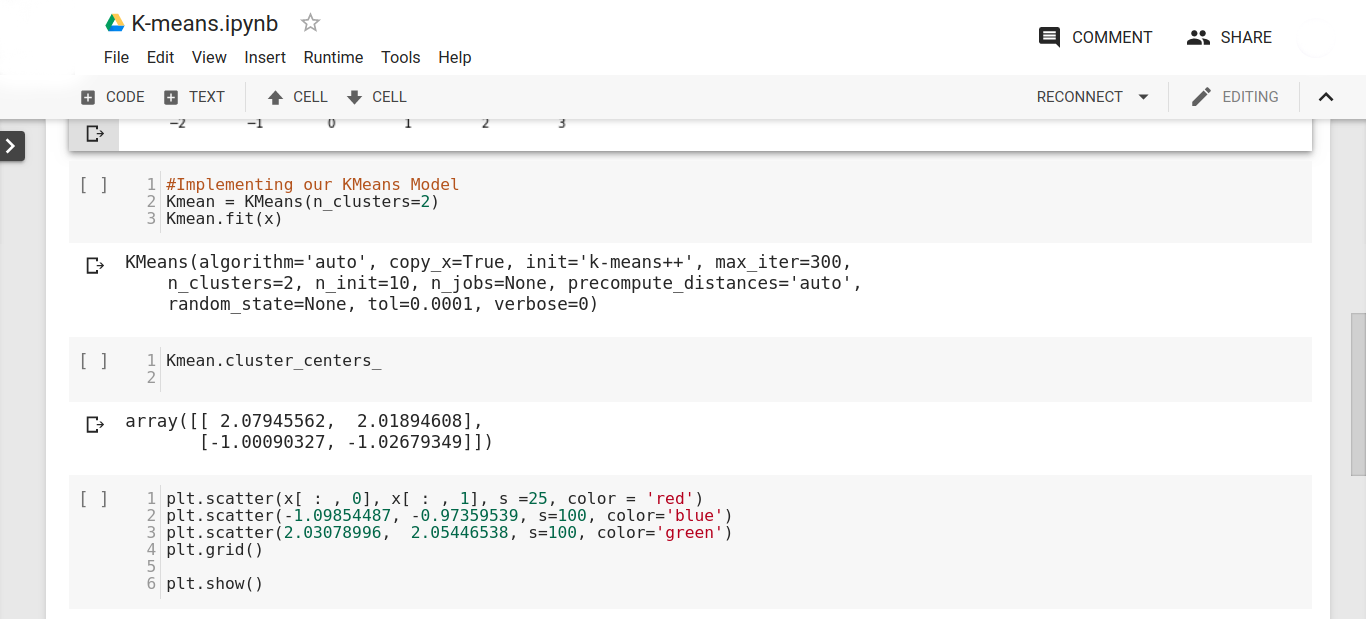
- After plotting our two clusters, we proceed to implement our k-means learning algorithm to establish the centroids for our clusters. We initiate the k, which represents the cluster with a random value of 3.
Kmean = KMeans(n_clusters=3)
Kmean.fit(x)
- After this, we proceed to find the location of the centroids of our two clusters. We obtain the following result after typing the following line of code –
Kmean.cluster_centers_
- We then proceed to visualize the centroids of our two clusters:
plt.scatter(2.03078996,  2.05446538, s=100, color='green')
plt.show()
We obtain the following output –
Now, we obtain the following graph –
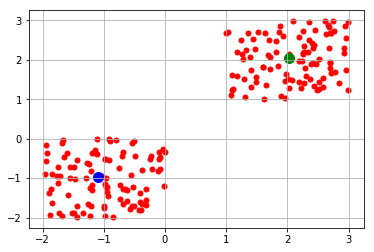
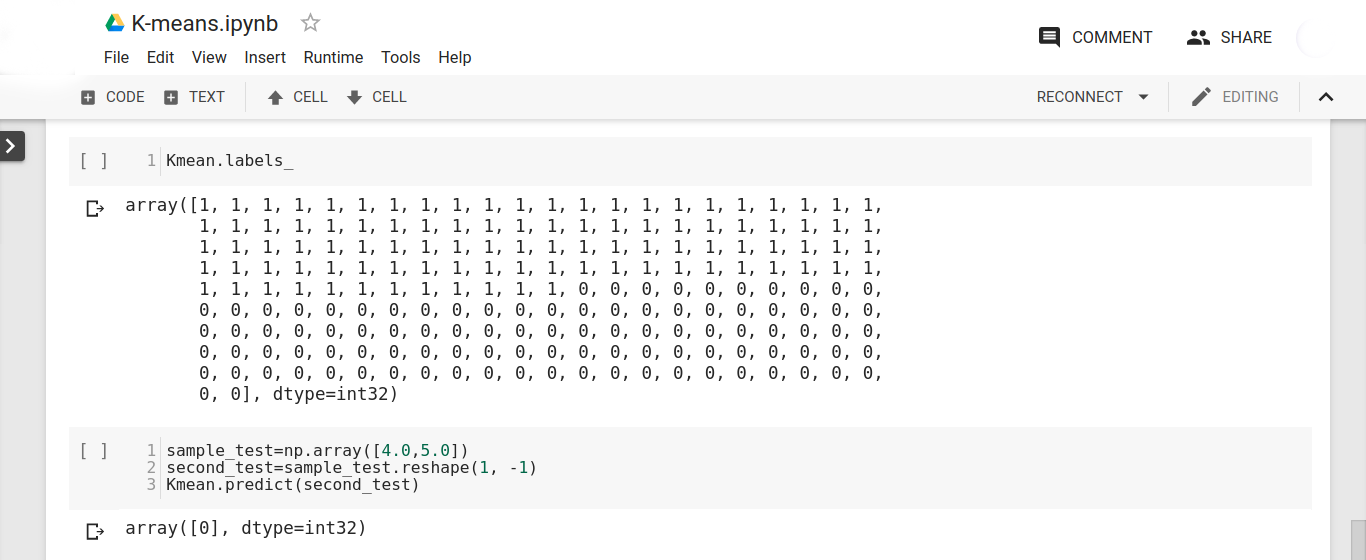
- In the above visualization, we obtain the centroids for our two clusters. Now, we will test our model. In the testing phase, we will first display the labels that are distributed across our two labels (0,1) which represent the clusters.
Kmean.labels_
We can clearly observe from the above output that 100 values belong to label 0 and 100 values belong to label 1.
- Now we predict the cluster for a given data point located at position (4,5) in our 2-dimensional space.
sample_test=np.array([4.0,5.0])
second_test=sample_test.reshape(1, -1)
Kmean.predict(second_test)
We obtain the following output –
From the above code, we can conclude that K-means clustering is easy to understand and an easy to implement algorithm. We will now take a look at some of the practical applications of K-means clustering.
You must take a look at why Python is must for Data Scientists
Applications of K-Means Clustering Algorithm
1. K-means algorithm is used in the business sector for identifying segments of purchases made by the users. It is also used to cluster activities on websites and applications.
2. It is used as a form of lossy image compression technique. In image compression, K-means is used to cluster pixels of an image that reduce the overall size of it.
3. It is also used in document clustering to find relevant documents in one place.
4. K-means is used in the field of insurance and fraud detection. Based on the previous historical data, it is possible to cluster fraudulent practices and claims based on their closeness towards clusters that indicate patterns of fraud.
5. It is also used to classify sounds based on their similar patterns and isolating deformities in speech.
6. K-means clustering is used for Call Detail Record (CDR) Analysis. It provides an in-depth insight into the customer requirements based on the call-traffic during the time of the day and demographics of the place.
Summary
K-means clustering is an unsupervised learning algorithm used in data science to group data points into distinct clusters. It works by placing ‘k’ number of centroids and assigning each data point to the nearest one. The centroids are then updated by calculating the mean of all points in the cluster. This process continues until the clusters stop changing. The result is a set of groups where each group shares similar characteristics.
So, in this K-means clustering tutorial, we went through the basics of it. We understood its definition and the algorithm that is used. We also went through the code implementation using Python Libraries. In the end, we went through the real-life applications of K-means clustering.
As a Data Scientist, having knowledge of this clustering algorithm is essentially important. Since it teaches you to deal with unlabeled data, it is a must-have skill for any budding data scientist.
K-means is a Machine Learning Algorithm that forms a part of a much larger pool of data operations known as Data Science. This is the right time to explore everything about Data Science.
Hope the tutorial was helpful. If there is anything we missed out, do let us know through comments.
Your 15 seconds will encourage us to work even harder
Please share your happy experience on Google


This is really well articulated & clearly put across. Really like the explanation & practical example.
You are doing a really great thing…Good Keep it Up 🙂
Thanks for the feedback. Share the Data Science K-means Clustering tutorial on social media, if you liked it.
I have few questions-
1) How we decide that how many clusters we need to create(n_clusters)
2) I understands that how 1 set of data point will react towards the o/p. But how the overall result of each data point is calculated to form the single o/p equation.
Is it takes a lot of time to make K-means Clustering if we deal with big data, or is it a new fast way or secret formula to do that.
Thanks in advance
Hemdan
It’s really a short and quick but clear tutorial on K-means!
Thank you!
I want to buy a project from your website