Chi-Square Test in R | Explore the Examples and Essential concepts!
Job-ready Online Courses: Click, Learn, Succeed, Start Now!
“A statistician can have his head in an oven and his feet in ice, and he will say that on the average he feels fine”
Previously, whenever I heard the term chi-square, I always tend to avoid working on it (which I shouldn’t😝) as you must be aware that it’s a bit complex topic in statistics. But, mark my words, this concept is very useful as well as important for mastering Data Science. And, after knowing the easy way of using this concept, which I discovered a few months before, you will never be having any issues or queries.
So, why wait? Let’s quickly jump to our tutorial on chi-square test in R.
We will be discussing about the R chi-square test. It contains some parameters which are necessary to understand. Therefore, we will discuss each parameter in detail with an example.

We will start with understanding the chi-square test in R.
Introduction to Chi-Square Test in R
Chi-Square test in R is a statistical method which used to determine if two categorical variables have a significant correlation between them. The two variables are selected from the same population. Furthermore, these variables are then categorised as Male/Female, Red/Green, Yes/No etc.
For example:
We can build a dataset with observations on people’s cake buying pattern. And, try to correlate the gender of a person with the flavour of the cake they prefer. Although, if a correlation is being found, we can plan for an appropriate stock of flavours by knowing the number of people visiting with respect to gender.
Syntax:
chisq.test() is a function used to perform test.
Syntax of a chi-square test:
chisq.test(data)
Following is the description of the chi-square test parameters:
- The input data is in the form of a table that contains the count value of the variables in the observation.
- We use chisq.test function to perform the chi-square test of independence in the native stats package in R. For this test, the function requires the contingency table to be in the form of a matrix. Depending on the form of the data, to begin with, this can need an extra step, either combining vectors into a matrix or cross-tabulating the counts among factors in a data frame.
- We use read.table and as.matrix to read a table as a matrix. While using this, be careful of extra spaces at the end of lines. Also, for extraneous characters on the table, as these can cause errors.
Learn the complete concept of Factor Analysis in R
We will actually install a chi-squared test in R and learn to interpret the results. Finally, we will be going to solve a mini challenge before we discuss the answers.
- Background Knowledge
- Case Study – Effectiveness of a drug treatment
- Purpose and math of Chi-Square statistic
- Chi-Square Test
- R Code
1. Background knowledge – Predictive Modeling
It is a technique where we use statistical modeling or machine learning algorithms to predict response variables based on one or more predictors. Hence, the predictors are features that influence the response in some way. Also, the models work best if the features are meaningful and thus have a significant relationship with the response.
2. Hypothetical Example: Effectiveness of a Drug Treatment
To test the effectiveness of a drug for a certain medical condition, we will consider a hypothetical case.
Suppose we have 105 patients under study and 50 of them were treated with the drug. Moreover, the remaining 55 patients were kept under control samples. Thus, the health condition of all patients was checked after a week.
With the following table, we can assess if their condition has improved or not. By observing this table, one can you tell if the drug had a positive effect on the patient?
Here in this example, we can see that 35 out of the 50 patients showed improvement. Suppose if the drug had no effect, the 50 will split the same proportion of the patients who were not given the treatment. Here, in this case, improvement of the control case is high as about 70% of patients showed improvement, since both categorical variables which we have already defined must have only 2 levels. Also, it was sort of perceptive today that the drug treatment and health condition are dependent.
Must Learn – How to create contingency tables in R
3. Chi-Square Test
Particularly in this test, we have to check the p-values. Moreover, like all statistical tests, we assume this test as a null hypothesis and an alternate hypothesis.
The main thing is, we reject the null hypothesis if the p-value that comes out in the result is less than a predetermined significance level, which is 0.05 usually, then we reject the null hypothesis.
H0: The two variables are independent.
H1: The two variables relate to each other.
In the case of a null hypothesis, a chi-square test is to test the two variables that are independent.
4. R Code
We will work on R by doing a chi-squared test on the treatment (X) and improvement (Y) columns in treatment.csv
First, read in the treatment.csv data.
> #Author DataFlair
> data_frame <- read.csv("https://goo.gl/j6lRXD")  #Reading CSV
> table(data_frame$treatment, data_frame$improvement)
Let’s do the chi-squared test using the chisq.test() function. It takes the two vectors as the input. We also set `correct=FALSE` to turn off Yates’ continuity correction.
# Chi-sq test
> chisq.test(data_frame$treatment, data_frame$improvement, correct=FALSE)
Output:
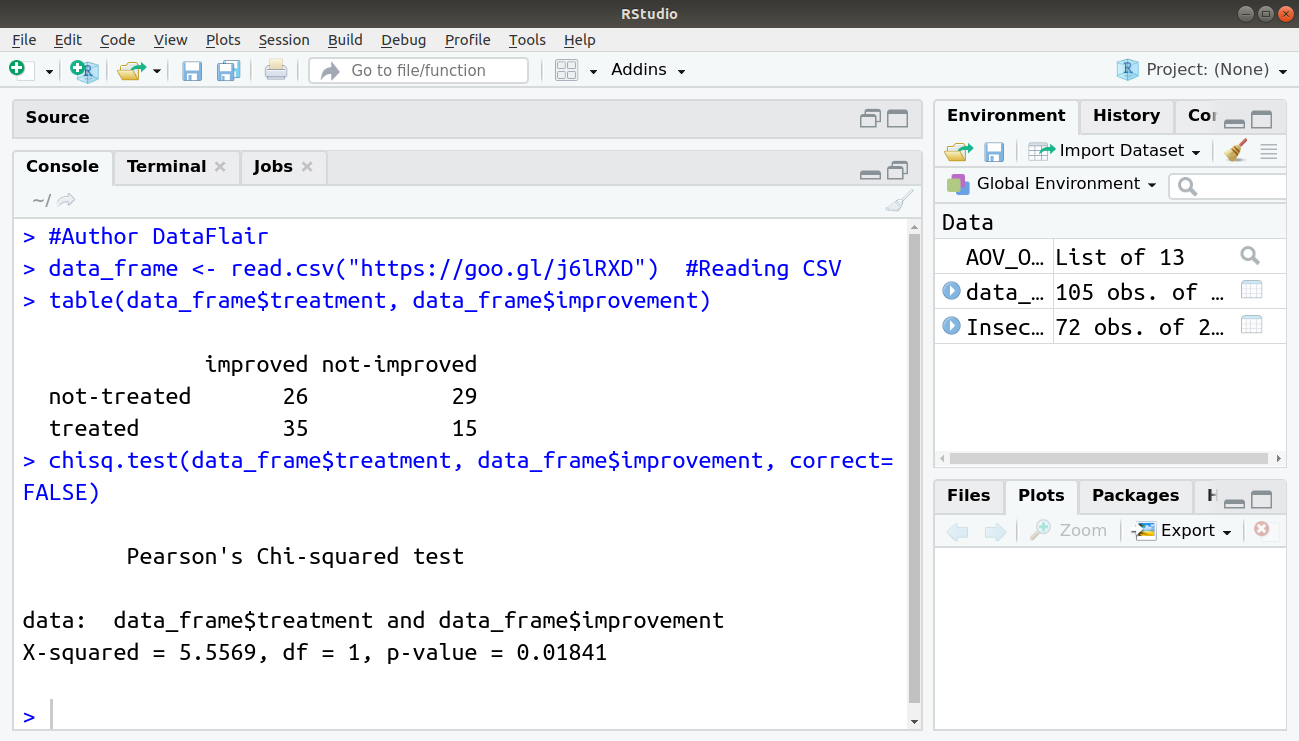
We have a chi-squared value of 5.5569. Since we get a p-Value less than the significance level of 0.05, we reject the null hypothesis and conclude that the two variables are in fact dependent.
Mini-Challenge
Particularly for this challenge, first, find out if the ‘cyl’ and ‘carb’ variables are in ‘mtcars’ dataset and whether it is dependent or not.
Let’s have a look the table of mtcars$carb vs mtcars$cyl.
> data("mtcars")
> table(mtcars$carb, mtcars$cyl)    #Author DataFlair
Since there are more levels, therefore, it’s too hard to figure out if they relate to each other. Let’s use the chi-squared test instead.
# Chi-sq test
> chisq.test(mtcars$carb, mtcars$cyl)
Output:
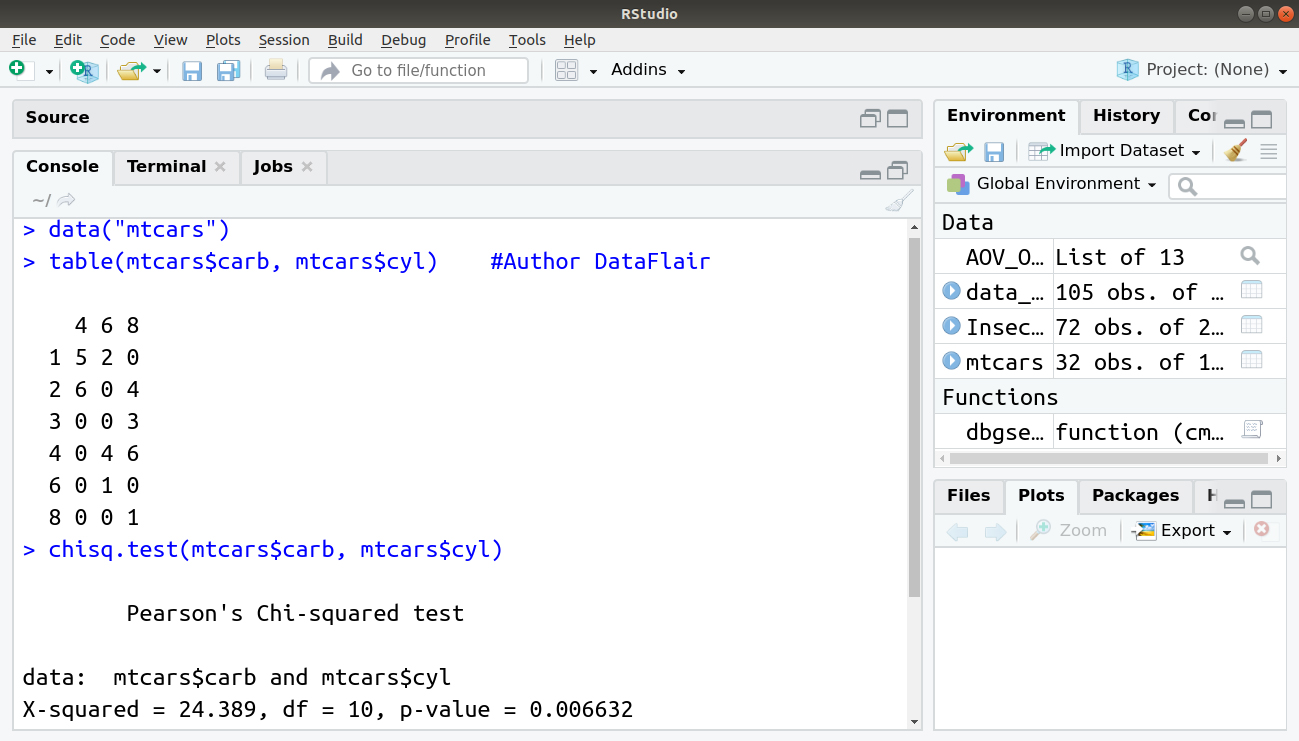
We have a high chi-squared value and a p-value of less than 0.05 significance level. So we reject the null hypothesis and conclude that carb and cyl have a significant relationship.
Summary
We have studied about chi-square tests and its parameters with the example in detail. These parameters with examples which we have discussed will help you to correlate with real-life examples based on chi-square-tests.
Now, its time for exploring the reasons to choose R for Data Science
Did you like our efforts? If Yes, please give DataFlair 5 Stars on Google


I am worried about the rate of success of chisq.test(). A Very detailed article though.
Your mini-challenge example does not satisfy the requirement for the Chi Squared test to be applied. You have 18 cells of which only 3 are above the value of 5. Yates, Moore, and McCabe published that the Chi Squared test has a requirement that 20% or more of the cells in the contingency table are to be of a value of 5 or more. The coding and all else above are correct, but user’s must be aware of the appropriate application/evaluation of the method output
Greg;
What if the requirement “>= 20% of the cells in the contingency table are to be of a value of >= 5” is NOT satisfied?
In that case, what we should do to compare the samples for whether they are independent or not?
… then we should perform Fisher exact tests.
Great article. I was just looking for this.
I wants to contact you dear!.