R Data Frame – A concept that will ease your journey of R Programming!
We offer you a brighter future with industry-ready online courses - Start Now!!
In this R tutorial, we are going to learn about R data frame in detail. Also, get to know the characteristics and operations of the R data frame with the help of examples.
So, let’s quickly start the R data frame tutorial.
What is Data Frame in R?
First of all, we are going to discuss from where the concept of a data frame came. The origin of data frames stems from intensive empirical research in the world of statistical software. The tabular data is referred by the data frames. In particular, it is a data structure in R that represents cases in which there are a number of observations(rows) or measurements (columns).
A data frame is being used for storing data tables, the vectors that are contained in the form of a list in a data frame are of equal length.
For example:
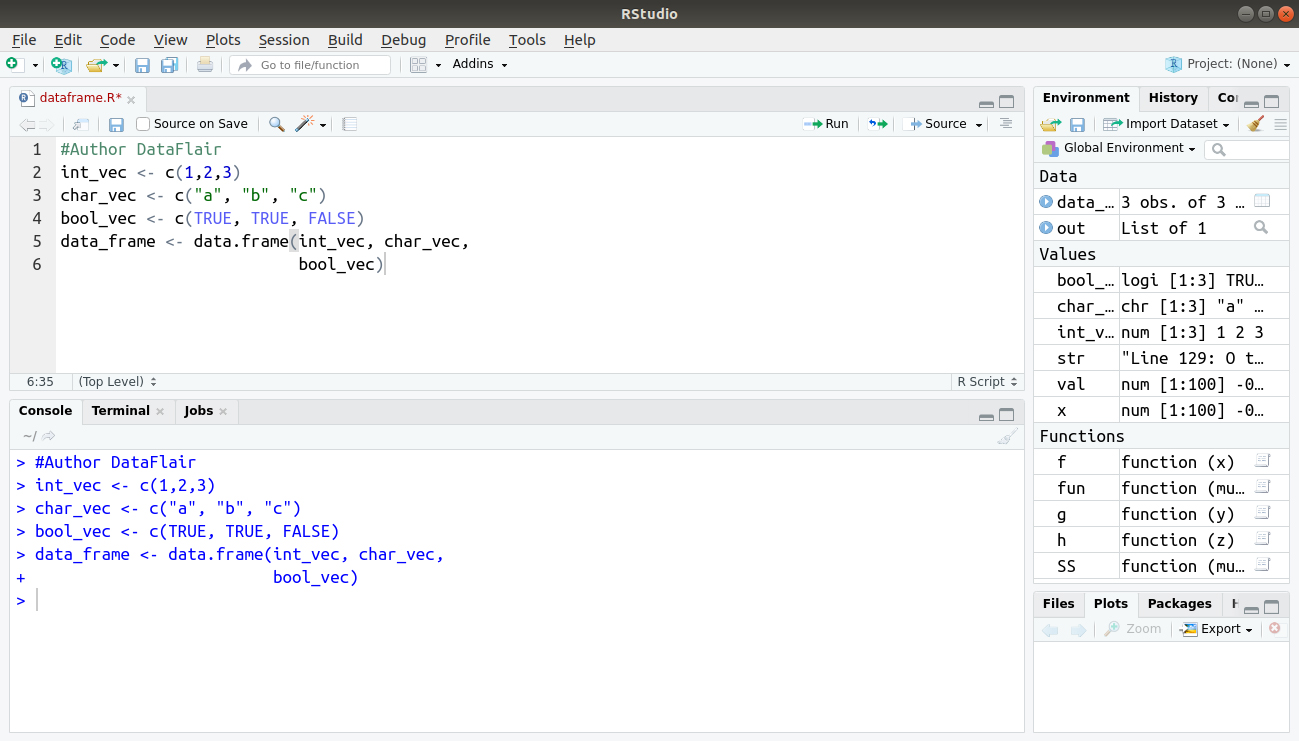
The following variable df is a data frame containing three variables vec, char_vec and bool_vec.
#Author DataFlair
int_vec <- c(1,2,3)
char_vec <- c("a", "b", "c")
bool_vec <- c(TRUE, TRUE, FALSE)
data_frame <- data.frame(int_vec, char_vec,
                         bool_vec)
Output:
A data frame is an array. Unlike an array, the data we store in the columns of the data frame can be of various types. It means one column might be a numeric variable, another might be a factor, and a third might be a character variable. All columns have to be of the same length.
Wait! Have you checked – R Array Tutorial
Characteristics of R Data Frame
Now, let’s discuss the characteristics of data frame in R.
- The column names should be non-empty.
- The row names should be unique.
- The data frame can hold the data which can be a numeric, character or of factor type.
- Each column should contain the same number of data items.
R Data Frame Operations
In this section of the R data frame, we will perform various operations on the data frame in R. So, let’s discuss these operations one by one:
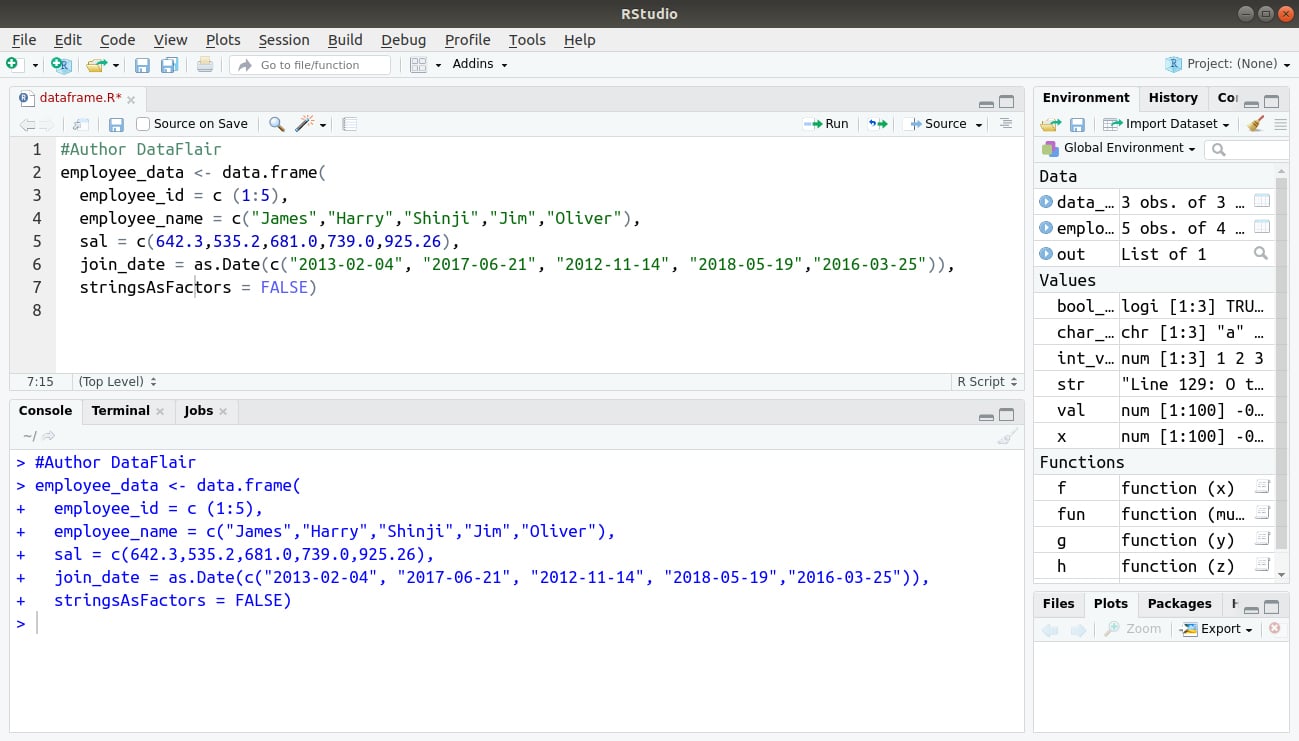
1. Create Data Frame
#Author DataFlair
employee_data <- data.frame(
  employee_id = c (1:5),
  employee_name = c("James","Harry","Shinji","Jim","Oliver"),
  sal = c(642.3,535.2,681.0,739.0,925.26),
  join_date = as.Date(c("2013-02-04", "2017-06-21", "2012-11-14", "2018-05-19","2016-03-25")),
  stringsAsFactors = FALSE)
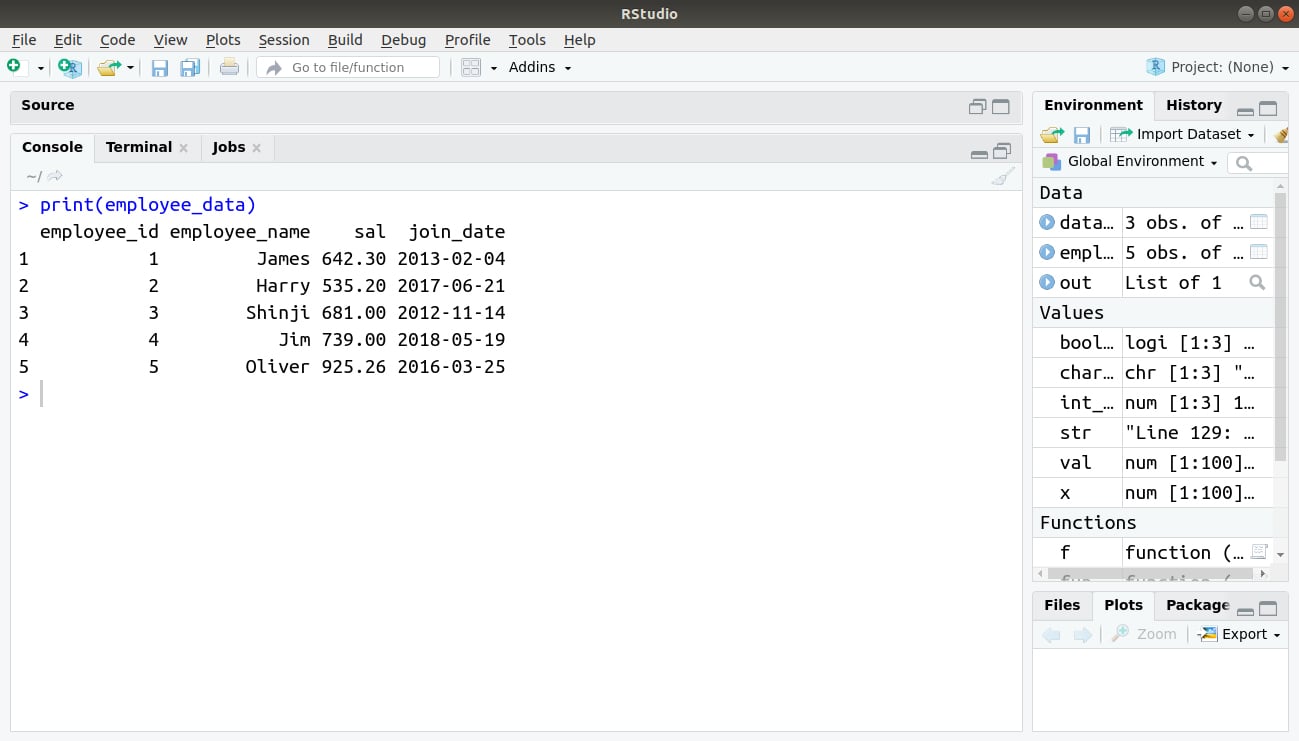
Output:
> print(employee_data)
Output:
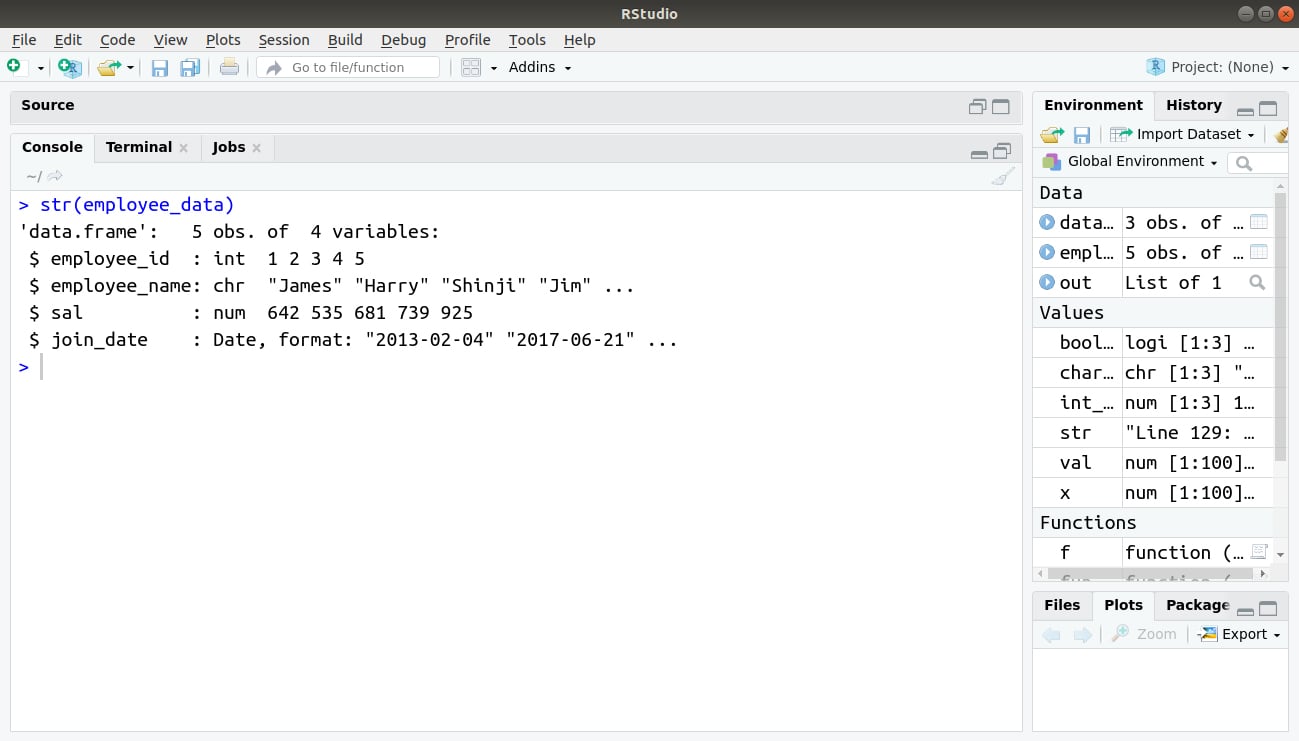
2. Get the Structure of the R Data Frame
The structure of the data frame can see by using the str() function.
> str(employee_data)
Output:
You must definitely learn about the Usage of R Functions
3. Extract data from Data Frame
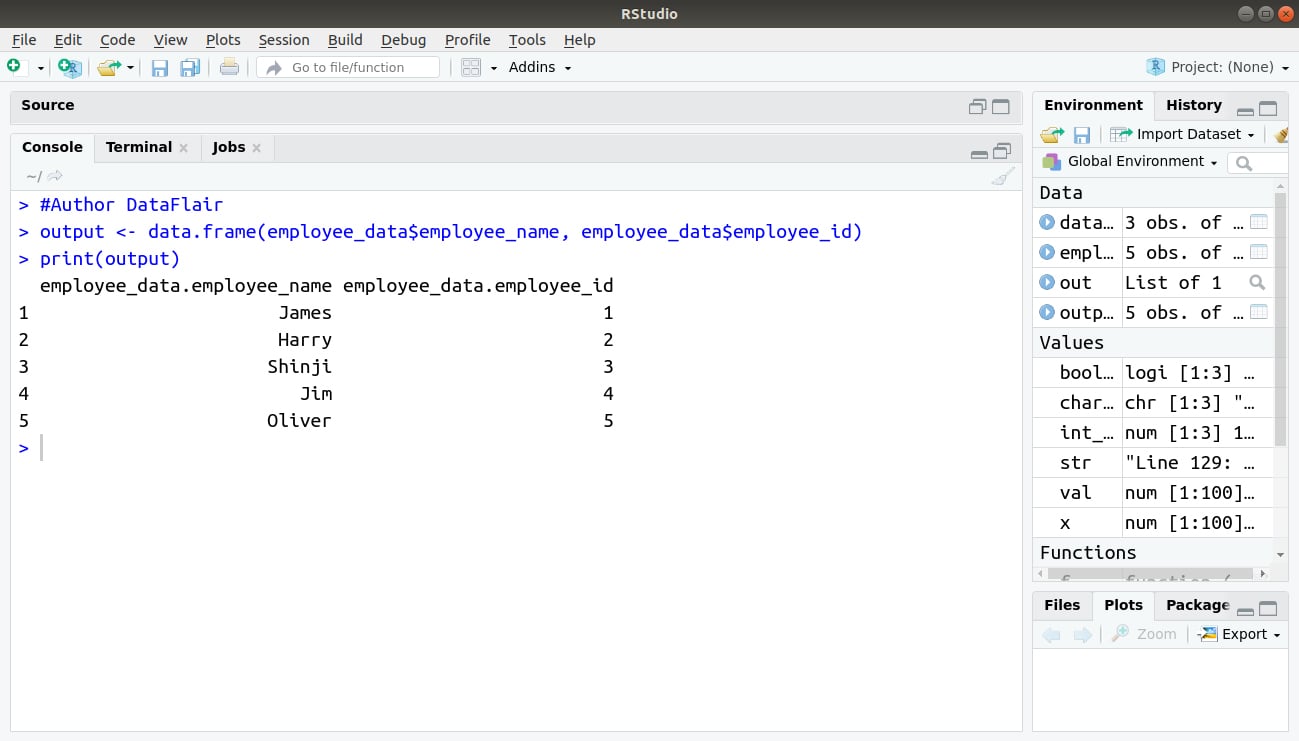
By using the name of the column, extract a specific column from the column.
Extract Specific columns:
> #Author DataFlair
> output <- data.frame(employee_data$employee_name, employee_data$employee_id)
> print(output)
Output:
Extract the first two rows and then all columns
- Extract first two rows
> #Author DataFlair
> output <- employee_data[1:2,]
> print(output)                   #Author DataFlair
Output:

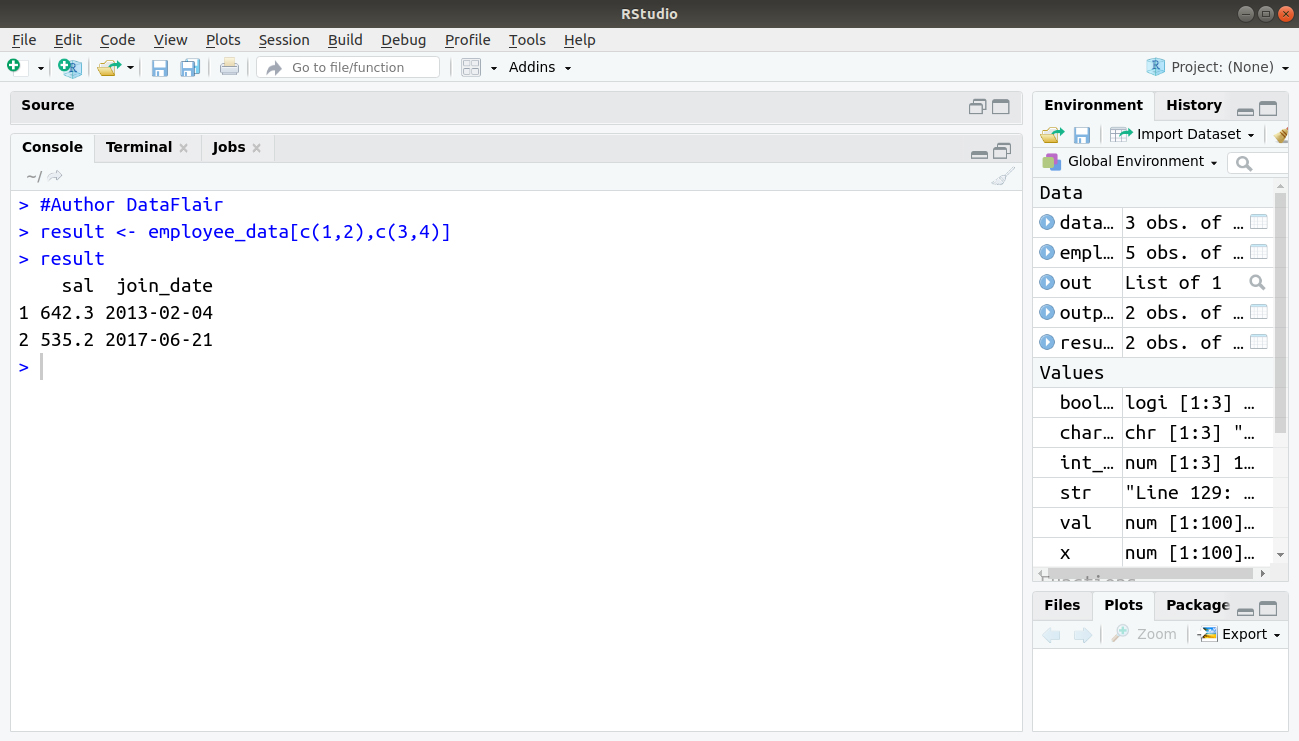
Extract 1st and 2nd row with the 3rd and 4th column of the below data.
> #Author DataFlair
> result <- employee_data[c(1,2),c(3,4)]
> result
Output:
Don’t forget to check the Arguments in R
4. Expand R Data Frame
A data frame can be expanded by adding columns and rows.
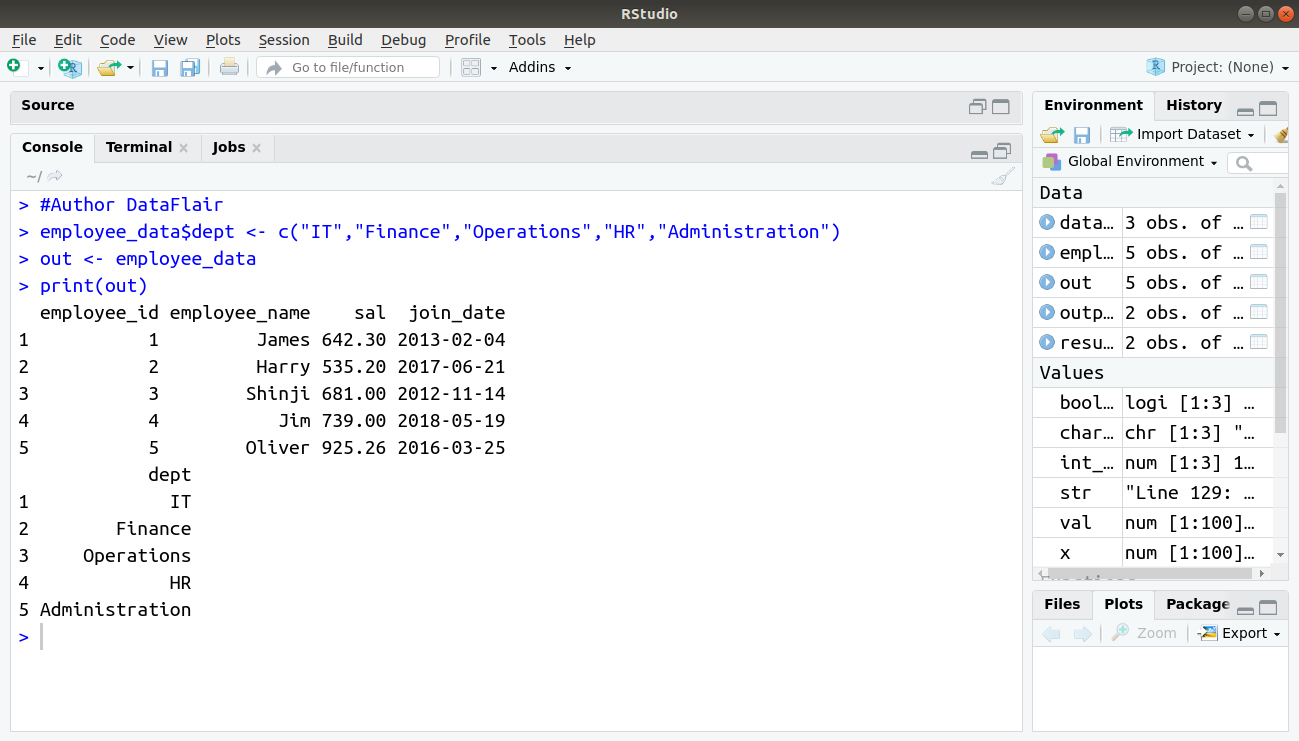
Add Column
Add the column vector using a new column name.
- Add the “dept” column
> #Author DataFlair
> employee_data$dept <- c("IT","Finance","Operations","HR","Administration")
> out <- employee_data
> print(out)
Output:
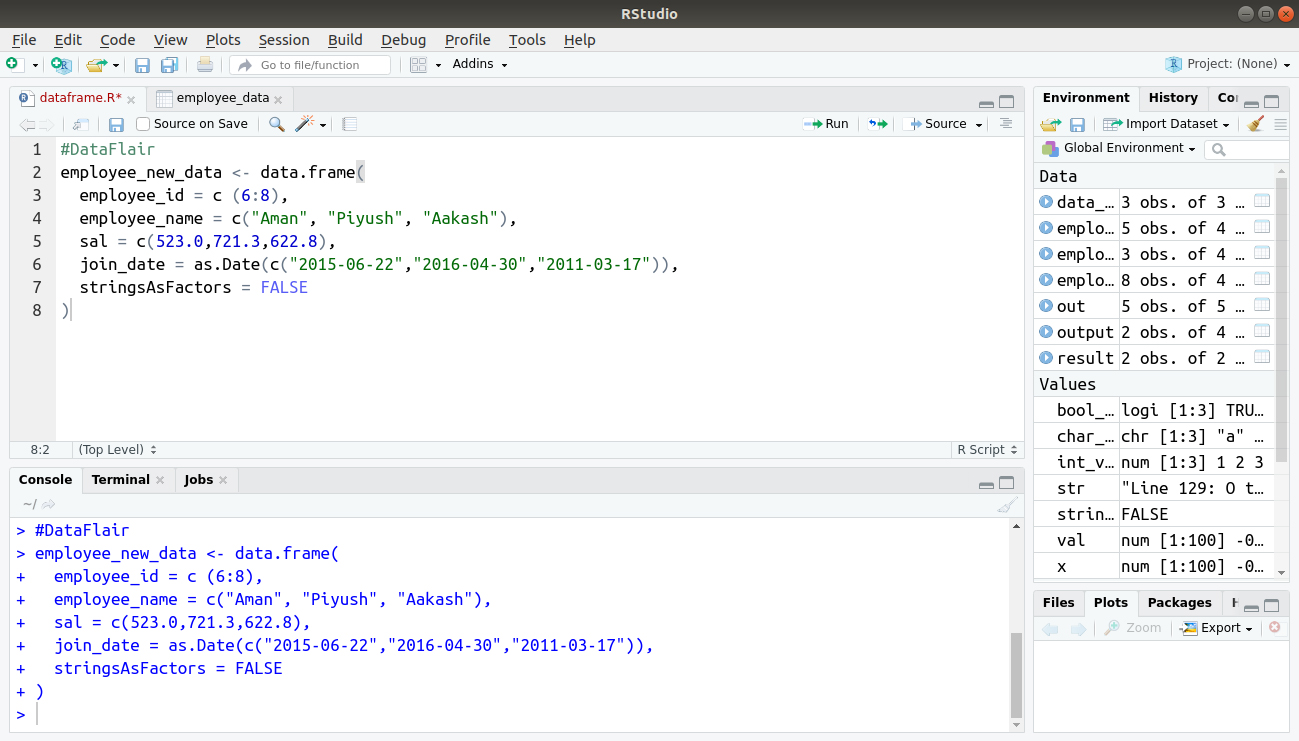
Add Row
- Create the second R data frame
#DataFlair
employee_new_data <- data.frame(
employee_id = c (6:8),
employee_name = c("Aman", "Piyush", "Aakash"),
sal = c(523.0,721.3,622.8),
join_date = as.Date(c("2015-06-22","2016-04-30","2011-03-17")),
stringsAsFactors = FALSE
)
Output:
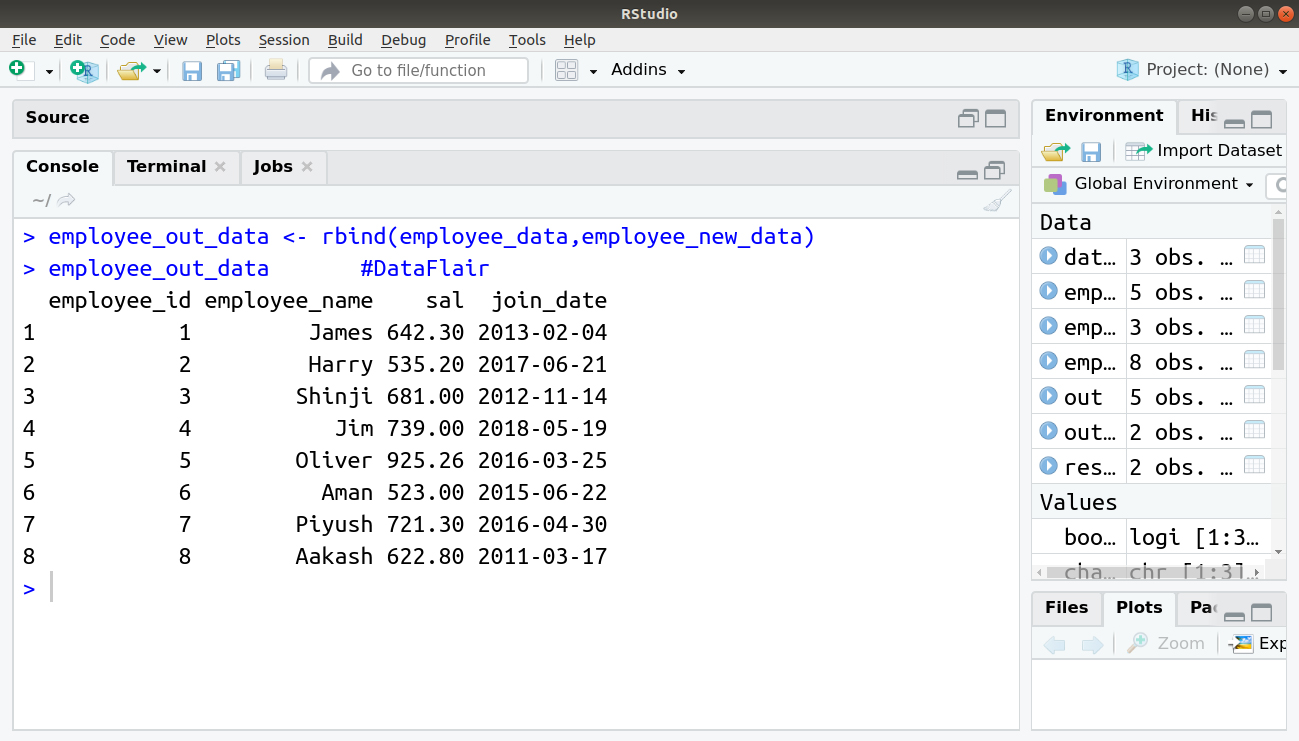
- Bind the two data frames.
> employee_out_data <- rbind(employee_data,employee_new_data)
> employee_out_data       #DataFlair
Output:
Summary
In this R data frame tutorial, we have learned about the data frame along with its characteristics in detail. Also, we have discussed the different operations of a data frame. With the help of the above-mentioned information, it is easier to understand how to expand the data frame as we have included examples of it.
Now, it’s time to learn – How to Create an R Factor
Still, if you any queries regarding the tutorial, ask in the comment section.
Did we exceed your expectations?
If Yes, share your valuable feedback on Google


HELLO SIR
I AM A B.Sc FINAL YEAR STUDENT OF ALIGARH MUSLIM UNIVERSITY. I HAVE A GREAT INTEREST IN R PROGRAMMING SOFTWARE.
PLEASE TELL ME WHERE I CAN GET JOB IF I GET COMMAND OVER R STATISTICAL SOFTWARE?
WHAT WILL BE PACKAGE ATLEAST?
The rbind should be placed before the department example (at 4. Expand R Data Frame). The data frames you bind should have the same columns, but the employee_new_data doesn’t have the “dept” column, so the example with throw an error.
There is a typo in this “The structure of the data frame can see by using the star () function”. The function is str() function and not star( ) function.
Meanwhile, thank you for the good work