SAS/STAT Group Sequential Design and Analysis – With 2 Simple Procedures
Placement-ready Courses: Enroll Now, Thank us Later!
We looked at different types of analysis in the previous tutorial, today we will be looking at SAS/STAT group sequential design and analysis and how group sequential design is used in SAS/STAT. Our focus here will be to understand different procedures that can be used for SAS/STAT group sequential design and analysis through the use of examples.
So let’s start with SAS/STAT Group Sequential Design and Analysis.
SAS/STAT Group Sequential Design and Analysis
What is SAS/STAT Group Sequential Design and Analysis?
A trial is conducted according to a plan called a protocol. A protocol details the objectives of the trial, the data collection process, and the analysis.
The protocol specifies the null hypothesis and an alternative hypothesis, a test statistic, the probability of a Type I error, the probability of a Type II error, the sample size needed to attain a specified power at an alternative reference, and critical values associated with the test statistic.
Let’s Know About Important SAS/STAT Features You Must Know
SAS/STAT group sequential design provides detailed specifications for a group sequential trial. In addition to the usual specifications, it provides the total number of stages (the number of interim stages plus a final stage) and a stopping criterion to reject, accept, or either reject or accept the null hypothesis at each interim stage.
It also provides critical values and the sample size at each stage of the trial.
SAS/STAT group sequential trial usually involves six steps:
- Specify the statistical details of the design, including the null and alternative hypotheses, a test statistic for the hypothesis test, the Type I and II error probabilities, a stopping criterion, the total number of stages, and the relative information level at each stage.
- You compute the boundary values for the trial based on the specifications in Step 1. You also compute the sample size required at each stage for the specified hypothesis test.
- At each stage, you collect additional data with the required sample sizes. The data available at each stage include the data collected at the current stage in addition to the data collected at previous stages.
- At each stage, you analyze the available data with a procedure such as the REG procedure, and you compute the test statistic.
- At each stage, you compare the test statistic with the corresponding boundary values. You stop the trial to reject or accept the hypothesis, or you continue the trial to the next stage. If you continue the trial to the final stage, you either accept or reject the hypothesis.
- After the trial stops, you compute parameter estimates, confidence limits for the parameter, and a p-value for the hypothesis test.
Read About SAS /STAT ANOVA – 8 Procedures for Calculating Analysis of Variance
Procedures for Group Sequential Design and Analysis in SAS/STAT
The following procedures perform for SAS/STAT group sequential design and analysis of a sample data. Each procedure has a different syntax and is used with different type of data in different contexts. Let us explore each one of these.
a. PROC SEQDESIGN
The SEQDESIGN procedure is used at Step 2 of the analysis to compute the boundary values and required sample sizes for the trial. The boundary values are derived in such a way that the overall Type I and Type II error probability levels are maintained at the levels specified in the design.
PROC SEQDESIGN Syntax-
PROC SEQDESIGN <OPTIONS>;
PROC SEQDESIGN Example-
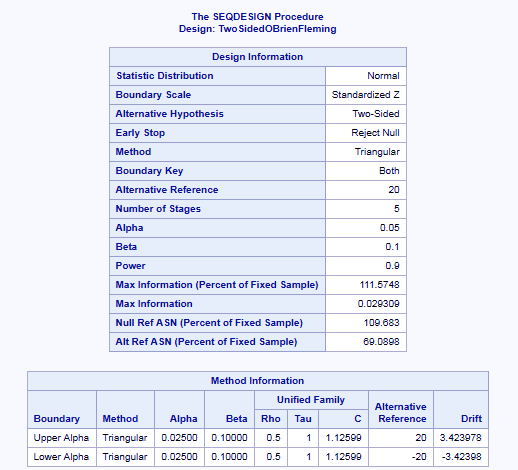
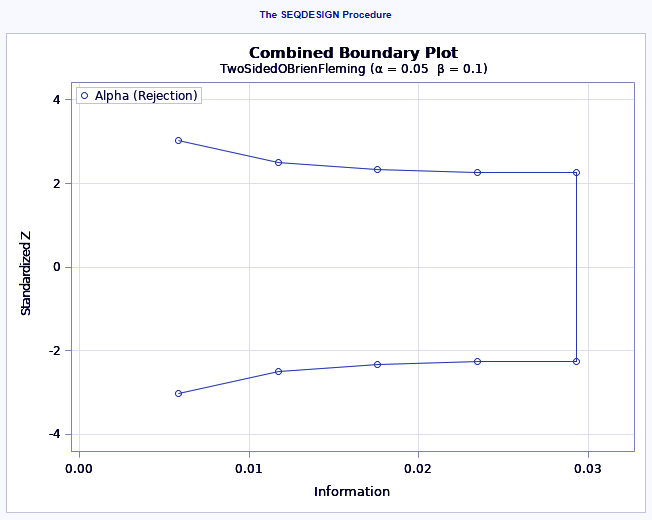
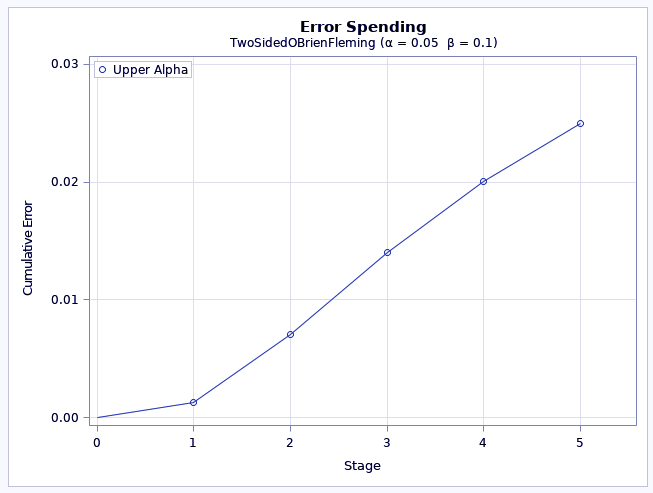
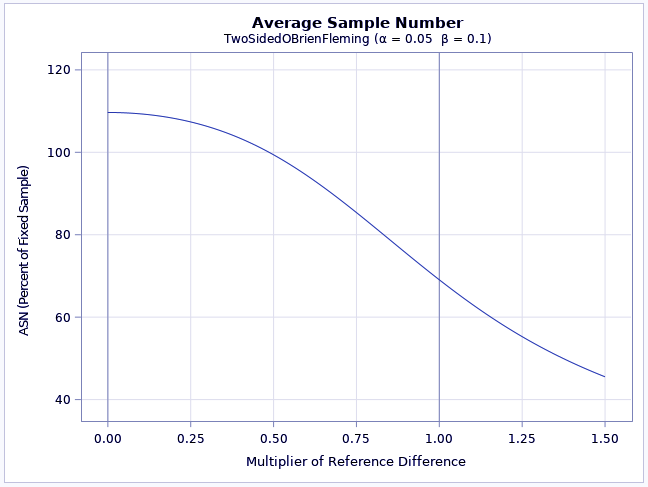
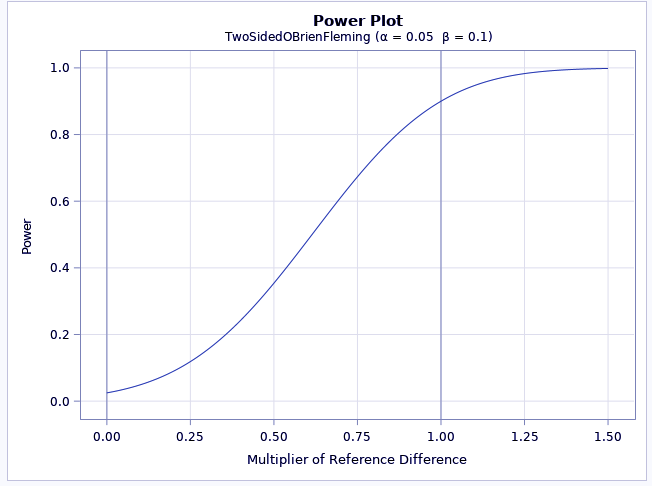
ods graphics on;
proc seqdesign altref=20
               plots=all
               ;
   TwoSidedOBrienFleming: design nstages=5
                          method=triangular
                          ;
   samplesize model=twosamplemean(stddev=20);
ods output Boundary=Bnd_LDL;
run;
The ALTREF= option specifies the alternative reference. The ALTREF=20 option implies a lower alternative reference of -20 and an upper alternative reference of 20.
Let’s Look at SAS/STAT Categorical Data Analysis Procedure
The label “TwoSidedOBrienFleming” identifies the design in the output.
The NSTAGES=5 option specifies the total number of stages, including four interim stages and a final stage.
SAS/STAT Group Sequential Design and Analysis – PROC SEQDESIGN
Read about 7 Simple SAS/STAT Cluster Analysis Procedures
SAS/STAT Group Sequential Design and Analysis – PROC SEQDESIGN
SAS/STAT Group Sequential Design and Analysis – PROC SEQDESIGN
SAS/STAT Group Sequential Design and Analysis – PROC SEQDESIGN
SAS/STAT Group Sequential Design and Analysis – PROC SEQDESIGN
SAS/STAT Group Sequential Design and Analysis – PROC SEQDESIGN
SAS/STAT Group Sequential Design and Analysis – PROC SEQDESIGN
b. PROC SEQTEST
The SEQTEST procedure is used at Step 5 of the analysis to compare the test statistic with its boundary values. The boundary tables created in the SEQDESIGN procedure are structured for input to the SEQTEST procedure. You also use the SEQTEST procedure at Step 6 to compute parameter estimates, confidence limits, and p-values after the trial stops.
Just Check Your Knowledge with Base SAS Interview Questions for 2018
PROC SEQTEST Syntax-
PROC SEQTEST <OPTIONS>;
PROC SEQTEST Example-
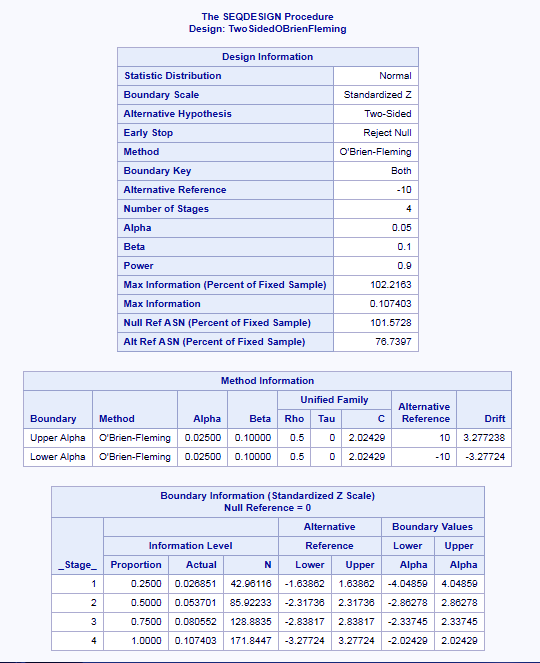
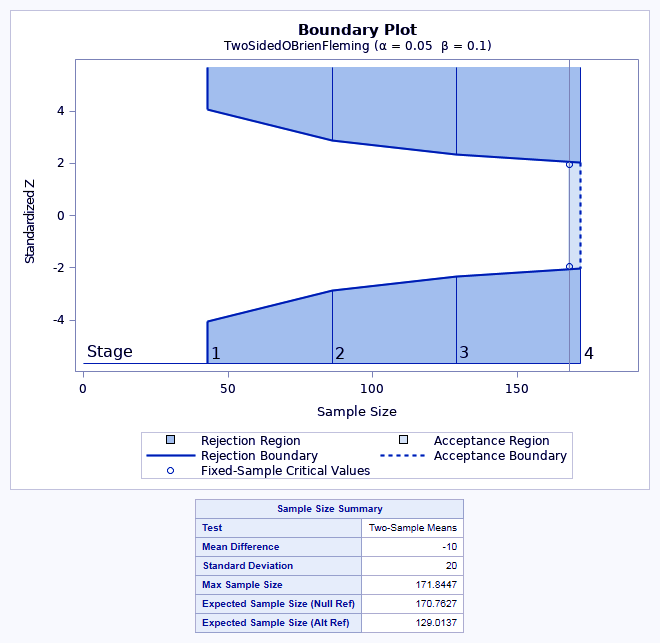
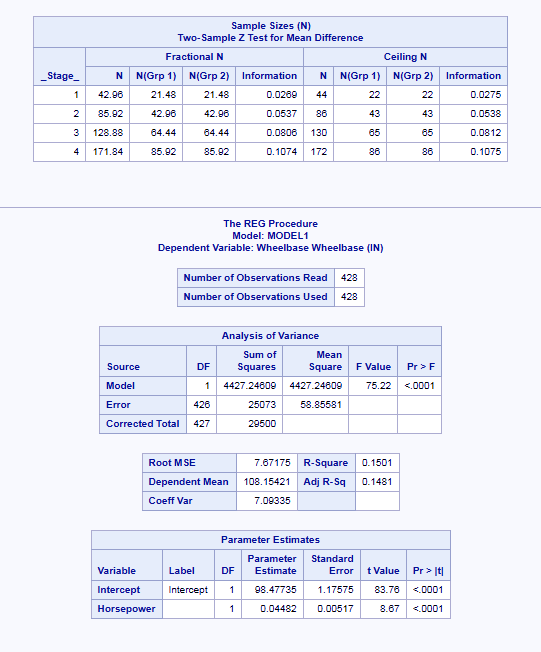
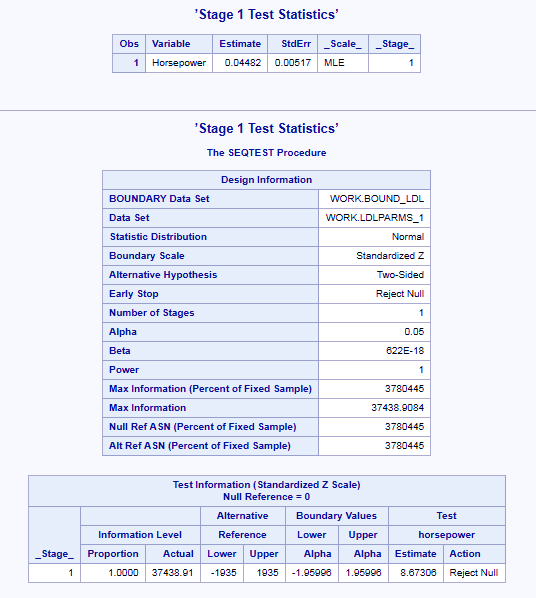
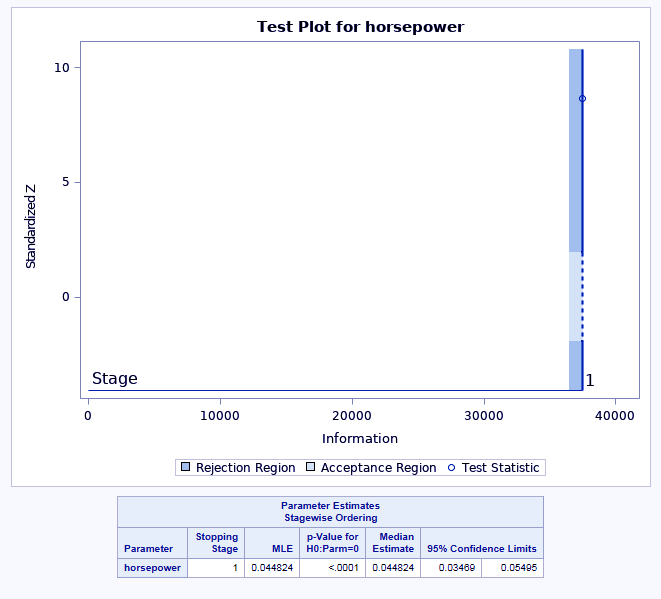
ods graphics on;
proc seqdesign altref=-10
boundaryscale=stdz
plots=boundary(hscale=samplesize)
;
TwoSidedOBrienFleming: design method=obf
alt=twosided stop=reject
nstages=4
alpha=0.05 beta=0.10
;
samplesize model=twosamplemean(stddev=20);
ods output Boundary=bound_ldl;
run;
ods graphics off;
proc reg data=sashelp.cars;
model wheelbase=horsepower;
ods output ParameterEstimates=parms_1;
run;
data ldlparms_1;
set parms_1;
if Variable='Horsepower';
keep _Scale_ _Stage_ Variable Estimate StdErr;
_Scale_='MLE';
_Stage_= 1;
run;
proc print data=ldlparms_1;
title ’Stage 1 Test Statistics’;
run;
ods graphics on;
proc seqtest boundary=bound_ldl
parms(testvar=horsepower)= ldlparms_1
order=stagewise
;
ods output test=tldl_1;
run;
ods graphics off;
The REG procedure is used to estimate the mean treatment difference and standard error at the first stage. Then we invoke the SEQTEST procedure to test for early stopping at the first stage. The BOUNDARY= option specifies the input data set that contains the boundary information generated by the SEQDESIGN procedure.
The PARMS= option specifies the input data set that contains the test statistic and standard error for each stage. The ORDER=STAGEWISE option specifies the sample space order.
SAS/STAT Group Sequential Design and Analysis – PROC SEQTEST
SAS/STAT Group Sequential Design and Analysis – PROC SEQTEST
SAS/STAT Group Sequential Design and Analysis – PROC SEQTEST
SAS/STAT Group Sequential Design and Analysis – PROC SEQTEST
SAS/STAT Group Sequential Design and Analysis – PROC SEQTEST
This was all about SAS/STAT Group Sequential Design and Analysis Tutorial. Hope you like our explanation.
Conclusion
So, this was a complete description and a comprehensive understanding of what is SAS/STAT group sequential design and analysis. We looked at each one of a procedure used for SAS/STAT group sequential design and analysis with their syntax, and examples.
In conclusion, we learn how STAT group sequential design can be used. Hope you all enjoyed it. Stay tuned for more interesting topics in SAS/STAT, and for any doubts, post it in the comments section below.
Relates Topic – SAS Online Quiz
For reference
Your 15 seconds will encourage us to work even harder
Please share your happy experience on Google


