Learn 7 Simple SAS/STAT Cluster Analysis Procedures
Interactive Online Courses: Elevate Skills & Succeed Enroll Now!
We looked at SAS/ STAT categorical data analysis in the previous tutorial, today we will be looking at SAS/STAT Cluster analysis and how Cluster Analysis is used in SAS/STAT for computing clusters between variables of our data.
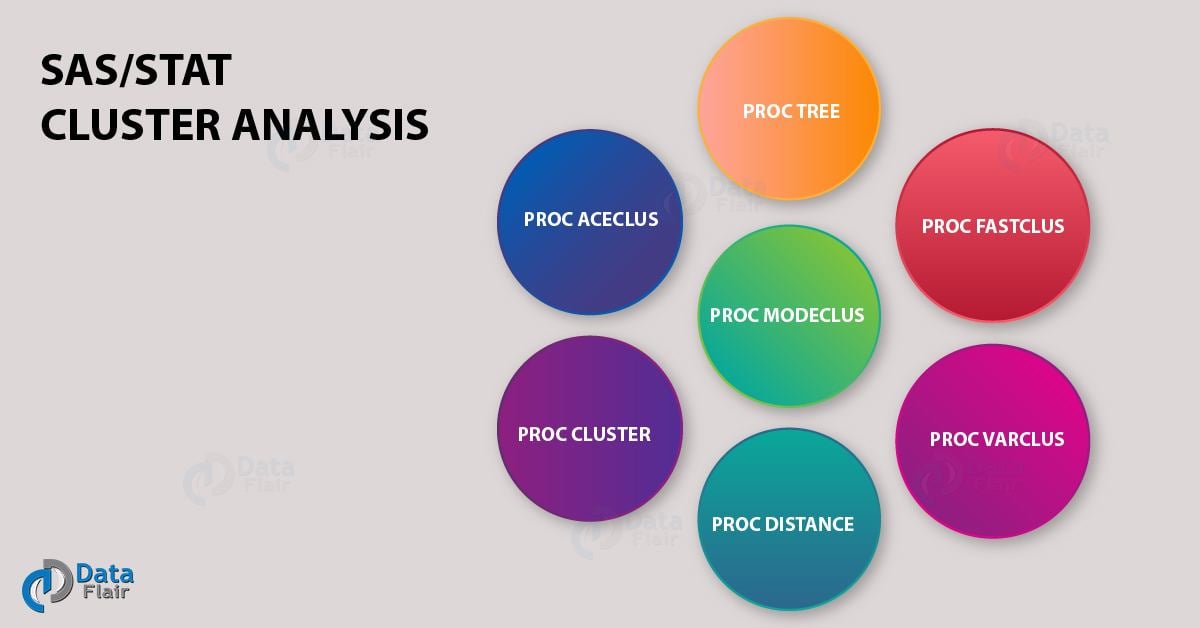
Our focus here will be to understand different procedures that can be used for Cluster analysis: PROC ACECLUS, PROC CLUSTER, PROC DISTANCE, PROC VARCLUS, PROC FASTCLUS
, PROC MODECLUS, and PROC TREE with syntax and examples.
So, let’s start with SAS/STAT Cluster Analysis.
SAS/STAT Cluster Analysis
SAS/STAT Cluster Analysis Procedure
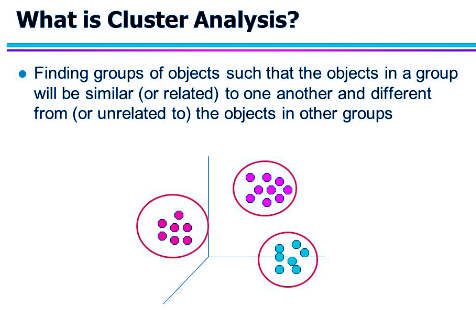
SAS/STAT Cluster Analysis is a statistical classification technique in which cases, data, or objects (events, people, things, etc.) are sub-divided into groups (clusters) such that the items in a cluster are very similar (but not identical) to one another and very different from the items in other clusters.
Cluster analysis is a discovery tool that reveals associations, patterns, relationships, and structures in masses of data.
Let’s Explore What is SAS/STAT Software in detail
A cluster is a collection of data objects that are very similar to one another nut different from other clusters. It finds its applications in the following fields.
- Marketing: Help marketers discover distinct groups in their customer bases, and then use this knowledge to develop targeted marketing programs
- City-planning: Identifying groups of houses according to their house type, value, and geographical location
- Earth-quake studies: Observed earthquake epicenters should be clustered along continent faults
SAS/STAT Cluster Analysis
Various Procedures for Cluster Analysis in SAS/STAT
SAS/STAT Cluster Analysis uses the following procedures for a sample data. Each procedure has a different syntax and is used with different type of data in different contexts. Let us explore each one of these.
Read About SAS/STAT Software Features
a. PROC ACECLUS
The PROC ACECLUS procedure in SAS/STAT Cluster Analysis is useful for processing data prior to the actual cluster analysis. In this, it attempts to estimate the pooled within-cluster covariance matrix from coordinate data without knowledge of the number or the membership of the clusters.
PROC ACECLUS outputs a data set containing canonical variable scores to be used in the SAS/STAT cluster analysis.
PROC ACECLUS Syntax-
PROC ACECLUS DATASET <OPTIONS>;
VAR <variable>;
PROC ACECLUS Example-
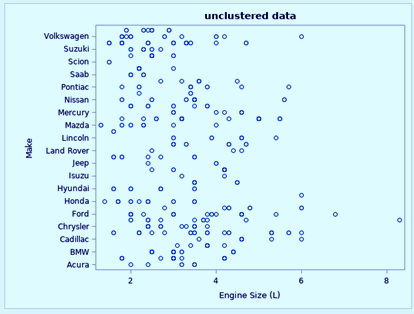
title'unclustered data';
proc sgplot data=sashelp.cars;
   scatter y=make x=enginesize;
run;
The plot displayed below shows that the clusters that comprise these data might be poorly separated and elongated. Data with poorly separated or elongated clusters must be transformed.
Let’s Discuss Advantages & Disadvantages of SAS/STAT Software
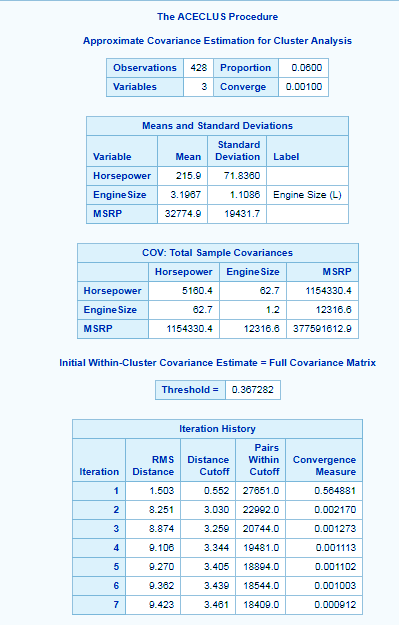
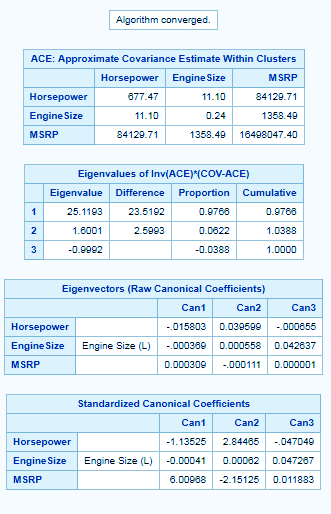
SAS/STAT Cluster Analysis – PROC ACECLUS
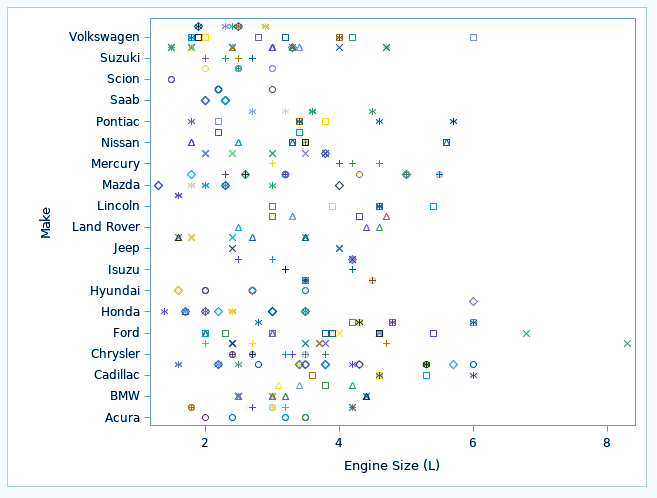
proc aceclus data=sashelp.cars  proportion=.06;
   var horsepower enginesize msrp ;
run;
proc sgplot data=sashelp.cars;
   scatter y=make x=enginesize / group=msrp;
   keylegend / title="Clustered data";
run;
The PROPORTION= option specifies that approximately 6 percent of the pairs are included in the estimation of the within-cluster covariance matrix.
The VAR statement specifies that the variables horsepower, engine size, and msrp are used in computing the canonical variables. The clustered data looks like the one shown below.
Read about – 8 Procedures for Calculating Analysis of Variance
SAS/STAT Cluster Analysis -PROC ACECLUS
SAS/STAT Cluster Analysis- PROC ACECLUS
SAS/STAT Cluster Analysis – PROC ACECLUS
b. PROC CLUSTER
The PROC CLUSTER procedure in SAS/STAT performs hierarchical clustering of observations using one of the eleven methods applied to coordinate data or distance data. SAS/STAT clustering methods are: average linkage, the centroid method, complete linkage, density linkage and many more.
PROC CLUSTER displays a history of the clustering process, showing statistics useful for estimating the number of clusters in the population from which the data are sampled.
Let’s Look at 6 SAS/STAT Bayesian Analysis Procedures You Must Know
PROC CLUSTER Syntax-
PROC CLUSTER dataset <OPTIONS>;
Var <VARIABLES>;
Only the PROC CLUSTER statement is required statement. Usually, only the VAR statement and sometimes the ID and COPY statements are needed in addition to the PROC CLUSTER statement
PROC CLUSTER Example-
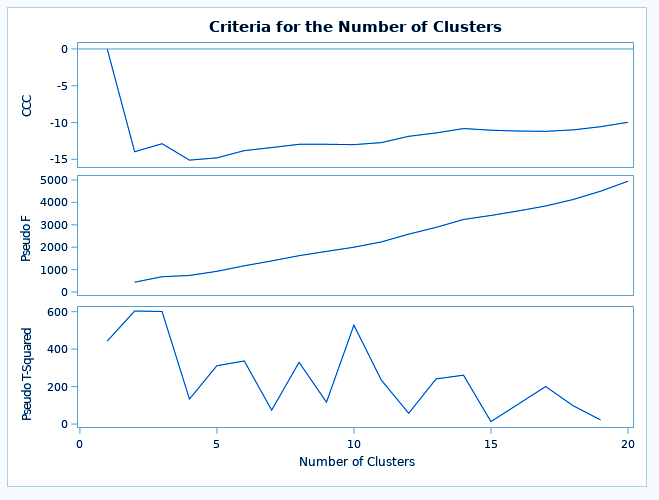
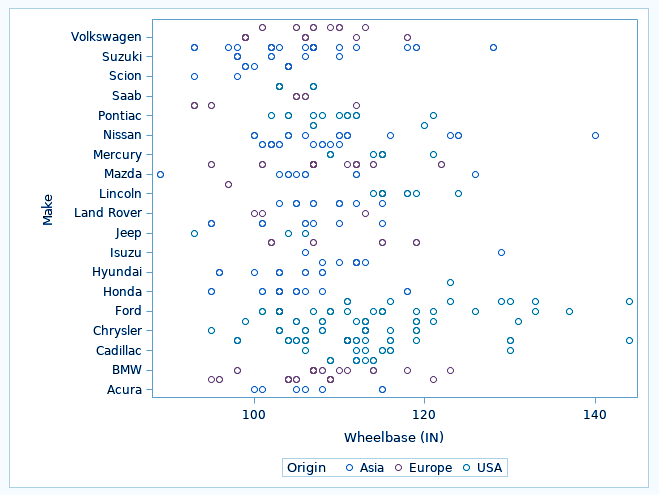
ods graphics on;
proc cluster data=SASHELP.CARS method=ward ccc pseudo PRINT=20 plots=den(height=rsq);
            var Wheelbase;
            id make;
run;
proc sgplot data=sashelp.cars;
   scatter y=make x=wheelbase / group=origin;
run;
The CCC option displays the cubic clustering criterion, and the PSEUDO option displays pseudo F and t2 statistics. The PRINT=20 option displays only the last 20 generations of the cluster history.
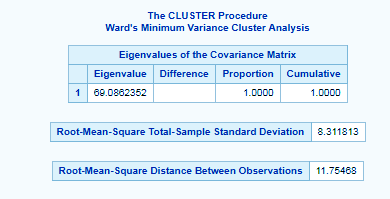
SAS/STAT Cluster Analysis – PROC CLUSTER
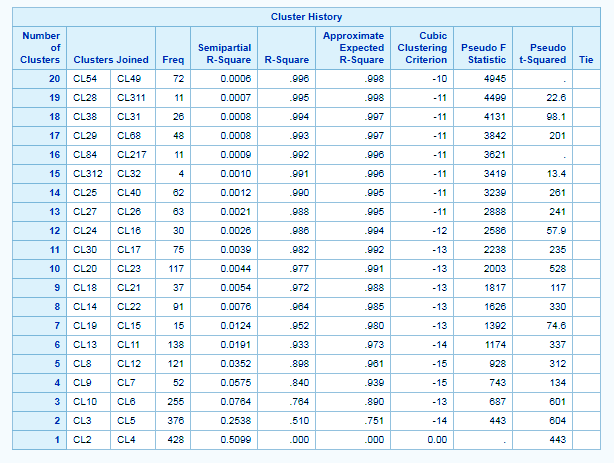
SAS/STAT Cluster Analysis – PROC CLUSTER
SAS/STAT Cluster Analysis – PROC CLUSTER
SAS/STAT Cluster Analysis – PROC CLUSTER
c. PROC DISTANCE
The PROC DISTANCE procedure in SAS/STAT computes various measures of distance, dissimilarity, or similarity between the rows (observations) of an input SAS data set, which can contain numeric or character variables, or both.
PROC DISTANCE Syntax-
PROC distance  dataset method=OPTIONS;
     Var <measurement levels> < variable>;
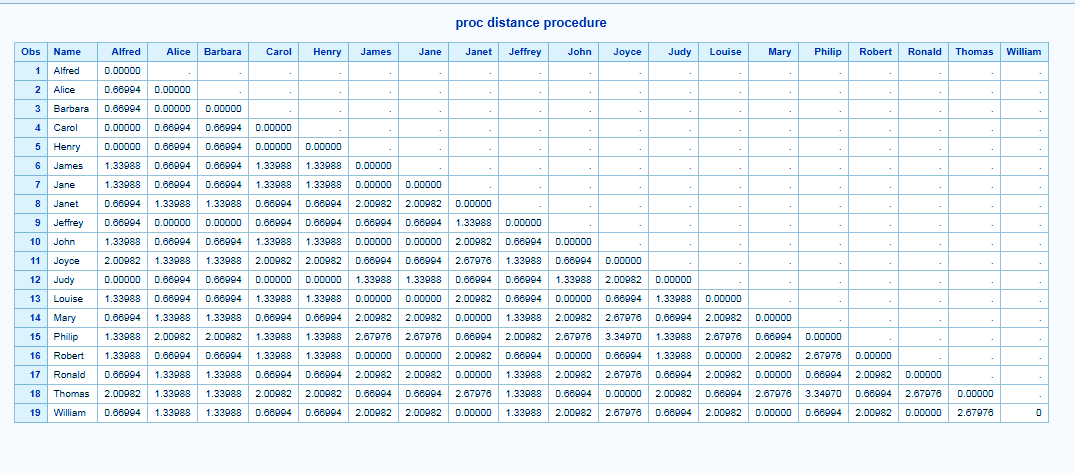
PROC DISTANCE Example-
title'proc distance procedure';
proc distance data=SASHELP.CLASS method=euclid out=distance;
            var interval(Age / std=std);
            id name;
run;
proc print data=distance;
RUN;
Let’s Create SAS Pie Chart
Here, the METHOD=EUCLID option requests that Euclidean distances (which is the default) should be computed.
The VAR statement lists the variable age along with their measurement level to be used in SAS/STAT Cluster analysis. An interval level of measurement is assigned to the age variable.
SAS/STAT Cluster Analysis – PROC DISTANCE
d. PROC VARCLUS
The PROC VARCLUS procedure in SAS/STAT performs clustering of variables, it divides a set of variables by hierarchical clustering. For example, a test might contain 50 items. PROC VARCLUS can be used to divide the items into, say, five clusters. Each cluster can then be treated as a subtest, with the subtest scores given by the cluster components.
Let’s Discuss SAS Arithmetic Mean – PROC MEANS
Proc VARCLUS Syntax-
PROC varclus dataset;
VAR <VARIABLE>;
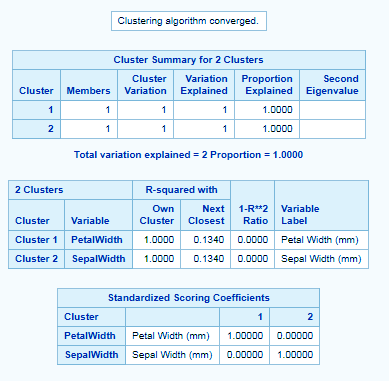
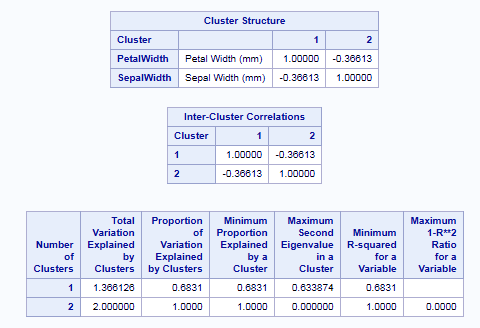
Proc VARCLUS Example-
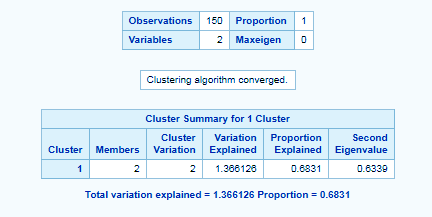
proc varclus data=SASHELP.IRIS MAXCLUSTERS=4;
            var PetalWidth SepalWidth;
run;
The MAXCLUSTERS=4 option specifies that no more than four clusters be computed.
SAS/STAT Cluster Analysis – PROC VARCLUS
SAS/STAT Cluster Analysis – PROC VARCLUS
SAS/STAT Cluster Analysis – PROC VARCLUS
Let’s Discuss One More SAS Software – IML Software
e. PROC FASTCLUS
The FASTCLUS SAS/STAT cluster analysis procedure performs k-means clustering on the basis of distances computed from one or more variables. (numeric). PROC FASTCLUS is especially suitable for large data sets. By default, the FASTCLUS procedure uses Euclidean distances.
This kind of clustering method is often called a k-means model. The observations are divided into clusters such that every observation belongs to one and only one cluster.
PROC FASTCLUS Syntax-
PROC FASTCLUS dataset;
   Var <variables>;
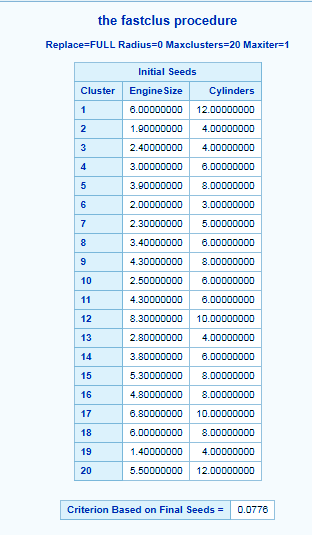
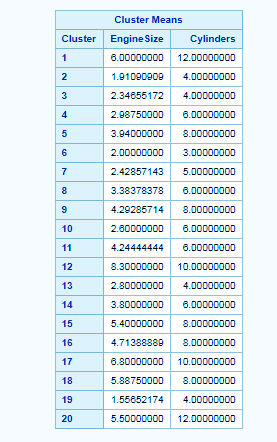
PROC FASTCLUS Example-
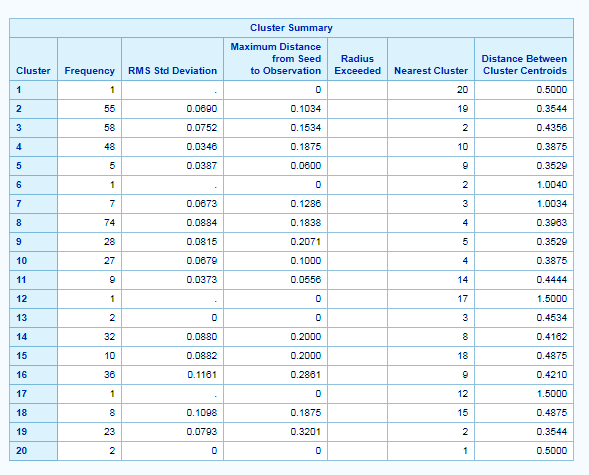
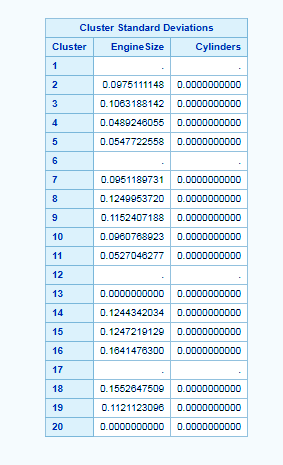
title'the fastclus procedure';
proc fastclus data=sashelp.cars maxclusters=20;
            var EngineSize Cylinders;
run;
You need only the VAR statement in addition to the PROC FASTCLUS statement.
SAS/STAT Cluster Analysis – PROC FASTCLUS
SAS/STAT Cluster Analysis – PROC FASTCLUS
SAS/STAT Cluster Analysis – PROC FASTCLUS
SAS/STAT Cluster Analysis – PROC FASTCLUS
SAS/STAT Cluster Analysis – PROC FASTCLUS
f. PROC MODECLUS
The PROC MODECLUS procedure in SAS/STAT performs clustering by implementing several clustering methods instead of one. You do not tell PROC MODECLUS how many clusters you want. Instead, you specify a smoothing parameter and, optionally, a significance level, and PROC MODECLUS determines the number of clusters.
Let’s check your Knowledge with Top 30 SAS Interview Questions and Answers
PROC MODECLUS Syntax-
PROC MODECLUS  dataset;
   VAR < VARIABLES>;
The PROC PHREG and MODEL statements required statements.
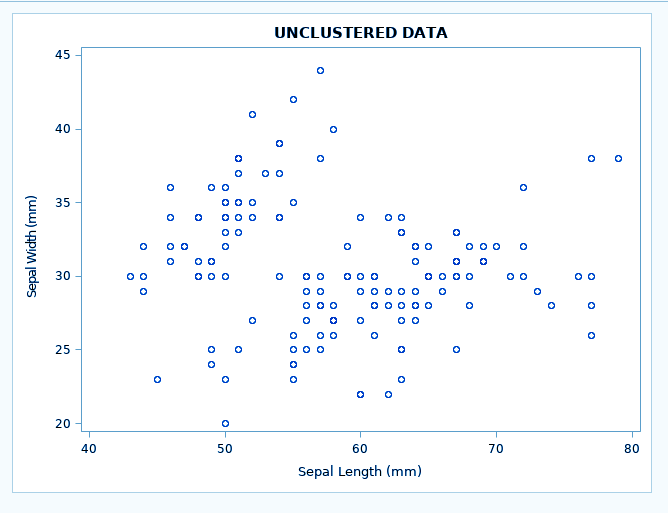
PROC MODECLUS Example-
proc modeclus data=SASHELP.IRIS method=1 r=5 10 25 out=out;
run;
proc sgplot;
   scatter y=SEPALWIDTH x=SEPALLENGTH;
   TITLE'UNCLUSTERED DATA';
run;
To obtain a cluster analysis in PROC MODECLUS, you must specify the METHOD= option; for most purposes, METHOD=1 recommended.
The cluster analysis can perform with a list of radii (R=5 10 325).
SAS/STAT Cluster Analysis – PROC MODECLUS
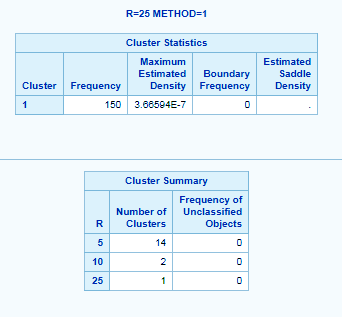
SAS/STAT Cluster Analysis – PROC MODECLUS
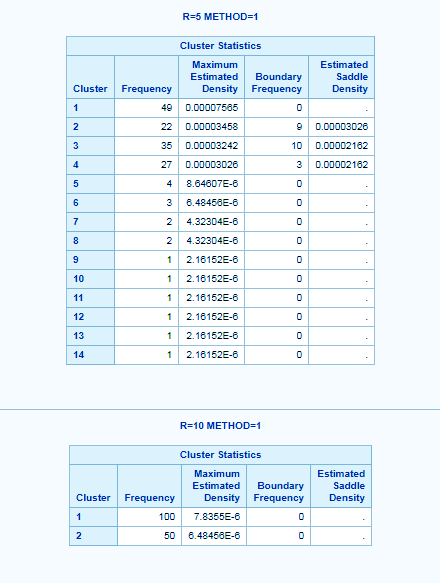
SAS/STAT Cluster Analysis – PROC MODECLUS
proc sgplot data=SASHELP.IRIS;
   scatter y=SEPALWIDTH x=SEPALLENGTH / group=PETALLENGTH ;
  TITLE'CLUSTERED DATA';
run;

SAS/STAT Cluster Analysis- PROC MODECLUS
Read About SAS Chi-Square Test – SAS PROC FREQ
g. PROC TREE
The PROC TREE SAS/STAT cluster analysis procedure draws tree diagrams, also called dendrograms or phenograms, using an output from the CLUSTER or VARCLUS procedures. PROC TREE can also create a dataset indicating cluster membership at any specified level of the cluster tree.
PROC TREE Syntax-
PROC TREE dataset;
If the input data set has created by CLUSTER or VARCLUS, the only statement required is the PROC TREE statement.
PROC TREE Example-
title 'proc tree procedure';
ods graphics on;
proc cluster data=sashelp.iris method=twostage print=15
             outtree=tree k=5 ;
   var SepalLength SepalWidth PetalLength PetalWidth;
   copy Species;
run;
proc tree data=tree horizontal lineprinter pages=1 maxh=10;
   id species;
run;
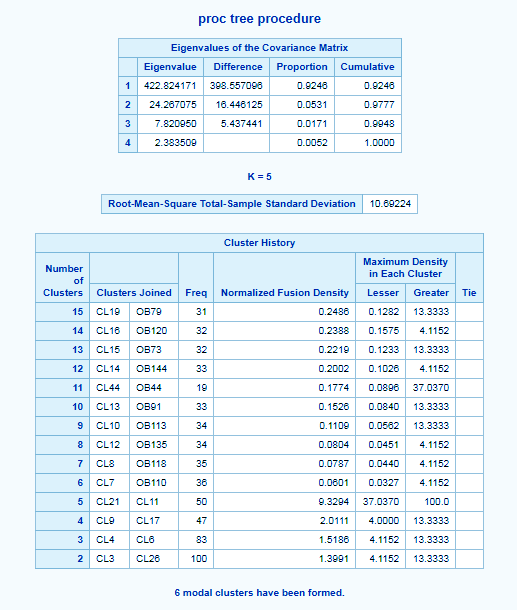
SAS/STAT Cluster Analysis – PROC TREE
This was all about SAS/STAT Cluster Analysis Tutorial. Hope you like our explanation of Various Procedures for Cluster Analysis in SAS/STAT.
Let’s explore more with SAS Online Quiz
Conclusion
So, this was a complete description and a comprehensive understanding of SAS/STAT Cluster analysis Procedure. We look at each one of them: PROC ACECLUS, PROC CLUSTER, PROC DISTANCE, PROC VARCLUS, PROC FASTCLUS
, PROC MODECLUS, and PROC TREE with their syntax, and how they can use. Hope you all enjoyed it. Stay tuned for more interesting topics and for any doubts, post it in the comments section below.
Related Topic- FIRST. and LAST. Variables in SAS
You give me 15 seconds I promise you best tutorials
Please share your happy experience on Google


The output is always numerical for Id in cluster analysis makin a tree. How can I changed it to word