SAS Standard Deviation – Ways of Measure Standard Deviation
Job-ready Online Courses: Knowledge Awaits – Click to Access!
In our previous article, we discuss SAS Cross Tabulation and SAS Frequency Distribution. Now we will be looking at another statistical procedure today, that is SAS Standard Deviation. We will discuss two types of procedure in which we can apply standard deviation to our data.
Moreover, we will see different ways to measure SAS Standard Deviation; SAS PROC MEANS & SAS PROC SURVEYMEANS.
So, let’s start with SAS Standard Deviation.
SAS Standard Deviation
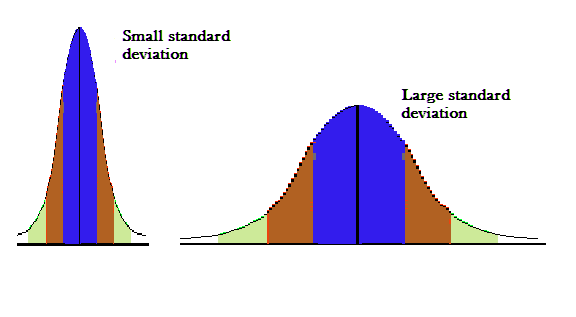
SAS Standard deviation (SD) is a measure of how varied is the data in a given dataset. Mathematically, it tells you the closeness of each data point with the mean of the dataset.
If the value of standard deviation is close to 0, it indicates that the data points are very close to the mean of the data set and a high standard deviation indicates that the data is spread and the data points are spread out over a wide range of values.
Example of SAS Standard Deviation
Ways of Measuring SAS Standard Deviation
Here, we will discuss two types of Standard deviation in SAS programming language.
a. SAS Standard Deviation Using PROC MEANS
We saw SAS PROC MEANS in the earlier tutorial to find arithmetic mean of our data. You can measure the Standard Deviation using proc means, you have to choose the STD option in the PROC step. It will display the Standard Deviation values for each numeric variable in the dataset.
Syntax-
PROC MEANS DATA = dataset STD;
Example-
To do this let us use PROC SQL procedure. Let us group the data using ‘type’ and ‘make’ of cars and calculate the standard deviation for selected variables using the STD option with the PROC means step.
PROC SQL;
create table CARS1 as
SELECT make,type,horsepower,cylinders,weight
FROM
SASHELP.CARS
WHERE make in ('Audi','BMW')
;
RUN;
PROC MEANS DATA=CARS1 STD;
Run;
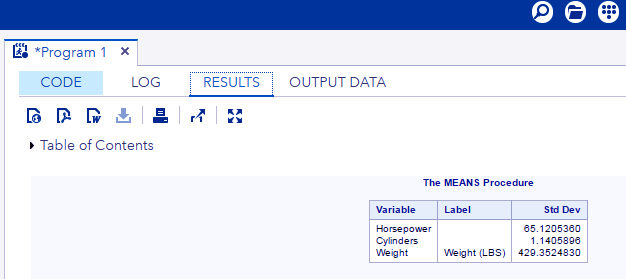
SAS Standard Deviation Using PROC MEANS
b. SAS Standard Deviation Using PROC SURVEYMEANS
In this statement, you identify the data set to be analyzed, specify the variance estimation method, and provide sample design information.
Syntax-
PROC SURVEYMEANS options statistic-keywords;
By variables;
Class variables;
Var variables;
Example-
PROC SURVEYMEANS DATA=CARS1 STD;
Class type;
Var type horsepower;
ods output statistics=rectangle;
Run;
PROC PRINT DATA=rectangle;
Run;
The images below shows the output of the code above. It shows a distribution of data for variable ‘Horsepower’ for 95% confidence interval which means that there is a probability that the spread of the data is within 95% of this.
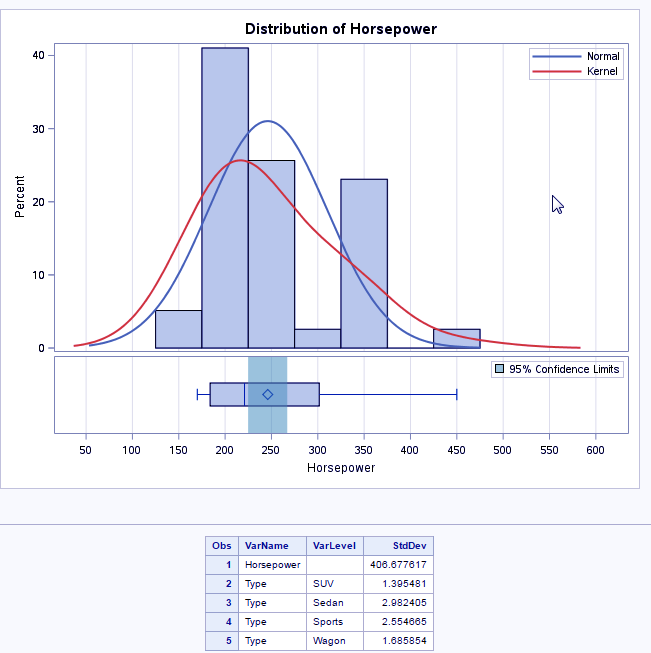
SAS Standard Deviation Using PROC SURVEYMEANS
i. Using BY option to group standard deviation
We grouped data to find meaning in the proc means tutorial, we can do the same for standard deviation also.
Example-
PROC SURVEYMEANS DATA=CARS1 STD;
Var  horsepower;
BY make= ‘BMW’;
Run;
proc print data=CARS1;
run;
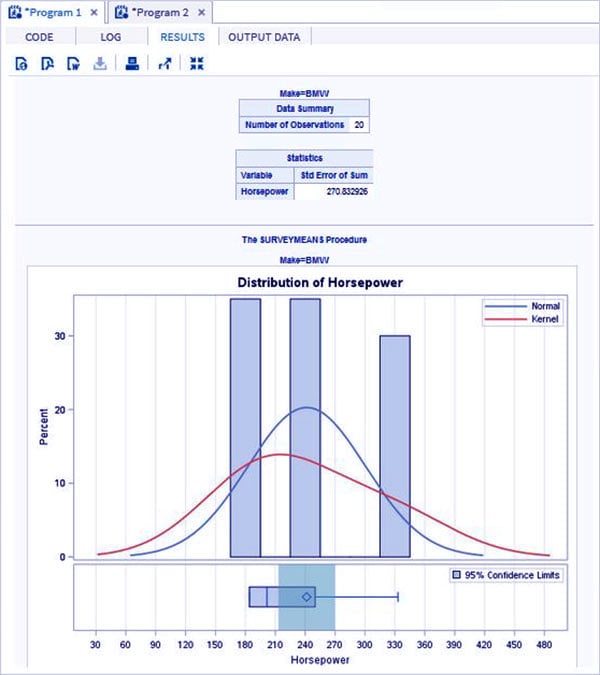
BY option to group standard deviation
This was all in SAS Standard Deviation Tutorial. Hope you like our explanation.
Conclusion
Hence, you understood What is SAS Standard Deviation and how we can calculate standard deviation using two procedures the SAS PROC MEANS procedure and the SAS PROC SURVEYMEANS procedure.
Also, the use of BY statement for better analysis of our data. We will learn more interesting statistical procedures in the coming tutorials. For any queries post your doubts in the comments section below.
Did you like our efforts? If Yes, please give DataFlair 5 Stars on Google


