SAS Boxplot – Explore the Major Types of Boxplots in SAS
Placement-ready Courses: Enroll Now, Thank us Later!
In the last tutorials, we learned how to create SAS histograms, pie charts, bar charts and scatter plots for analysis and representation of data. Now, we will look at another interesting way in which we can present data, that is SAS boxplots.
We will look at how to create a Boxplot in SAS and the different types of box plots in SAS Programming Language. Lastly, we will discuss some SAS Boxplot examples and SAS Sgplot & SAS gplot boxplot in detail.
So, let’s start the tutorial.
What is a SAS Boxplot?
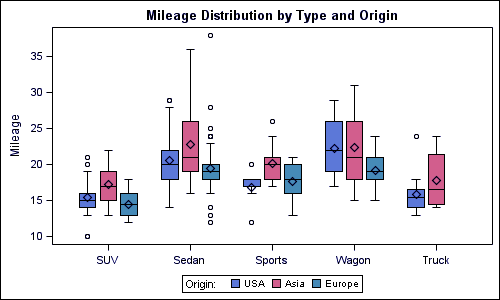
A BOXPLOT in SAS creates side-by-side box-and-whiskers plots of measurements organized in groups. A box-and-whiskers plot displays the mean, quartiles, and minimum and maximum observations for a group. Below image shows how a SAS boxplot looks like:
PROC SGPANEL and SGPLOT Procedures
We saw how sgplot is used to create bar charts in SAS, the same can be used to create box plots too. In addition to this, we also have the PROC SGPANEL to create box plots in SAS.
Syntax-
PROC SGPLOT  DATA=DATASET;
         VBOX VARIABLE / category = VARIABLE;
RUN;
PROC SGPANEL  DATA=DATASET;;
PANELBY VARIABLE;
  VBOX VARIABLE> / category = VARIABLE;
RUN;
The PROC SGPANEL statement identifies the data set that contains the plot variables.
Simple Boxplot in SAS
In this type of SAS boxplot, we choose a variable from a dataset that represents a category and other variables whose values get categorized in as many numbers of groups as the number of distinct values in the second variable.
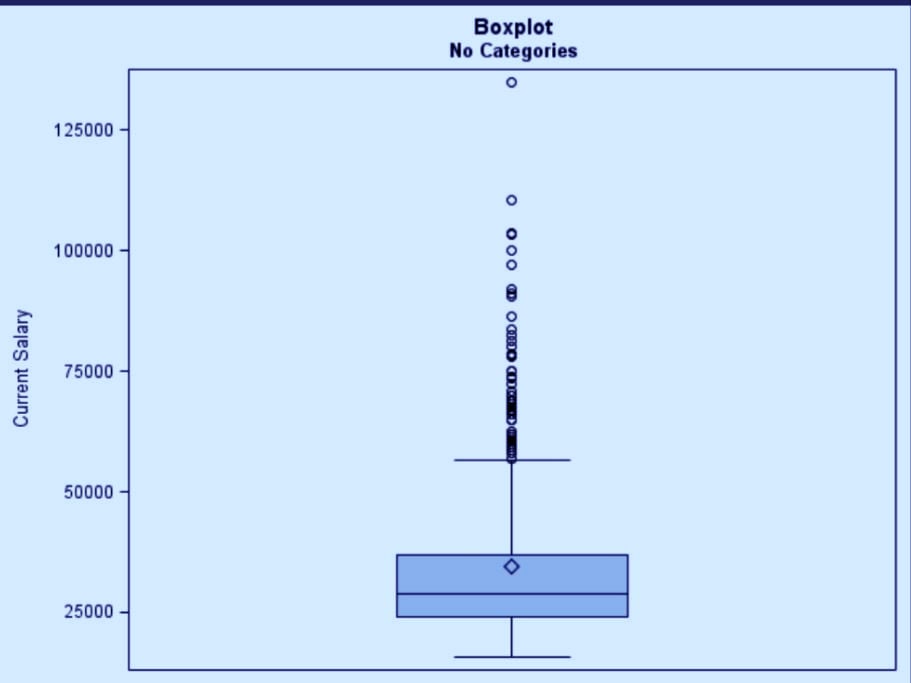
SAS boxplot without any category:
Example-
proc sgplot data=mylib.employee;
 vbox salary;
 run;
A boxplot with the category:
Example-
proc sgplot data=mylib.employee;
vbox salary/ category=gender;
 run;

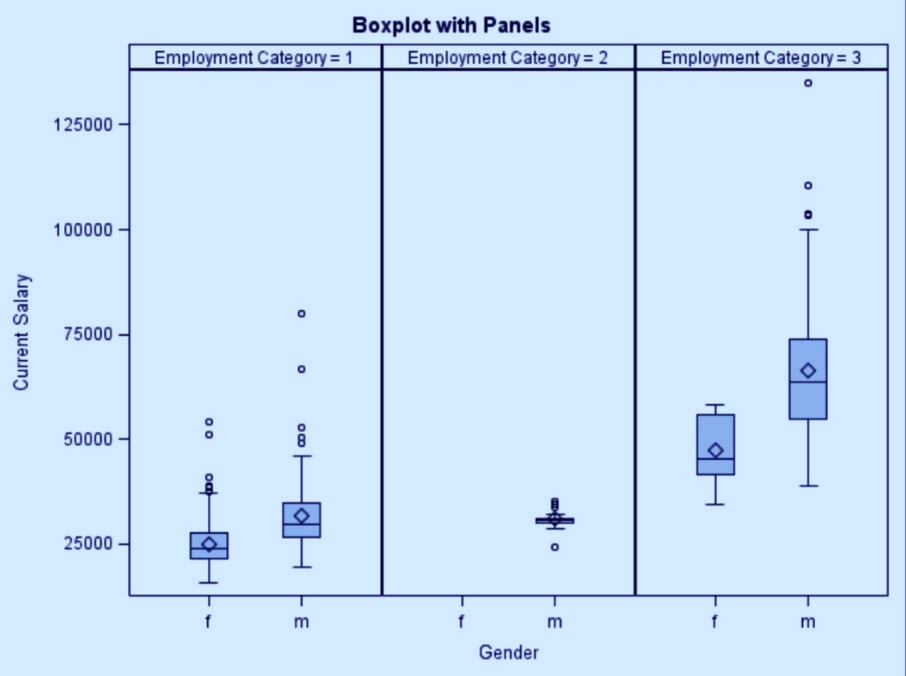
SAS Boxplot in Vertical Panels
This SAS boxplot is a group using another third variable which divides the graph into multiple panels. We can divide the boxplots of a variable into many vertical panels(columns). Each panel holds the box plots for all the categorical variables.
Example-
proc sgpanel data=mylib.employee;
panelby jobcat / rows=1 columns=3 ;
vbox salary / category= gender;
run;
SAS Boxplot in Horizontal Panels
This is very similar to vertical panels Boxplot. In this SAS boxplot, a variable is divided into rows. Like vertical, in this also we categorize the data upon a third variable.
Example-
proc sgpanel data=sashelp.heart;
panelby sex / columns=1;
hbox cholesterol / category=ageatstart ;
title ‘ Cholestrol by Sex and Age Group’;
 run;
Summary
In this SAS tutorial, we understood what is a boxplot in SAS, how can we create a SAS box plot and what are the ways of presenting a box plot. Stay tuned for more interesting topics and for any queries, post your doubts in the comments section below.
If you are Happy with DataFlair, do not forget to make us happy with your positive feedback on Google


What is the code used to create the boxplot in #2?
is there a way to add an overall plot in any of the graphs? for example, salary by gender so the plot starts with an overall salary followed by salary by male & female.