SAS/STAT Categorical Data Analysis Procedure
Placement-ready Online Courses: Your Passport to Excellence - Start Now
In our SAS/STAT Software Tutorial, we looked at Bayesian analysis and the procedures used for performing it. Today, we will be looking at SAS/STAT Categorical Data Analysis and how it is used in SAS/STAT for computing different models. Our focus here will be to understand different procedures that can be used for Categorical data analysis in SAS/STAT Software through the use of examples.
So let’s start with SAS/STAT Categorical Data Analysis Procedure.
An Introduction to SAS/STAT Categorical Data Analysis
Categorical data is a data in which observations are classified as belonging to one or two categories. For example, an item might be judged as good or bad, or a response to a survey might include categories such as agree, disagree, or no opinion.
In this SAS/STAT categorical data analysis, the distribution of a categorical variable is described by its frequency and proportion rather than by its mean and variance. Statistical methods (i.e., t-test, correlation ) designed for continuous dependent variables are not adequate for analyzing categorical dependent variables.
Let’s Learn SAS/STAT Software Features
Some common techniques used to analyze categorical data are frequency tables, contingency tables, charts and different tests like a test of proportion and chi-square tests.
The decision on how to analyze categorical variables is often based on:
– The measurement level and number of categories independent variables
– The measurement level and number of categories in independent variables
– Sample size
– Number of independent variables
SAS/STAT Categorical Data Analysis
Procedures for Performing Categorical Data Analysis in SAS/STAT
SAS/STAT uses the following procedures to compute categorical data analysis of a sample data. Each SAS/STAT categorical data analysis procedure has a different syntax and is used with different type of data in different contexts. Let us explore each one of these Data Analysis Procedure in SAS/STAT.
Read about SAS/STAT Software Advantages & Disadvantages
a. SAS PROC LOGISTIC
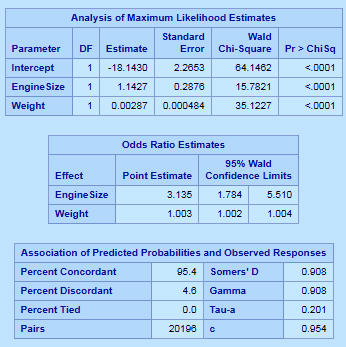
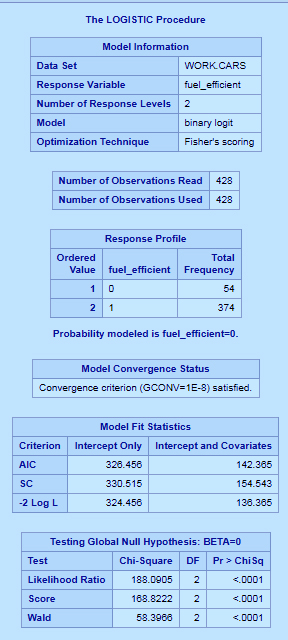
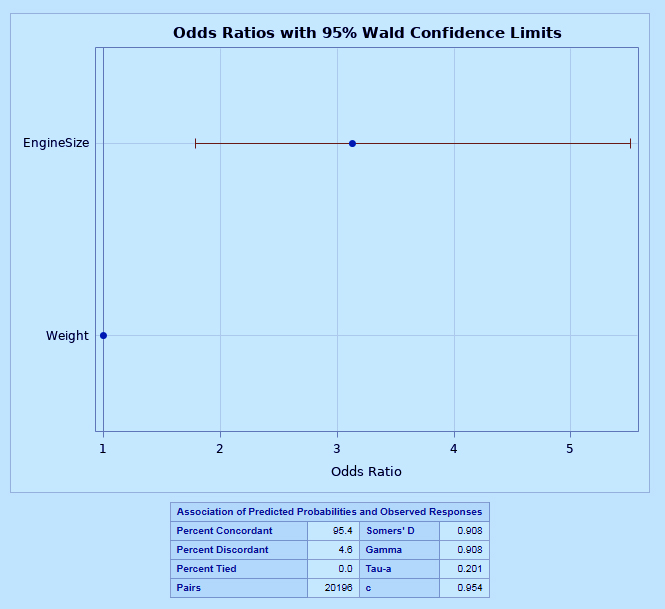
The PROC LOGISTIC procedure in SAS/STAT performs a logistic regression of data. Logistic regression analysis is used to investigate the relationship between the discrete responses and a set of explanatory variables. The LOGISTIC procedure fits linear logistic regression models by the method of maximum likelihood.
In the below example we will be examining the effect of engine size and weight on fuel efficiency.
SAS PROC LOGISTIC Syntax-
PROC LOGISTIC DATASET;
CLASS variable;
MODEL variable = effects;
oddsratio variable;
SAS PROC LOGISTIC Example-
data cars;
set sashelp.cars;
if mpg_highway <21 then fuel_efficient=0;
else fuel_efficient=1;
run;
ods graphics on;
proc logistic data=cars;
model fuel_efficient= enginesize weight;
oddsratio fuel_efficient;
run;
The PROC LOGISTIC and MODEL statements are required statements. The ODDSRATIO statement produces odds ratios for variables.
Let’s Explore SAS Variable – Types & Creating Variables in SAS
SAS/STAT Categorical Data Analysis – SAS PROC LOGISTIC
SAS/STAT Categorical Data Analysis – SAS PROC LOGISTIC
SAS/STAT Categorical Data Analysis – SAS PROC LOGISTIC
b. SAS PROC PROBIT
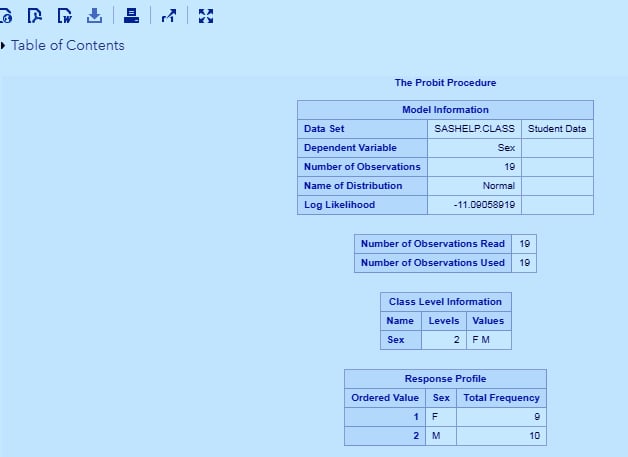
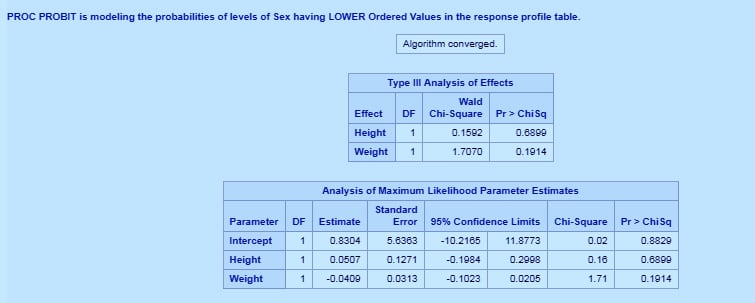
The PROC PROBIT procedure in SAS/STAT is used for performing regression. It can be used only for dependent variables that are, variables that can take up only two values. In this, we intend to find out the probability that the dependent variable will fall into any one of the two categories.
Let’s Discuss Different Ways of Measuring Standard Deviation
SAS PROC PROBIT Syntax-
PROC PROBIT dataset;
CLASS <dependent variables>;
Model< dependent variables>= <independent VARIABLES>;
In the below example, the DATA= option specifies the dataset that will be studied.
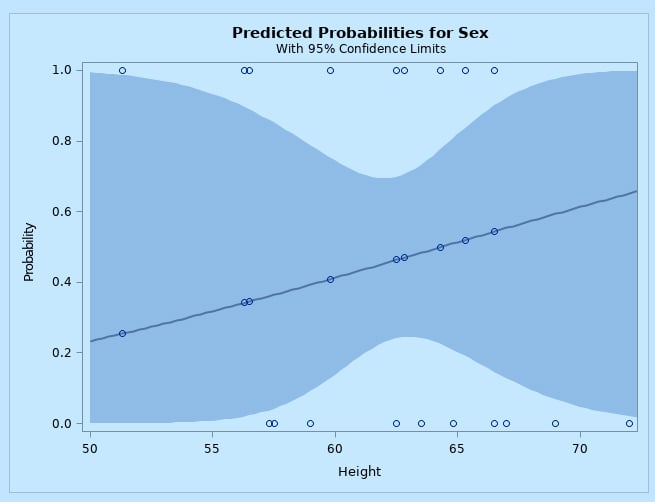
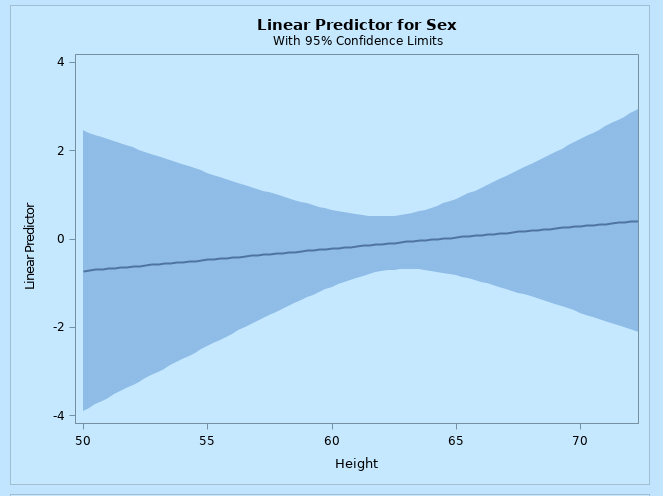
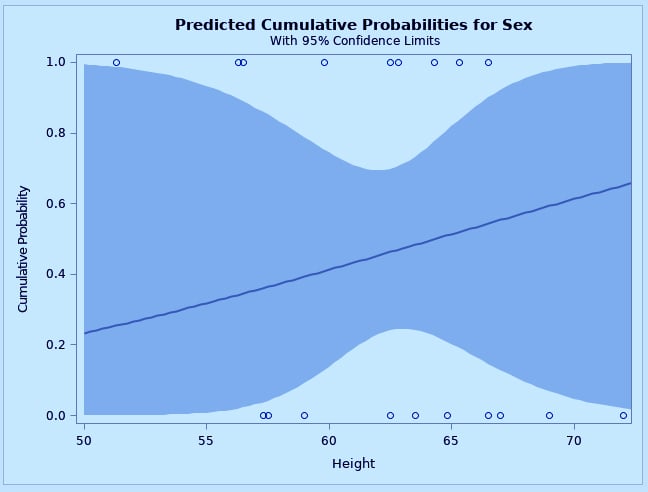
The PLOTS= option in the PROC PROBIT statement, together with the ODS GRAPHICS statement, requests all plots (because all has been specified in brackets, we can choose a specific plot also) for the estimated probability values and height levels.
The MODEL statement prepares a response between a dependent variable and independent variables. The variables height and weight are the stimuli or explanatory variables.
The OUTPUT statement creates a new data set, ABC, that contains all the variables in the original data set, and a new variable, prob, that represents the predicted probabilities.
In the first output, SAS/STAT displays background information about the model fit. Included are the name of the input data set, the response variables used, and the number of observations, events, and trials.
Read About SAS Arithmetic Mean – SAS PROC MEANS
The different plot options that can be specified with PLOTS= option are-
- CDFPLOT
- IPPPLOT
- PREDPLOT
- LPREDPLOT
- ALL
- NONE
SAS PROC PROBIT Example-
ods graphics on;
proc probit data=sashelp.class  plots=all;
class sex;
model sex =  height weight;
output out=abc  p=prob;
run;
SAS/STAT Categorical Data Analysis – SAS PROC PROBIT
SAS/STAT Categorical Data Analysis – SAS PROC PROBIT
SAS/STAT Categorical Data Analysis – SAS PROC PROBIT
SAS/STAT Categorical Data Analysis – SAS PROC PROBIT
SAS/STAT Categorical Data Analysis – SAS PROC PROBIT
c. SAS PROC GENMOD
The PROC GENMOD provides Bayesian analysis for distributions like binomial, gamma, Gaussian, normal and Poisson. It also provides Bayesian analysis for links like identity, log, logit, probit etc. In a Bayesian analysis, the model parameters are treated as random variables, and inference about parameters is based on the posterior distribution of the parameters, given the data.
We already discussed it in the last SAS/STAT Bayesian Analysis tutorial. You can refer to the same.
d. SAS PROC CATMOD
The PROC CATMOD procedure in SAS/STAT performs modeling of categorical data that can be represented by a contingency table. PROC CATMOD specializes in WLS modeling and analysis of a wide range of models. SAS PROC CATMOD fits linear models to functions of response frequencies.
We already discussed it in the last SAS/STAT Analysis of Variance tutorial. You can refer to the same.
e. SAS PROC FMM
The PROC FMM procedure in SAS/STAT fits statistical models to data for which the distribution of the response is a finite mixture of distributions—that is, each response is drawn with unknown probability from one of several distributions. We already discussed it in the last SAS/STAT Bayesian Analysis tutorial. You can refer to the same.
Let’s Look At SAS Bland-Altman Analysis or Plot
f. SAS PROC FREQ
The SAS PROC FREQ procedure prints all values of a given categorical variable in the Output window, along with the number and percentage of times each value appears. The FREQ procedure can work with both string (character) and numeric categorical variables.
We have already discussed this procedure in detail. You can refer to the following link for the complete tutorial.
This was all about SAS/STAT Categorical Data Analysis Procedure Tutorial. Hope you like our explanation.
Conclusion
Hence, this was a complete description and a comprehensive understanding of all the SAS/STAT Categorical Data Analysis Procedure. We looked at each of them: SAS PROC LOGISTIC, SAS PROC PROBIT, SAS PROC GENMOD, SAS PROC CATMOD, SAS PROC FMM, and SAS PROC FREQ with their syntax, and how they can be used.
Hope you all enjoyed it. Stay tuned for more. Furthermore, if you have any query, feel free to ask in a comment section.
Related Topic- Top 30 SAS Interview Questions and Answers
If you are Happy with DataFlair, do not forget to make us happy with your positive feedback on Google


