SAS One Way ANOVA – SAS PROC ANOVA
FREE Online Courses: Elevate Your Skills, Zero Cost Attached - Enroll Now!
We looked at SAS T-test in the previous tutorial, today we will be looking at a similar statistical procedure called SAS ANOVA (analysis of variance) and how it is used in SAS Programming for comparing means across multiple samples.
Our focus here will be to understand SAS One Way ANOVA with example and SAS PROC ANOVA Procedure.
Let’s start SAS One Way ANOVA and SAS PROC ANOVA.
What is SAS ANOVA
Analysis of Variance (ANOVA) in SAS Programming Language is used for comparing means of different groups but based on a concept of “Sources of Variance”. It has 3 Variances – Overall Variance, Variance due to Groups, and Variance within Groups.
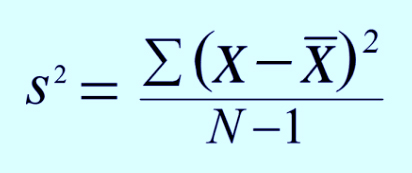
Variance for a sample data is calculated using formula
Some of the key assumptions in SAS ANOVA analysis are-
- Independence- Observations are independent of each other.
- Normality- Values follow normal distribution within each group (marriage age for each region).
- Homogeneity of Variances- Variance for the data is same or similar in all the groups/regions.
SAS PROC ANOVA Procedure
SAS Programming has a procedure called SAS PROC ANOVA which allows us to perform Analysis of Variance. First of all, we need to read the data and then use this procedure.
SAS PROC ANOVA procedure has two statements, a CLASS statement to give a name of a categorical variable. And MODEL statement helps us to give a structure of model or analysis.
Syntax-
PROC ANOVA dataset;
CLASS Variable;
MODEL Variable1=variable2;
MEANS;
Here variable1 and variable2 are targets and independent variables respectively.
SAS One Way ANOVA
Let us consider the dataset marriage. Here we study the dependence between the variables age and region. In the below SAS One Way ANOVA example, marriage age is target variable and region as independent.
SAS One Way ANOVA Example-
data marriage;
            input region $ age;
cards;
S          27
S          22
S          22
S          24
N          24
N          27
N          28
N          30
E          33
E          29
E          30
E          27
W          34
W          35
W          37
W          29
;
run;
%* ANOVA using SAS;
proc anova data=marriage;
 class region;
 MODEL  age =region;
run;
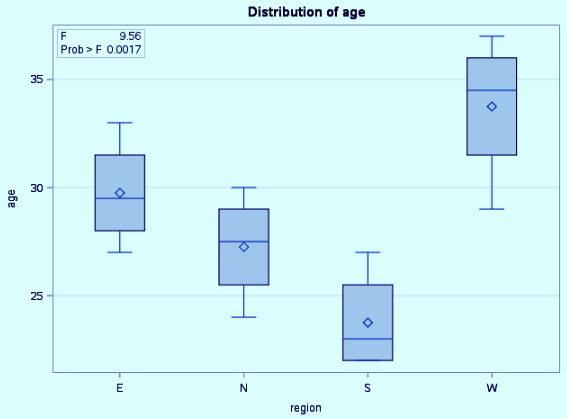
We can also see SAS Box Plot which we get in SAS output. This gives a visualization of the data.
This was all about SAS ANOVA Tutorial. Hope you like our explanation of SAS One Way ANOVA & SAS Proc ANOVA analysis.
Conclusion
Hence, we hope you all understood what is SAS ANOVA and how it can be used, we also looked at SAS One Way ANOVA. In conclusion, we saw SAS Proc ANOVA with SAS One Way ANOVA example.
Furthermore, if you have any query feel free to ask in a comment section and stay tuned to learn more interesting things in SAS.
Your opinion matters
Please write your valuable feedback about DataFlair on Google


Can you plesase intrepret out put. And do couple examples to cover different interpretation scenarios
For all tutorial posts