SAS Correlation Analysis – Understand the PROC CORR & Correlation Matrix
Placement-ready Online Courses: Your Passport to Excellence - Start Now
In our previous SAS tutorial, we learned about SAS scatter plot, now we will be looking at an interesting statistical procedure, SAS correlation analysis. We will be learning different aspects of SAS correlation analysis:
- Correlation analysis creation between two variables
- Correlation analysis creation between all variables and SAS scatter plot
- SAS Correlation matrix of the relationship between variables
- SAS PROC CORR Procedure
So, let’s start with SAS Correlation Analysis tutorial.
SAS Correlation Analysis
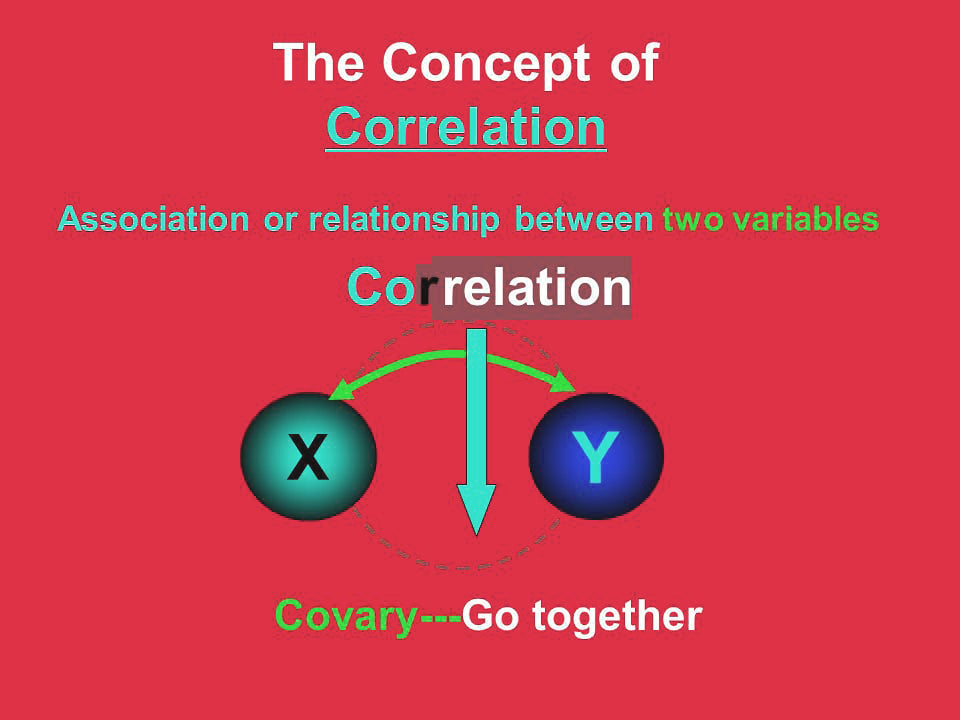
Correlation analysis in SAS is a method of statistical evaluation used to study the strength of a relationship between two, numerically measured, continuous variables (e.g. height and weight).
SAS Correlation analysis is a particular type of analysis, useful when a researcher wants to establish if there are possible connections between variables.
In other words, it’s a measure of how things are related. The correlation coefficient is a measure of linear association between two variables in SAS. Values of the correlation coefficient are always between -1 and +1.
SAS PROC CORR Procedure
The SAS PROC CORR procedure produces Pearson correlation coefficients of continuous numeric variables.
SAS PROC CORR Syntax-
PROC CORR DATA=dataset <options>;
    VAR variable(s);
RUN;
The VAR statement is where you specify all of the variables you want to compute pairwise correlations for. You can list as many variables as you want, with each variable separated by a space.
SAS Correlation of all Variables
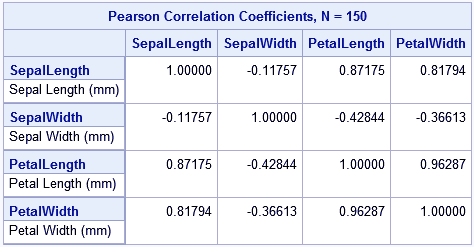
Below we will use Fisher’s iris data from SAS help. To compute the SAS correlation analysis of all variables we only use one PROC CORR statement without VAR. this displays correlation among all the variables in the dataset.
Example-
proc corr data=sashelp.iris;
run;
The iris dataset has four variables and the output displays correlation between these four variables.
SAS Correlation between Two Variables
In this example we will use sample data, we will use two variables: “Height” and “Weight” and show a correlation between these two.
Example-
PROC CORR DATA=sample;
   VAR weight height;
RUN;
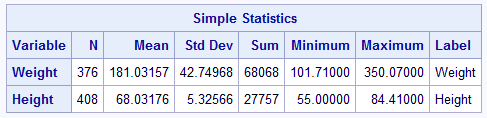
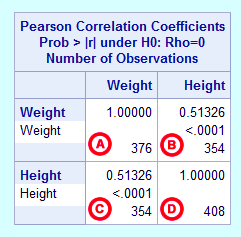
The above table contains the Pearson correlation coefficients and test results.
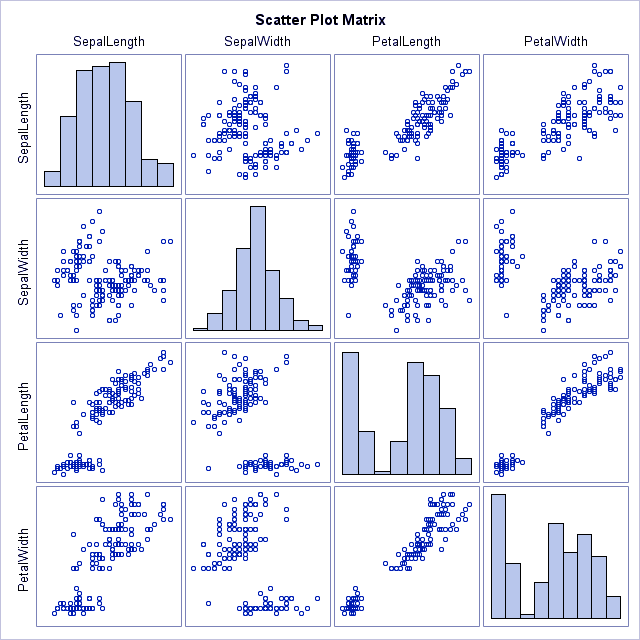
SAS Correlation Matrix
The relation between two variables and their correlation can also be expressed in the form of a scatter plot or a scatter plot matrix.
- PLOTS=MATRIX(options)
Create a scatter plot matrix of the variables in the VAR statements. - PLOTS=SCATTER(options)
Create individual scatter plots of the variables in the VAR statements.
Let us again consider the iris data from SAS help and present a scatter plot matrix of all variables.
Example-
proc corr data=sashelp.iris plots=matrix(histogram);
run;
This was all in SAS Correlation Analysis Tutorial.
Summary
We understood what is a SAS correlation analysis, how can we perform a correlation analysis in SAS Programming Language on all the variables, correlation analysis of two variables, correlated data in the form of a scatter plot or a scatter plot matrix and SAS PROC CORR example with the procedure.
If you have any queries, feel free to ask in the comment section.
If you are Happy with DataFlair, do not forget to make us happy with your positive feedback on Google


that is very interesting point i like it.
it is wow.
Thanks for this interesting text. I have a concern, like the procedure
proc corr data=sashelp.iris;
run;
makes a correlation between all the variables, are the qualitative variables also concerned?
THANKS