4 SAS/STAT Descriptive Statistics Procedure You Must Know
Expert-led Online Courses: Elevate Your Skills, Get ready for Future - Enroll Now!
In our previous tutorial, we looked at SAS/STAT cluster analysis and procedures, today we will be looking at what is SAS/STAT descriptive statistics. Moreover, we will discuss how descriptive statistics is used in SAS/STAT for representing a summary of the statistical procedures.
Our focus here will be to understand different procedures as PROC STDRATE, PROC CORR, BOXPLOT, and PROC UNIVARIATE that can be used for SAS/STAT descriptive statistics. We discuss these features with the help of examples. examples.
So, let’s start with SAS/STAT Descriptive Statistics.
What is SAS/STAT Descriptive Statistics?
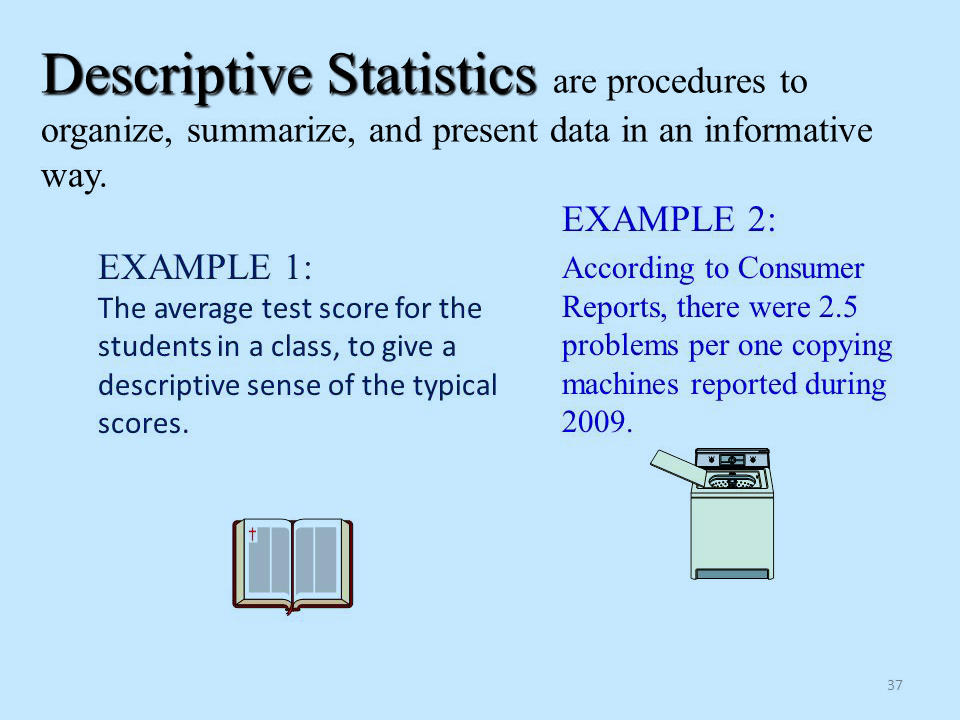
SAS/STAT Descriptive statistics are brief descriptive coefficients that summarize a given data set, which can be either a representation of the entire population or a sample of it. Descriptive statistics in SAS/STAT are broken down into measures of central tendency and measures of variability or spread.
Measures of central tendency and measures of dispersion are the two types of SAS/STAT descriptive statistics. The mean, median, and mode are three types of measures of central tendency. The range, variance, and standard deviation are the three types of measures of dispersion.
Example of SAS/STAT Descriptive statistics
SAS/STAT Descriptive Statistics
Procedures for Descriptive Statistics in SAS/STAT
Below listed procedures are used to perform SAS/STAT descriptive statistics of a sample data. Each procedure has a different syntax and is used with different type of data in different contexts. Let us explore each one of these.
a. PROC STDRATE
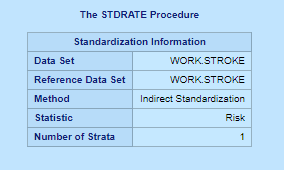
The STDRATE procedure computes directly standardized rates and risks for study populations. For two study populations with the same reference population, PROC STDRATE compares directly standardized rates or risks from these two populations.
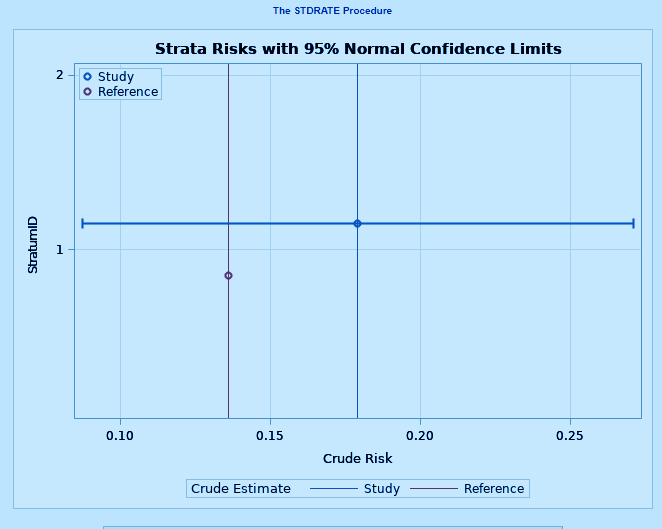
SAS PROC STDRATE provides summary statistics, such as rate and risk estimates and their confidence limits, in each stratum. In addition, PROC STDRATE also displays these stratum-specific statistics by using ODS Graphics.
PROC STDRATE Syntax-
PROC STDRATE < options > ;
 POPULATION options ;
 REFERENCE options ;
The PROC STDRATE statement invokes the procedure, names the data sets, specifies the standardization method, and identifies the statistic for standardization.
The required POPULATION statement specifies the rate or risk information in study populations, and the REFERENCE statement specifies the rate or risk information in the reference population.
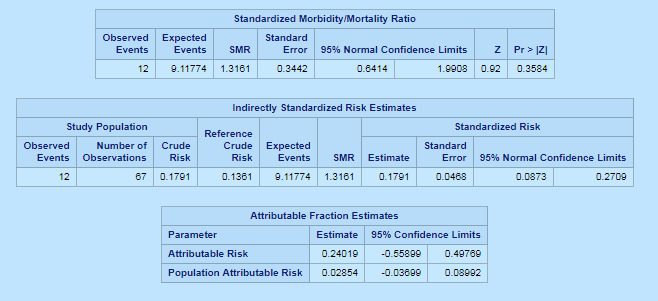
PROC STDRATE Example-
DATA STROKE;
INPUT EVENT_E COUNT_E EVENT_NE COUNT_NE;
DATALINES;
12 67 89 654
;
 PROC STDRATE DATA=STROKE
 REFDATA=STROKE METHOD=INDIRECT(AF) STAT=RISK;
 POPULATION EVENT=EVENT_E TOTAL=COUNT_E;
 REFERENCE EVENT=EVENT_NE TOTAL=COUNT_NE;
 RUN;
PROC STDRATE – STAT Descriptive Statistics
PROC STDRATE – STAT Descriptive Statistics
PROC STDRATE – STAT Descriptive Statistics
b. BOXPLOT Procedure
A BOXPLOT in SAS creates side-by-side box-and-whiskers plots of measurements organized in groups. A box-and-whiskers plot displays the mean, quartiles, and minimum and maximum observations for a group.
c. PROC CORR
The SAS PROC CORR procedure produces Pearson correlation coefficients of continuous numeric variables.
d. PROC UNIVARIATE
With the use of SAS Histogram statement in PROC UNIVARIATE, we can have a fast and simple way to review the overall distribution of a quantitative variable in a graphical display.
This was all about SAS/STAT descriptive Statistics Tutorial. Hope you like our explanation.
Conclusion
Hence, in this tutorial, we studied what is descriptive statistics in SAS/STAT and the procedures offered by SAS/STAT descriptive statistics: PROC STDRATE, PROC CORR, BOXPLOT, and PROC UNIVARIATE. We looked at each of them, their syntax, and how Descriptive Statistics can be used in SAS/STAT.
Hope you all enjoyed it. Stay tuned for more interesting topics in SAS/STAT, and for any queries post your doubts in the comment section below.
Did you know we work 24x7 to provide you best tutorials
Please encourage us - write a review on Google


