SAS Cross Tabulation | Cross Tabulation of Two or More Variables
We offer you a brighter future with industry-ready online courses - Start Now!!
Today we will be looking at SAS Cross Tabulation and how to create crosstables in SAS Programming using SAS Table statement.
We will also see a syntax for Cross Tabulation in SAS, a variety of options such as a cross table with 3 variables, ordering and listing of a cross table and use of nocol and norow statements.
So, let’s start SAS Cross Tabulation.
What is SAS Cross Tabulation
Cross-tabulation tells us the relationship between two variables. Cross-tabulation in SAS is one of the most useful analytical tools. The first step in analyzing categorical variables is to create a SAS cross tabulation table, which can be done by using the TABLES statement.
You can use the SAS TABLE statement to create one- to n-way frequency tables. Without using the TABLES statement, SAS PROC FREQ will generate one-way tables for all the variables that are not listed in other statements.
The variables that are used in the TABLES statement can be either numeric or categorical because PROC FREQ treats all variables as categorical.
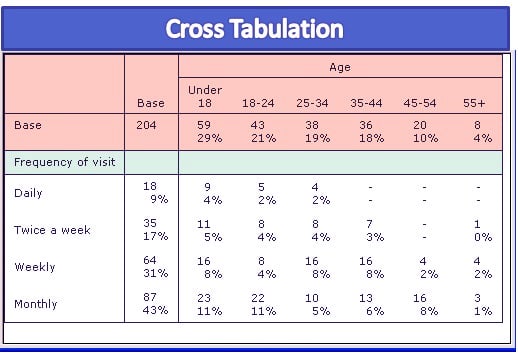
This is how a SAS cross tabulation table looks like-
SAS Cross Tabulation Example
Syntax for Cross Tabulation in SAS
PROC FREQ DATA = dataset;
TABLES variable1*Variable2;
The requests in the SAS TABLES statement can be one variable name or a list of variable names separated by asterisks. For example, to produce a one-way frequency table, simply use one variable name; to produce a two-way frequency table, write an asterisk between two variables.
Request Equivalent to
Tables A*(B C); Tables A*B A*C;
Tables (A B)*(C D); Tables A*C B*C A*D B*D;
Tables (A B C)*D; Tables A*D B*D C*D;
Tables A – – C; Tables A B C;
Tables (A – – C)*D; Tables A*D B*D C*D;
Options for TABLES statement Description
LIST N-way tables are created in list format
NOFREQ Suppresses frequencies
NOCUM Suppresses cumulative frequencies & percentages
NOPERCENT Suppresses percentages
NOCOL Suppresses column percentages
NOROW Suppresses row percentages
MISSING Treats missing values as a group
SAS Cross Tabulation of Two Variables
SAS Proc freq can be used to produce 2×2 tables to determine the distribution (or frequency) of records that fall into 2 combinations of categories.
Example-
Proc freq data=SASHelp.cars;
Tables origin*drivetrain;
Run;
SAS Cross Tabulation
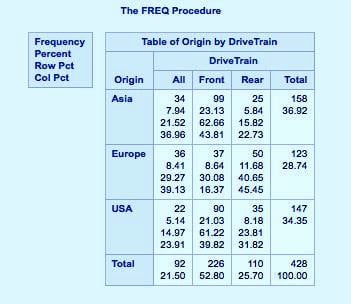
In this SAS Cross Tabulation example, both Origin and DriveTrain each have 3 possible values. As a result, SAS cross tabulation produces a 3×3 table which includes a total of 9 combinations (i.e. 3×3 = 9):
As shown above, the is the frequencies.
For example, the 34 in the top left box indicates that there are 34 cars from Asia that have an “All” for DriveTrain.
Moving from left to right, the 99 in the top middle box indicates that there are 99 cars from Asia that have a “Front” drivetrain, and so on.
The second row contains the percentages relative to the other 8 combinations. Using the top left box again as an example, the 7.94% indicates that out of the 9 possible combinations of Origin and DriveTrain, 7.94% of records have Origin=Asia and DriveTrain=All.
The third row contains what is known as the row percentages. Starting with the top left box as an example, the 21.52 indicates that of those records with Origin=Asia, 21.52% have a DriveTrain=All.
Moving across the row from left to right, you can see that for Origin=Asian cars, 62.66% have DriveTrain=Front, and 15.82% have a DriveTrain=Rear. Notice that these 3 percentages total 100% when summed (added together) across the row.
The fourth row contains what is known as the column percentages. Starting with the top left box as an example, the 36.96 indicates that of those records with DriveTrain=All, 36.96% have Origin=Asia.
Moving down the column from left to right, you can see that for DriveTrain=All cars, 39.13% have Origin=Europe and 23.91% have Origin=USA. Notice that these 3 percentages total 100% when summed (added together) down the column.
a. Limiting the output
Depending on the desired results, you can choose to suppress some of these numbers from the output.
The NOCOL, NOROW, NOFREQ and NOPERCENT options can use to suppress the column percentages, row percentages, frequencies and overall percentages from your output. These options can be used independently or in different combinations together.
Example-
Proc freq data=SASHelp.cars;
Tables origin*drivetrain / nocol norow;
Run;

SAS Cross Tabulation
SAS Cross Tabulation of n Variables
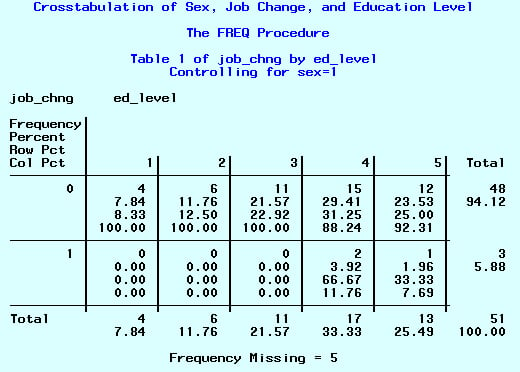
For a frequency analysis of more than two variables, we can use the FREQ procedure to create n–way cross tabulation tables. In that case, a series of two-way tables create, with a table for each level of the other variables. The following example creates a three-way table of sex, job_chng, and ed_level:
Example-
PROC FREQ data=sashelp.class;
    Tables sex*job_chng*ed_level;
RUN;
As you can see, to tell SAS to create a three-way table of sex, job_chng, and ed_level, we use an asterisk (*) to join the three variables in the TABLES statement. The order of the variables is important.
In n-way tables, the last two variables of the TABLES statement become the rows and columns of the two-way tables.
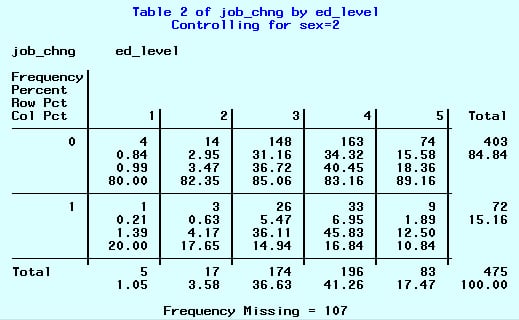
So, in this case, we should expect SAS to create two two-way tables of job_chng and ed_level, one for when sex = 1 and one for when sex = 2.
SAS Cross Tabulation
SAS Cross Tabulation
Conclusion
Hope you all understood how we can use the PROC FREQ procedure to create a SAS Cross Tabulation table. We also saw how can we limit the output by using SAS Table statements like nocol and norow.
We also saw how SAS cross tabulation can take place with more than one variable. For any queries post your doubts in the comments section below.
You give me 15 seconds I promise you best tutorials
Please share your happy experience on Google


