SAS Bar Chart – Explore the Different Types of Bar Charts in SAS
Job-ready Online Courses: Click, Learn, Succeed, Start Now!
Previously, we learned about SAS Histogram, now we will look at the SAS bar chart.
We will learn how to create a bar chart in SAS Programming Language and the different types of SAS bar charts: SAS simple bar chart, SAS stacked bar chart (SAS grouped bar chart), and SAS cluster bar chart (SAS bar chart side by side).
So, let’s start the tutorial.
What is Bar Chart in SAS?
SAS bar chart shows the distribution of a categorical variable. The bar chart in SAS is some of the most commonly used graphs to convey information to the reader. Bar charts are used across all domains, including business, finance, banking, clinical and health, and life sciences.
Below is what a typical SAS bar chart looks like:
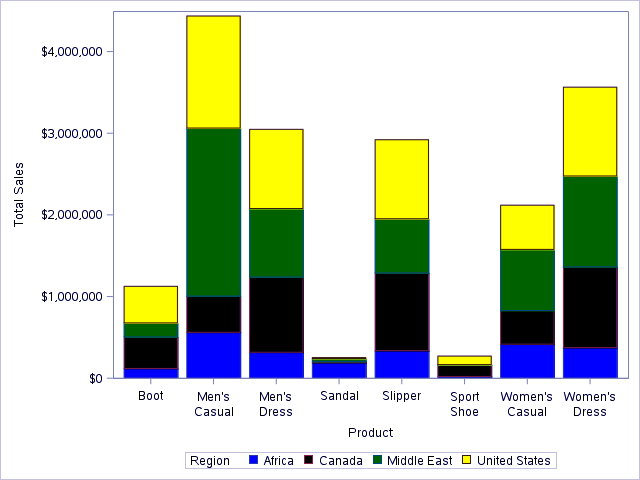
Example 1-

Example 2-
The PROC SGPLOT Procedure
The basic syntax to create a SAS bar chart is:
PROC SGPLOT DATA = DATASET;
VBAR variables;
RUN;
PROC SGPLOT is used to create a bar chart in SAS.
A VBAR statement is used to create a vertical SAS bar chart of the variable.
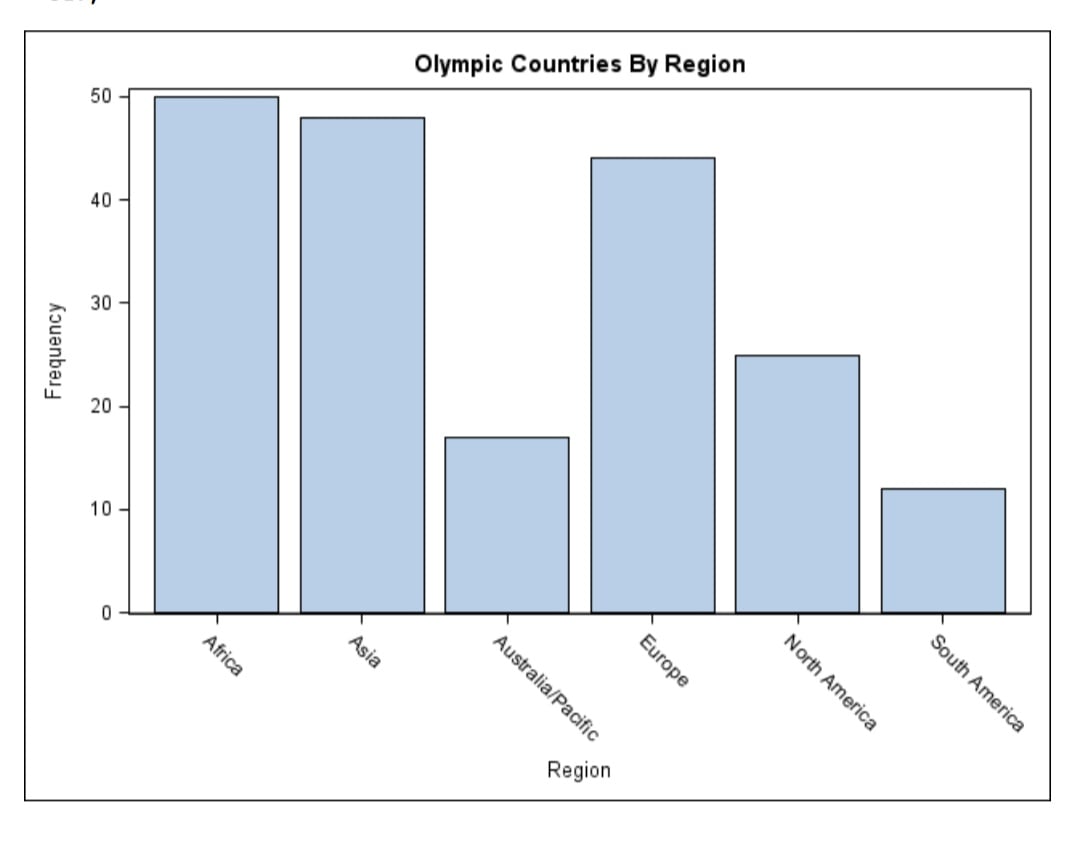
SAS Simple Bar Chart
A simple bar chart in SAS is the one that has single vertical bars. We have used the Olympics data set. This SAS Bar chart shows the number of countries in each region that participated in the 2012 Olympics.
PROC SGPLOT DATA = olympics;
 VBAR Region;
TITLE 'Olympic Countries by Region';
RUN;
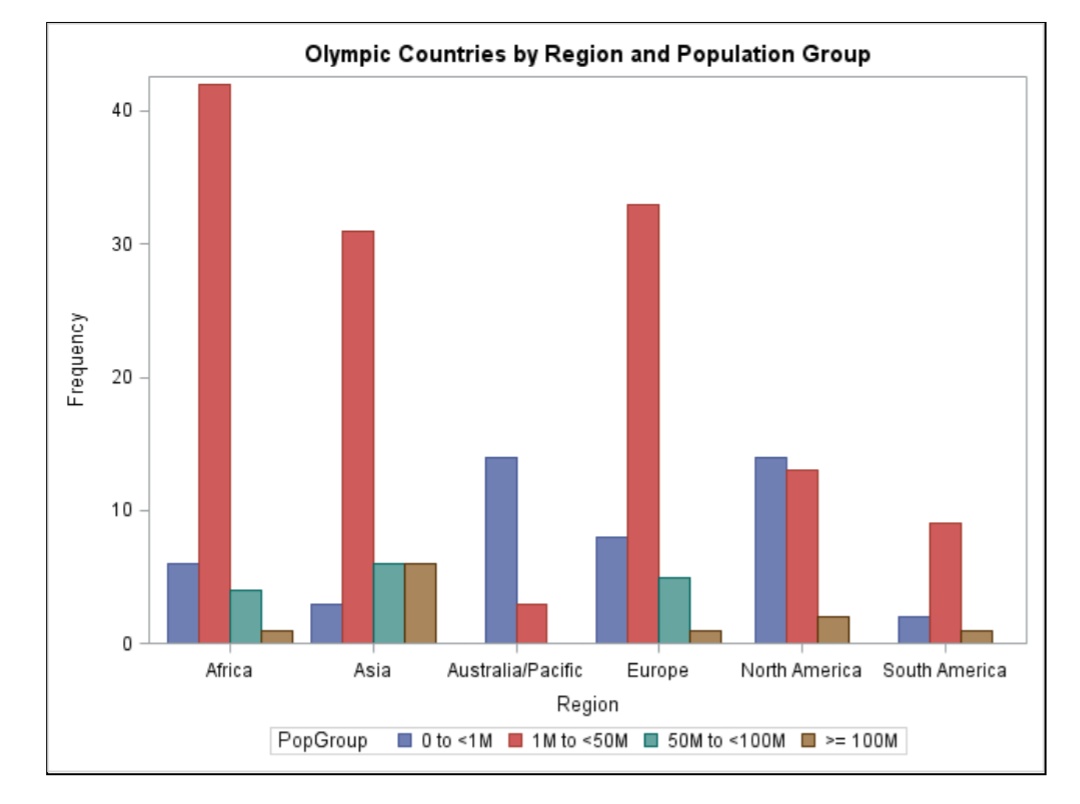
SAS Stacked Bar Chart
In this type of SAS bar chart, a variable’s value is represented with respect to another variable. Here, the bars have been divided into groups using the GROUP= option. The grouping variable is a categorical variable named PopGroup. By default, SAS creates stacked bars.
PROC SGPLOT DATA = olympics;
VBAR Region / GROUP = PopGroup;
TITLE 'Olympic Countries by Region and Population Group';
RUN;

SAS Clustered Bar Chart
Like in the previous example the groups were stacked one above the other, the variables can be stacked next to each other that is side by side. You can specify side-by-side groups instead of stacked groups by adding the option GROUPDISPLAY = CLUSTER to the VBAR statement.
PROC SGPLOT DATA = olympics;
 VBAR Region / GROUP = PopGroup GROUPDISPLAY = CLUSTER;
TITLE 'Olympic Countries by Region and Population Group';
RUN;
This comes to the end of the tutorial.
Summary
We hope you understood the different types of SAS bar charts. If you have any queries, feel free to ask in the comment section.
Your 15 seconds will encourage us to work even harder
Please share your happy experience on Google


