SAS/STAT ANOVA – 8 Procedures for Calculating Analysis of Variance
Expert-led Online Courses: Elevate Your Skills, Get ready for Future - Enroll Now!
We looked at the features of SAS/STAT in the previous SAS/STAT Software tutorial, today we will be looking at a statistical procedure called SAS/STAT ANOVA (analysis of variance) and how it is used for comparing means across multiple samples.
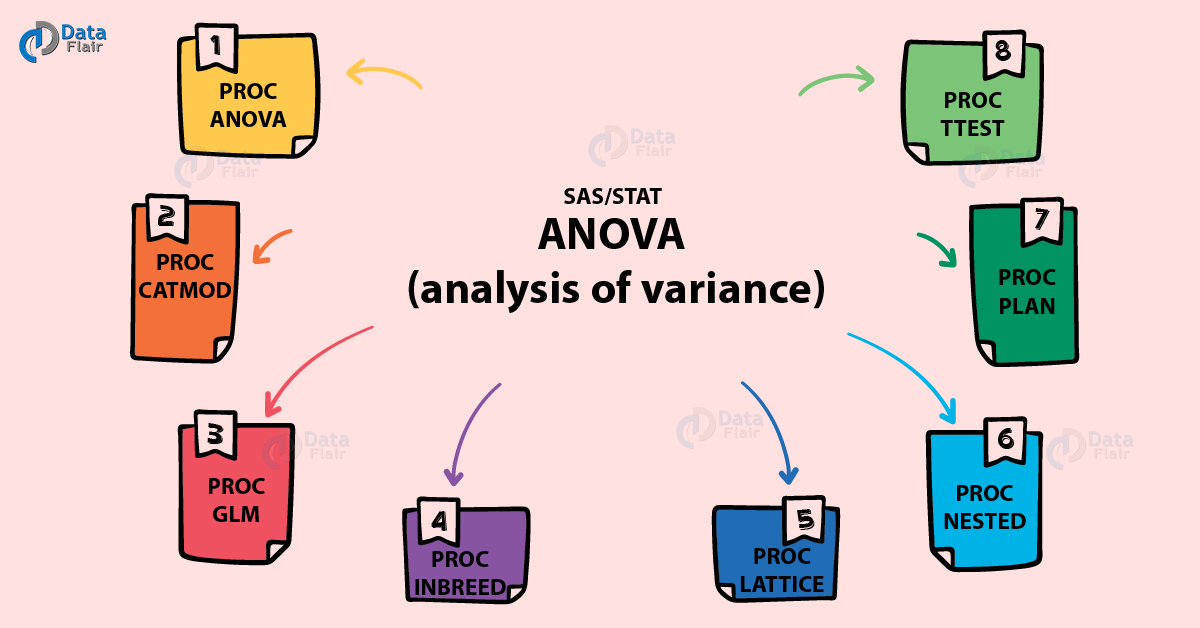
Our focus here will be to understand different procedures that can be used for the analysis of variance: SAS PROC ANOVA, SAS PROC CATMOD, SAS PROC GLM, SAS PROC INBREED, SAS PROC LATTICE, SAS PROC NESTED, SAS PROC PLAN, SAS PROC TTEST through the use of examples.
So, let’s SAS/STAT ANOVA.
SAS/STAT ANOVA – 8 Procedures to Conclusion Analysis of Variance
ANOVA (Analysis of Variance)
We already saw what is ANOVA in SAS in the earlier tutorials. Let us revise it once again.
Analysis of Variance (ANOVA) in SAS Programming Language is used for comparing means of different groups but based on a concept of “Sources of Variance”. It has 3 Variances – Overall Variance, Variance due to Groups, and Variance within Groups.
Some of the key assumptions in SAS ANOVA analysis are-
- Independence- Observations are independent of each other.
- Normality- Values follow normal distribution within each group (marriage age for each region).
- Homogeneity of Variances- Variance for the data is same or similar in all the groups/regions.
Procedures for Calculating SAS/STAT ANOVA
SAS/STAT uses the following procedures to compute SAS/STAT ANOVA (analysis of variance) of a sample data. Each procedure has a different syntax and is used with different type of data in different contexts. Let us explore each one of these.
a. SAS PROC ANOVA
The PROC ANOVA procedure in SAS/STAT performs analysis of variance for balanced data only (data that has the same number of observations for all samples). SAS PROC ANOVA procedure has two statements, a CLASS statement to give a name of a categorical variable. And MODEL statement helps us to give a structure of model or analysis.
Let’s Revise SAS Chi-Square Test – SAS PROC FREQ
SAS PROC ANOVA Syntax-
PROC ANOVA dataset;
CLASS Variable;
MODEL Variable1=variable2;
MEANS;
SAS PROC ANOVA Example-
data work.heart;
set sashelp.heart;
run;
proc anova data=work.heart;
class weight_status;
model cholesterol=weight_status;
run;
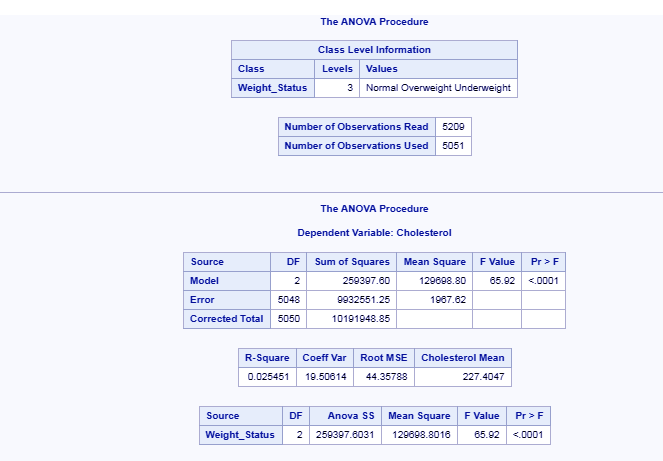
SAS/STAT ANOVA – PROC ANOVA
SAS/STAT ANOVA – PROC ANOVA
b. SAS PROC CATMOD
The PROC CATMOD procedure in SAS/STAT ANOVA performs modeling of categorical data that can be represented by a contingency table. SAS PROC CATMOD specializes in WLS modeling and analysis of a wide range of models. SAS PROC CATMOD fits linear models to functions of response frequencies.
Do You Know How to Apply Fishers Exact Test in SAS Using PROC FREQ Procedure
SAS PROC CATMOD Syntax-
PROC CATMOD dataset;
WEIGHT variable ;
RESPONSE < function >< / options >;
MODEL response-effect=design-effects < / options > ;
The PROC CATMOD and MODEL statements are required.
WEIGHT specifies a variable that contains frequency counts.
RESPONSE determines the response functions that are to be modeled.
MODEL specifies
- dependent variables, which determine the columns of the contingency table,
- independent variables, which distinguish response functions in one population from those in other populations, and
- model effects, which determine the design matrix
SAS PROC CATMOD Example-
data colds;
input sex $ residence $ periods count @@;
datalines;
female rural 0 45 female rural 1 64 female rural 2 71
female urban 0 80 female urban 1 104 female urban 2 116
male rural 0 84 male rural 1 124 male rural 2 82
male urban 0 106 male urban 1 117 male urban 2 87;
run;
proc catmod data=colds;
weight count;
response means;
model periods = sex residence sex*residence / design;
run;
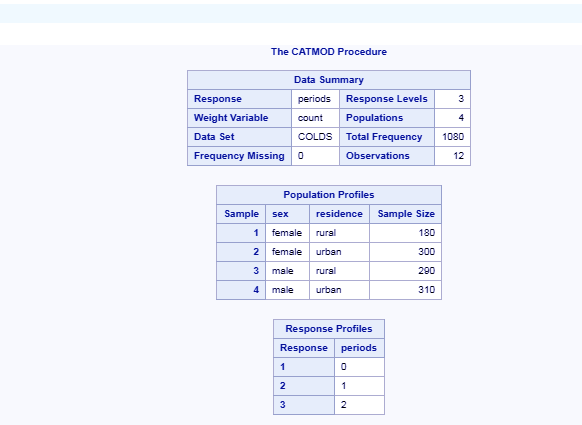
SAS/STAT ANOVA – PROC CATMOD
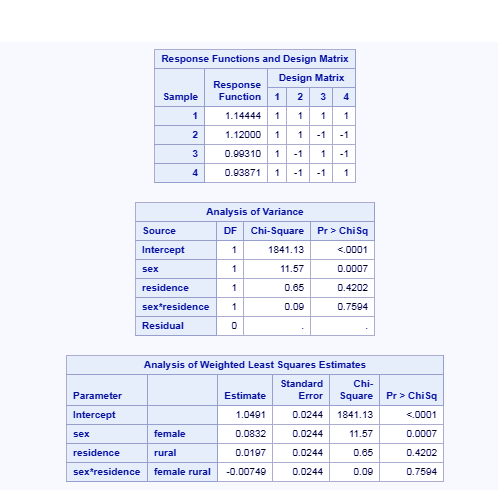
SAS/STAT ANOVA – PROC CATMOD
c. SAS PROC GLM
The PROC GLM fits linear models using the method of least squares. SAS PROC GLM handles models by relating one or several continuous dependent variables to one or several independent variables. It has statistical methods like regression, analysis of variance, analysis of covariance, multivariate analysis of variance, and partial correlation.
SAS PROC GLM Syntax-
PROC GLM dataset;
     CLASS variables
      MODEL ;
Here, Class denotes the variables we want to classify and MODEL denotes the model we want to fit depending on those variables.
Let’s look at FIRST. and LAST. Variables in SAS – Data Step Processing in By Groups
SAS PROC GLM Example-
title 'Analysis of vARIANCE using PROC GLM ';
   data xyz;
      input A $ B $ Y @@;
      datalines;
   A1 B1 27 A1 B1 41     A1 B2 10 A1 B2 19
   A2 B1 23 A2 B1 18     A2 B2 7
   ;
   proc glm data=xyz;
      class A B;
      model Y=A B A*B;
   run;
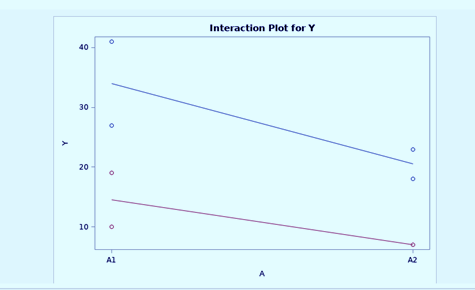
SAS/STAT ANOVA – PROC GLM
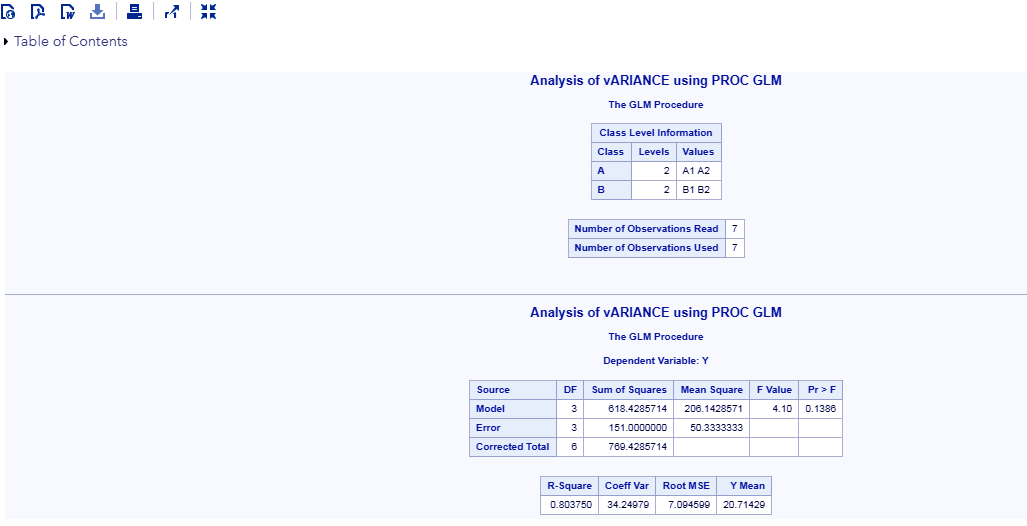
SAS/STAT ANOVA – PROC GLM
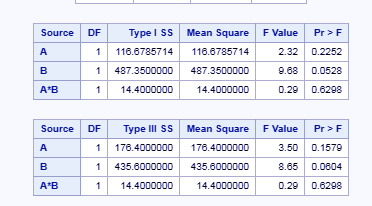
SAS/STAT ANOVA – PROC GLM
d. SAS PROC INBREED
The PROC INBREED procedure in SAS/STAT ANOVA calculates the covariance for a pedigree. A pedigree is an analysis of inherited traits in a group to determine the pattern and characteristics of the trait. The INBREED procedure has two modes of operation.
One mode carries out analysis on the assumption that all the individuals belonging to the same generation. The other mode divides the population into non-overlapping generations and analyzes each generation separately, assuming that the parents of individuals in the current generation are defined in the previous generation.
Read About SAS Arithmetic Mean – SAS PROC MEANS Tutorial
SAS PROC INBREED Syntax-
PROC INBREED dataset;
   CLASS variable1;
   GENDER variable2;
SAS PROC INBREED Example-
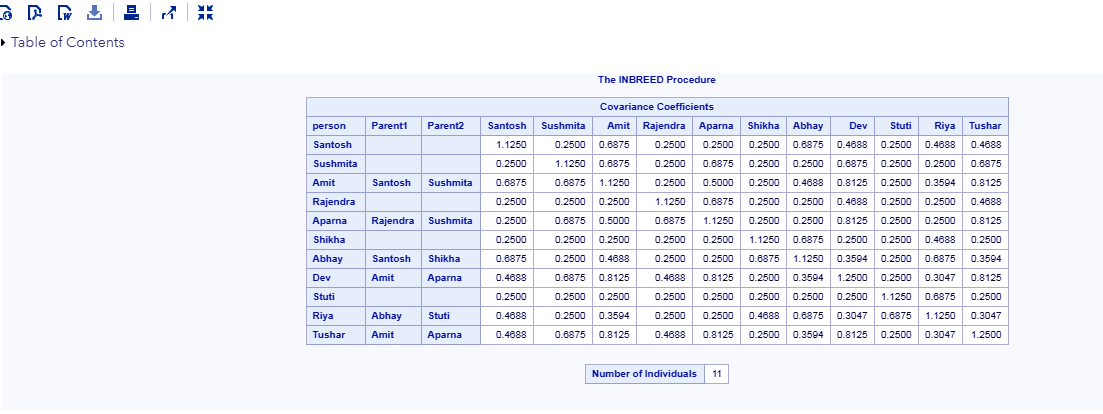
data sample;
input person $ Parent1 $ Parent2 $ Covariance gender $ Generation;
datalines;
Amit Santosh Sushmita . M 1
Aparna Rajendra Sushmita . F 1
Abhay Santosh Shikha . M 1
. Amit Aparna 0.50 . 1
Dev Amit Aparna . M 2
Riya Abhay Stuti . F 2
Tushar Amit Aparna 0.50 M 2
Amit Abhay Aparna . M 2
;
proc inbreed data=sample covar matrix init=0.25;
run;
Like you can see above, each observation must include one variable identifying the individual and two variables identifying the individual’s parents.
SAS/STAT ANOVA – PROC INBREED
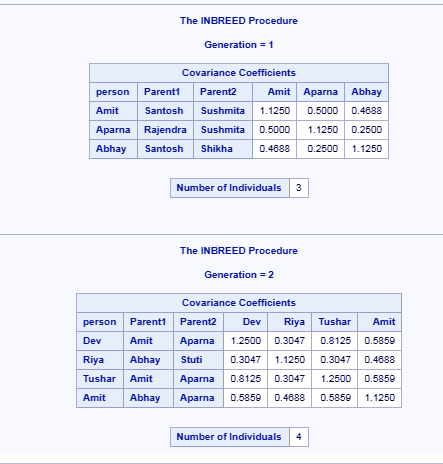
proc inbreed data=sample covar matrix init=0.25;
   class Generation;
run;
Here, the DATA= option names the SAS data set to be analyzed, and the COVAR and MATRIX options tell the procedure to output the covariance coefficients matrix. Also, the INIT= option gives an initial covariance between any individual and unknown individuals.
Let’s Revise SAS ODS (Output Delivery Systems)
SAS/STAT ANOVA – PROC INBREED
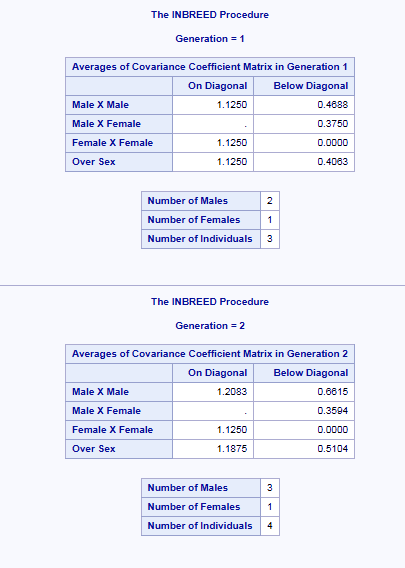
Now, if we want to see covariance coefficient averages within gender categories. This is accomplished by indicating the variable defining the gender of individuals in a GENDER statement and by adding the AVERAGE option to the PROC INBREED statement.
proc inbreed data=sample covar average init=0.25;
   class Generation;
   gender gender;
run;
SAS/STAT ANOVA – PROC INBREED
e. SAS PROC LATTICE
The PROC LATTICE procedure in SAS/STAT ANOVA computes the analysis of variance and analysis of simple covariance for data from an experiment that has a lattice design.
Let’s Discuss SAS Macro For Beginners – Macro Variables & Functions
SAS PROC LATTICE Syntax-
PROC LATTICE dataset;
  VAR variable;
Note-There should always be three numeric SAS variables, Group, Block, and Treatment, in the data set to which PROC LATTICE is applied.
Every numeric variable other than Group, Block, Treatment, or Rep in the input SAS data set may be considered a response variable. A VAR statement tells PROC LATTICE that only the variables listed in the VAR statement are to be considered response variables.
SAS PROC LATTICE Example-
title 'analysis of variance using PROC LATTICE';
data dogs;
  input Group Block Treatment weight @@;
   datalines;
1 1 1 3.20  1 1 2 4.84  1 1 3 2.18  1 2 4 2.05  1 2 5 0.85
1 2 6 2.86  1 3 7 3.73  1 3 8 1.60  1 3 9 1.76
2 1 1 2.19  2 1 4 1.20  2 1 7 1.15  2 2 2 2.26  2 2 5 1.07
2 2 8 1.45  2 3 3 2.12  2 3 6 2.93  2 3 9 1.63
3 1 1 1.81  3 1 5 5.16  3 1 9 1.11  3 2 2 1.76  3 2 6 2.16
3 2 7 1.80  3 3 3 1.71  3 3 4 1.87  3 3 8 1.13
4 1 1 1.77  4 1 6 1.57  4 1 8 1.43  4 2 2 1.50  4 2 4 1.60
4 2 9 1.42  4 3 3 2.04  4 3 5 0.93  4 3 7 1.78
;
;
proc lattice data=dogs;
   var weight;
run;
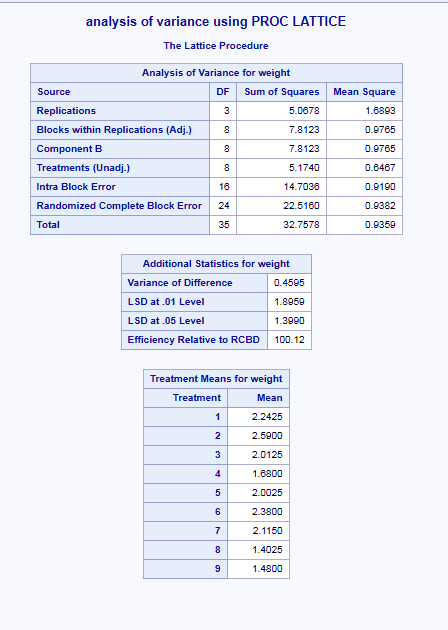
SAS/STAT ANOVA – PROC LATTICE
f. SAS PROC NESTED
The PROC NESTED procedure in SAS/STAT ANOVA performs analysis of variance on random effects for data from an experiment that has a nested (hierarchical) structure. SAS PROC NESTED is appropriate for models with only classification effects, it does not handle models that contain continuous covariates.
Read Also- SAS Proc Sort Data Sets – Ascending, Descending & By Statements
SAS PROC NESTED Syntax-
PROC NESTED dataset;
CLASS variables;
VAR variables;
The PROC NESTED and CLASS statements are required statements.
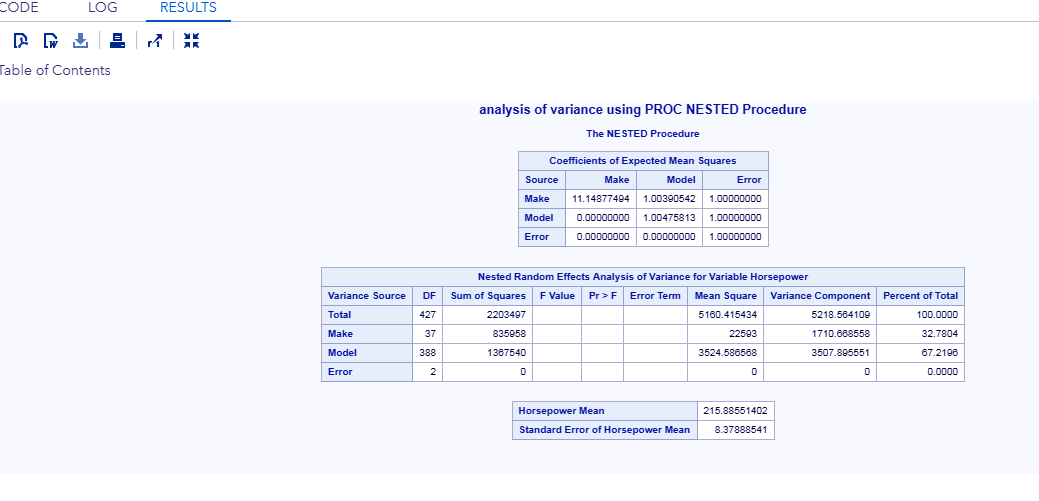
SAS PROC NESTED Example-
title 'analysis of variance using PROC NESTED Procedure';
proc nested data=sashelp.cars;
class Make Model;
var horsepower;
run;
The Make variable contains the make of the cars, while the Model variable represents the car model. The horsepower variable contains the reliability scores given to the sampled cars from each Make-Model group. Since the car models are nested within their makes, the NESTED procedure is used to analyze these data.
SAS/STAT ANOVA – PROC NESTED
Do You How to Enter and Read Raw Data in SAS Programming Language
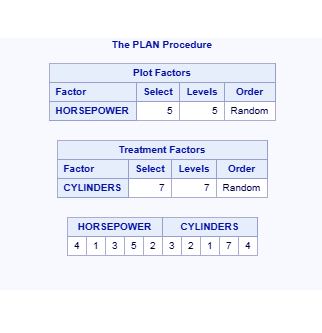
g. SAS PROC PLAN
PROC PLAN is used for generating lists of permutations and combinations of numbers. It constructs designs and randomizes plans for factorial experiments. SAS PROC PLAN generates designs by first generating a selection of the levels for the first factor.
Then, for the second factor, PROC PLAN generates a selection of its levels for each level of the first factor. In general, for a given factor, the PLAN procedure generates a selection of its levels for all combinations of levels for the factors that precede it.
SAS PROC PLAN Syntax-
PROC PLAN dataset;
FACTORS factor-selections ;
OUTPUT OUT=SAS-data-set ;
TREATMENTS factor-selections;
The FACTORS statement specifies the factors of the plan and generates the plan.
The TREATMENTS statement specifies the treatments of the plan to generate, but it does not generate a plan.
SAS PROC PLAN Example-
proc plan seed=27371;
factors HORSEPOWER=5 ;
TREATMENTS CYLINDERS=7;
output data=SASHELP.CARS out=CARS;
run;
SAS/STAT ANOVA – PROC NESTED
Let’s look at How to Use Hypothesis Testing
h. SAS PROC TTEST
The PROC TTEST can also be used in SAS/STAT ANOVA for analysis of variance. We have already discussed in our previous SAS TTEST tutorial. You can refer to the following link for better understanding of the same.
Conclusion
So, this was a complete description and a comprehensive understanding of all the procedure offered by SAS/STAT ANOVA (analysis of variance): SAS PROC ANOVA, SAS PROC CATMOD, SAS PROC GLM, SAS PROC INBREED, SAS PROC LATTICE, SAS PROC NESTED, SAS PROC PLAN, and SAS PROC TTEST with syntax and examples. Furthermore, if you have any query feel free to ask in a comment section.
Related Topic- SAS Standard Deviation
You give me 15 seconds I promise you best tutorials
Please share your happy experience on Google


