SAS Mixed Model Procedures – PROC MIXED, PROC NLMIXED
Expert-led Online Courses: Elevate Your Skills, Get ready for Future - Enroll Now!
In our previous article we have seen Longitudinal Data Analysis Procedures, today we will discuss what is SAS mixed model. Moreover, we are going to explore procedures used in Mixed modeling in SAS/STAT.
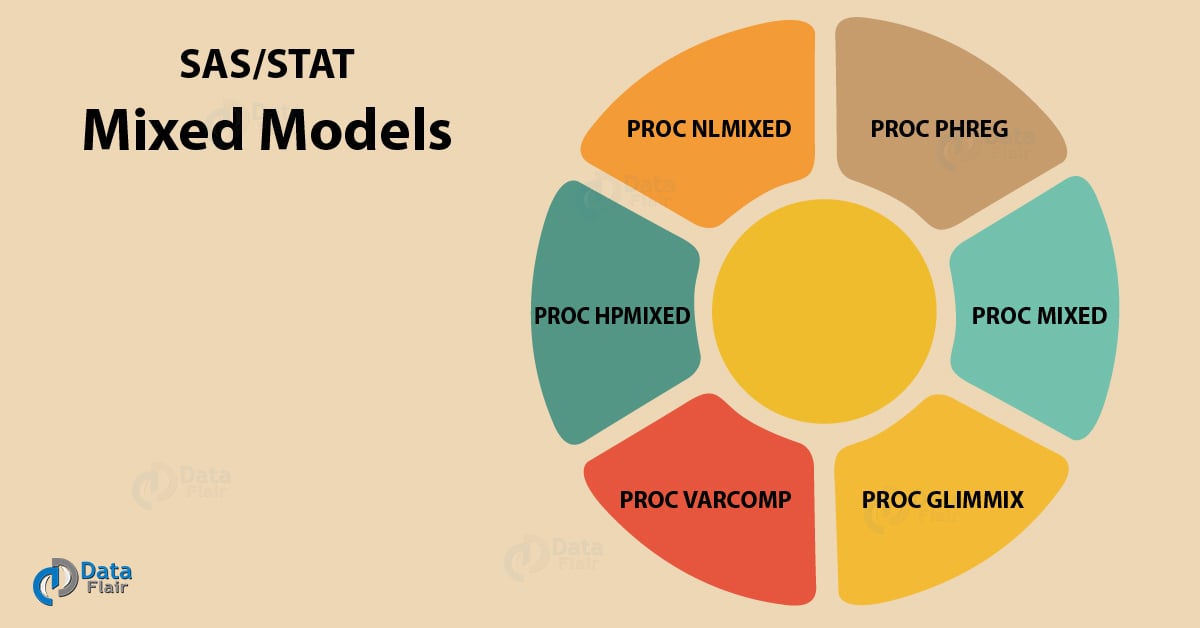
In these SAS Mixed Model, we will focus on 6 different types of procedures: PROC MIXED, PROC NLMIXED, PROC PHREG, PROC GLIMMIX, PROC VARCOMP, and ROC HPMIXED with examples & syntax. At last, we also learn SAS mixed models with examples.
So, let’s start with SAS mixed model.
SAS Mixed Model Procedures – PROC MIXED, PROC NLMIXED
Introduction to SAS Mixed Model
The term mixed model in SAS/STAT refers to the use of both fixed and random effects in the same analysis. SAS mixed model are particularly useful in settings where repeated measurements are made on the same statistical units, or where measurements are made on clusters of related statistical units.
Because of their advantage in dealing with missing values, mixed effects models are often preferred over more traditional approaches such as repeated measures ANOVA.
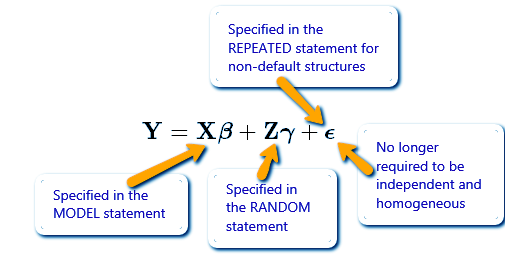
In such SAS mixed modeling, the observations are not assumed to be independent. Random effects are fitted to the model accounting for additional sources of variation. A general linear mixed model looks like the one shown below.
Also, Learn 6 Bayesian Analysis Procedures
Sample – SAS Mixed Modeling
Mixed Modelling Procedure in SAS/STAT
SAS/STAT uses the following 6 simple procedures to compute mixed models of a sample data. Each procedure has a different syntax and is used with different type of data in different contexts. Let us explore each one of these.
a. PROC HPMIXED
The HPMIXED procedure uses a number of techniques to fit linear mixed models. PROC HPMIXED procedure enables you to specify a linear mixed model with variance component structure, to estimate the covariance parameters by restricted maximum likelihood.
The HPMIXED procedure is similar to the PROC MIXED procedure and other SAS procedures for mixed modeling. SAS mixed model supported by the HPMIXED procedure are a subset of the models that you can fit with the MIXED procedure.
Let’s learn 16 Important Features of SAS/STAT
The syntax of PROC HPMIXED–
PROC HPMIXED DATASET
CLASS <variable>;
MODEL response= effects <options>;
The PROC HPMIXED, MODEL statements are required
PROC HPMIXED Example-
proc hpmixed data=Sashelp.iris;
   class Species;
   model sepallength = Sepalwidth;
  run;
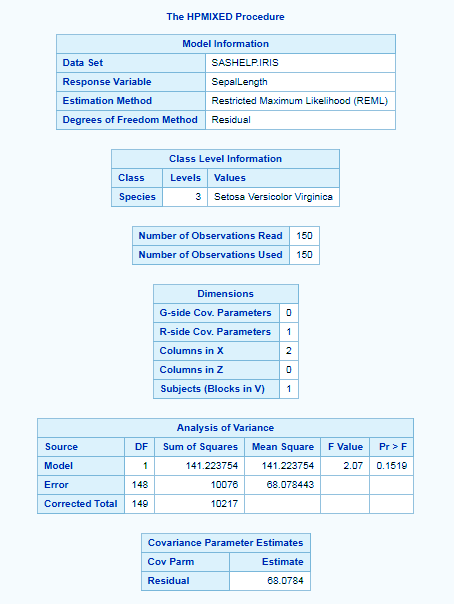
SAS mixed model – PROC HPMIXED
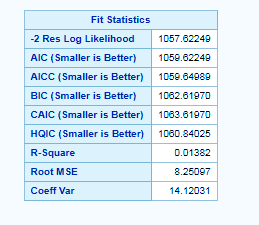
SAS mixed modeling – PROC HPMIXED
Read About Categorical Data Analysis Procedure
b. PROC NLMIXED
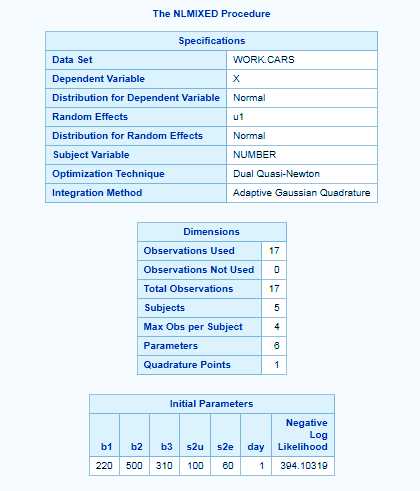
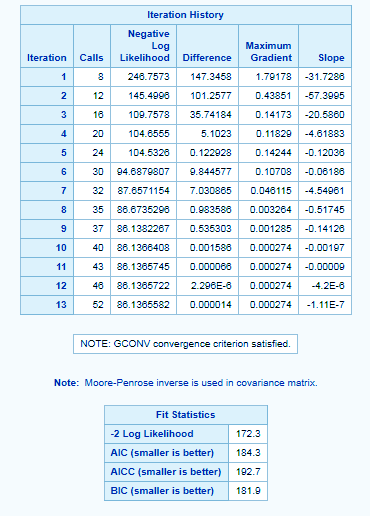
The PROC NLMIXED fits nonlinear mixed models—that is, models in which both fixed and random effects enter nonlinearly. PROC NLMIXED enables you to specify a conditional distribution for your data (given the random effects) having either a standard form (normal, binomial, Poisson) or a general distribution.
SAS PROC NLMIXED fits nonlinear mixed models by maximizing an approximation to the likelihood integrated over the random effects.
PROC NLMIXED Syntax-
PROC NLMIXED dataset <
OPTIONS>; MODEL model-specification; PARMS parameters-and-starting-values;
PROC NLMIXED Example-
data CARS;
  input NUMBER LENGTH X;
  datalines;
1  118   30
1  484   58
1  664   87
2  118   33
2  484   69
2  664   111
3  118   30
3  484   51
3  664   75
4  118   32
4  484   62
4  664   112
4  1004  167
5  118   30
5  484   49
5  664   81
5 1004   125
;
proc nlmixed data=CARS;
   parms b1=220 b2=500 b3=310 s2u=100 s2e=60;
   num = b1+u1;
   ex  = exp(-(day-b2)/b3);
   den = 1 + ex;
   model X ~ normal(num/den,s2e);
   random u1 ~ normal(0,s2u) subject=NUMBER;
run;
In the above example, a nonlinear SAS mixed model has been created with different equations.
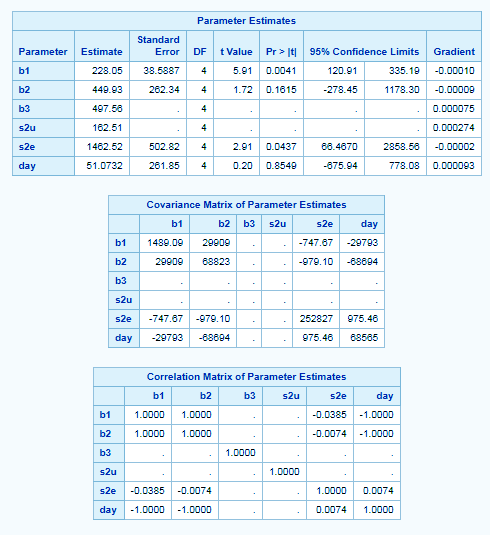
The PROC NLMIXED statement invokes the procedure and inputs the data set. The PARMS statement identifies the unknown parameters and their starting values. Here there are three fixed-effects parameters (b1, b2, b3) and two variance components (s2u, s2e).
Let’s Explore Advantages & Disadvantages of SAS/STAT
The MIXED MODEL statement defines the dependent variable and its conditional distribution given the random effects. Here a normal (Gaussian) conditional distribution is specified.
The RANDOM statement defines the single random effect to be u1, and specifies that it follow a normal distribution with mean 0 and variance s2u. The SUBJECT= argument in the RANDOM statement defines a variable indicating when the random effect obtains new realizations.
SAS mixed model – PROC NLMIXED
Statistical Mixed Modeling – PROC NLMIXED
Mixed Models in SAS/STAT – PROC NLMIXED
Read About Group Sequential Design and Analysis
c. PROC VARCOMP
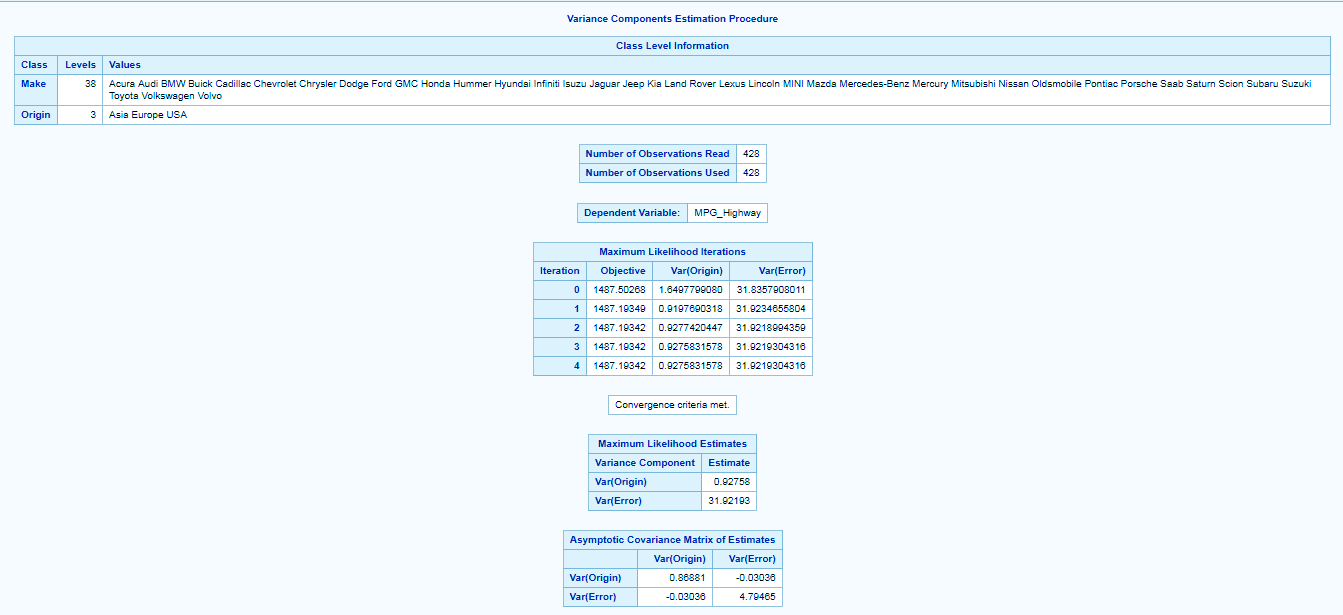
The VARCOMP procedure in SAS/STAT fits general linear models that have random effects. PROC VARCOMP estimates the contribution of each of the random effects to the variance of the dependent variable. You can specify four general methods of estimation in the PROC VARCOMP statement by using the METHOD=option. Let us see how it works-
PROC VARCOMP Syntax-
PROC VARCOMP dataset OPTIONS;
CLASS <VARIABLES>;
     MODEL dependent = <fixed-effects> </ options>;
The PROC MIXED and MODEL statements are required, and the MODEL statement must appear after the CLASS statement if a CLASS statement is included.
PROC VARCOMP Example-
proc varcomp method=ml data=SASHELP.CARS;
   class MAKE  ORIGIN;
   model MPG_HIGHWAY=ORIGIN;
run;
The MIXED MODEL statement first specifies the response (dependent) variable MPG_highway. The explanatory (independent) variables are then listed after the equal (=) sign.
SAS mixed model – PROC VARCOMP
d. PROC GLIMMIX
We have already discussed this procedure in detail in the Longitudinal data analysis tutorial. You can refer to the same for the complete tutorial.
e. PROC MIXED
We have already discussed this procedure in detail in the Longitudinal data analysis tutorial with PROC MIXED example.
f. PROC PHREG
We have already discussed this procedure in detail. You can refer to the following link for the complete tutorial.
This was all about SAS Mixed Model Tutorial. Hope you like our explanation.
Conclusion
Hence, we have discussed the complete description of SAS mixed model. Along with this we also learned the 6 different procedures for mixed modeling in SAS/STAT. Moreover, we looked at the syntax and examples of PROC MIXED, PROC NLMIXED, PROC PHREG, PROC GLIMMIX, PROC VARCOMP, and PROC HPMIXED and how they can be used.
Hope you all enjoyed it. Stay tuned for more interesting topics in SAS/STAT, and for any doubts in SAS mixed model, post it in the comments section below.
Your opinion matters
Please write your valuable feedback about DataFlair on Google


i want to determine the critical period of weed competition in sugarcane using SAS software but i failed to determine the starting and end of critical periods of weed competition. is any person who is voluntary to show me all the procedures with great thank. please send via my email .