SAS Frequency Distribution Using SAS PROC FREQ
Job-ready Online Courses: Knowledge Awaits – Click to Access!
Today we will be looking at one of the most frequently used statistical procedure in SAS Programming, that is SAS Frequency Distribution. We will see how to create a frequency distribution table in SAS and a variety of options that can be applied while creating a table to get better results.
So, let’s start SAS Frequency Distribution using SAS PROC FREQ.
SAS Frequency Distribution
For continuous variables, descriptive statistics like mean and standard deviation can be used to summarize the data. But for categorical variables, these measures are not appropriate.
Categorical variables can be summarized using a frequency table, which shows the number and percentage of cases observed for each category of a variable.
A categorical variable (sometimes called a nominal variable) is one that has two or more categories, but there is no ordering to the categories. For example, gender is a categorical variable having two categories (male and female) and there is no ordering to the categories.
Hair color is also a categorical variable having a number of categories (blonde, brown, brunette, red, etc.) and again, there is no agreed way to order these from highest to lowest. A purely categorical variable is one that simply allows you to assign categories but you cannot clearly order the variables.
SAS frequency distribution table looks like the one shown below-
Example SAS Frequency Distribution
SAS PROC FREQ Procedure
The SAS PROC FREQ procedure prints all values of a given categorical variable in the Output window, along with the number and percentage of times each value appears. The FREQ procedure can work with both string (character) or numeric categorical variables.
The syntax of SAS PROC FREQ statement is:
PROC FREQ DATA = Dataset ;
TABLES Variable1 ;
BY Variable2 ;
The PROC FREQ statement is the only required statement for the FREQ procedure.
A basic frequency table created with PROC FREQ will have the following properties:
- It will include the frequency, percentage, cumulative frequency, and cumulative percent for each category.
- If there are cases with missing values for the variable, the number of missing values are given below the table.
- For string variables, the categories will be ordered alphabetically. For numeric variables, the categories will be ordered from smallest to the largest indicator.
Basic Usage of SAS PROC FREQ
This is the most basic form of a PROC FREQ in SAS Frequency Distribution. We only need to specify the name of the dataset and not the variables.
Example-
Proc freq data=SASHelp.cars;
Run;
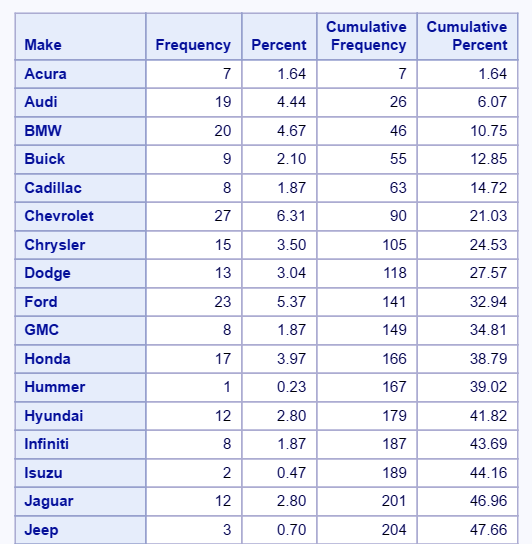
The code above creates a frequency table for each of the variable in the dataset.
For example, below is a frequency table for the variable MAKE.
Basic Usage of SAS PROC FREQ
a. SAS PROC FREQ with tables option ( single variable)
Using SAS Proc Freq without any options is usually not recommends, particularly if you have a large dataset which contains variables that have many unique values (levels). Tables statement use in such cases.
Example-
Proc  freq data=SASHelp.cars ;
Tables Origin;
Run;
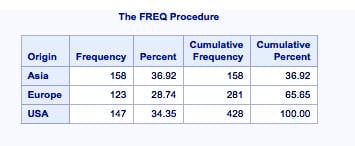
SAS PROC FREQ – Single Variable
b. Multiple variable frequency distributions
Many numbers of tables can be generated for as many variables that are present in the dataset.
Example-
PROC FREQ DATA=sample;
TABLE State Rank;
RUN;
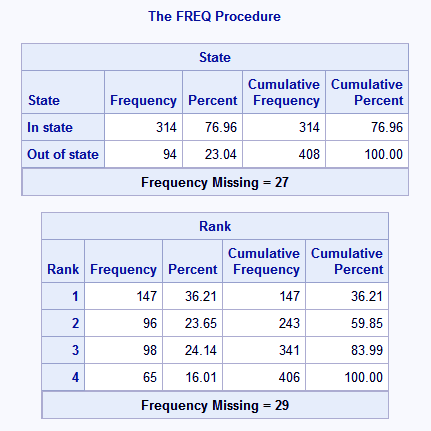
SAS PROC FREQ – Multiple Variable
Missing Values in Frequency Table
It is not necessary that our data always must have values, sometimes there are missing values in a data. When SAS frequency distribution table creates, it also prints the number of missing values in the variable.
To know the frequency, percentage of missing values inside the categorical variable, we must specify it in the tables statement.
Example-
PROC FREQ DATA=sample;
    TABLE State Rank / MISSING;
RUN;
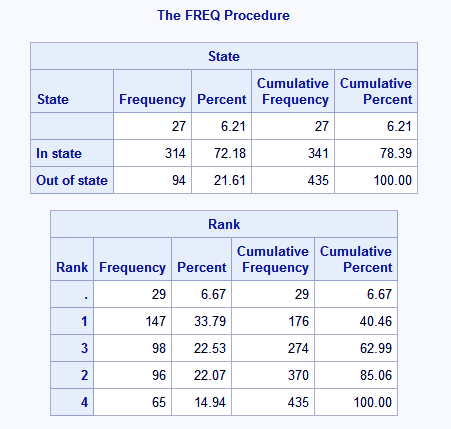
Missing Values in Frequency Table
Ordering Values in the Table
You can use SAS proc freq to determine the most or least commonly occurring values within a variable.
Example-
Proc freq data=SASHelp.cars order=freq;
Tables type origin;
Run;
The resulting tables shows the frequency of each variable sorted with the most common variable on top and the least common on the bottom:
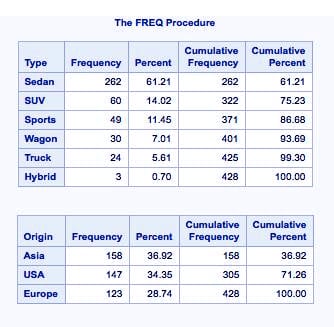
Ordering Values in the Table
This was all in SAS Frequency Distribution Tutorial. Hope you like our explanation.
Conclusion
Hence, we hope you all understood how we can use the PROC FREQ procedure to find SAS frequency distribution of categorical variables in our dataset.
In conclusion, we also saw how can we create a Single variable and multiple variable SAS frequency distributions, a frequency of missing values and, ordering values. Furthermore, if you have any query feel free to ask in a comment section.
Did we exceed your expectations?
If Yes, share your valuable feedback on Google


Suppose you need a table describing the frequency of data missing for over 200+ variables in a single table, how would you write that code?