Quantile Regression in SAS/STAT – 3 Easy Procedures
FREE Online Courses: Dive into Knowledge for Free. Learn More!
In this SAS/STAT Tutorial, we are going to study another type of analysis, called Quantile Regression in SAS/STAT and how can we used Quantile Regression in SAS/STAT. Moreover, we will discuss SAS Quantile Regression Procedures: PROC QUANTLIFE, PROC QUANTREG, and PROC QUANTSELECT with examples and syntax.
So, let’s start with Quantile Regression in SAS/STAT.
What is SAS/STAT Quantile Regression?
The staggering amount of data and it’s complexity in research and business analytics requires versatile, efficient and scalable methods of building statistical and predictive models. Through the process of quantile regression, we fit some conditional quantiles of the response variable along with a generalized linear model that does not take a parametric form; in other words, it gives you information that you would not obtain in the first place from any basic regression methods.
Quantile regression in SAS/STAT provides insights into various applications such as risk management. Furthermore, SAS quantile regression is also capable of modeling the entire conditional distribution which is an important part of many applications.
The main advantage of SAS quantile regression over other regression procedures is its flexibility for modeling data that is heterogeneous in nature and that has conditional distributions.
Procedures for Quantile Regression in SAS/STAT
Following procedures are used to compute quantile regression in SAS/STAT of a sample data. Let us explore it.
a. PROC QUANTLIFE
The QUANTLIFE procedure in SAS/STAT quantile regression analysis for data by using methods that are based on generalizations of two estimators namely the Kaplan-Meier and the Nelson-Aalen. It creates an output data set that contains function estimates for every set of covariates.
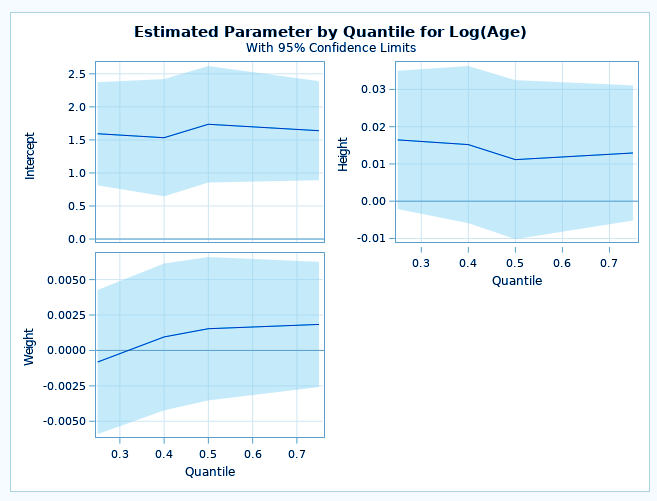
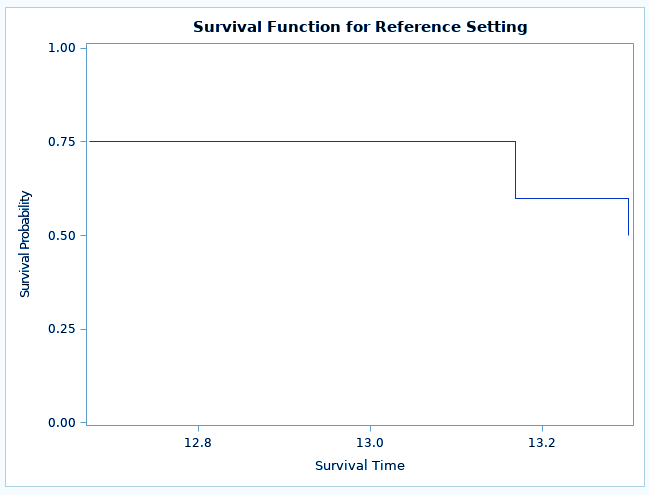
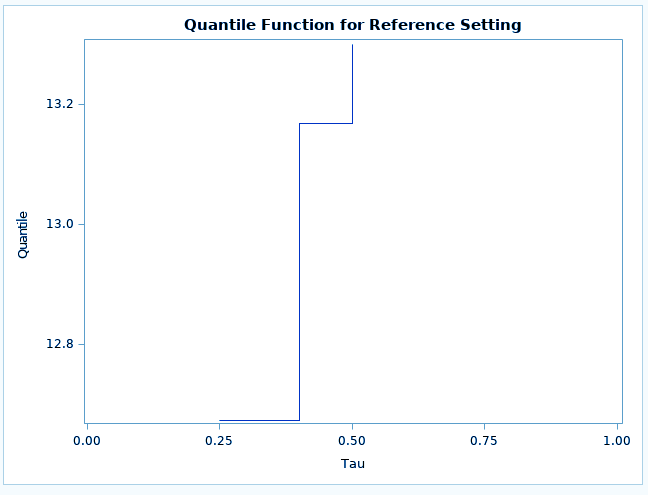
It also supports different hypothesis tests for the regression parameter and automatically creates survival plots, quantile process plots, and conditional quantile plots.
A Syntax of PROC QUANTLIFE-
PROC QUANTLIFE DATASET <options>;
CLASS <variables>;
MODEL response = <effects> </ options>;
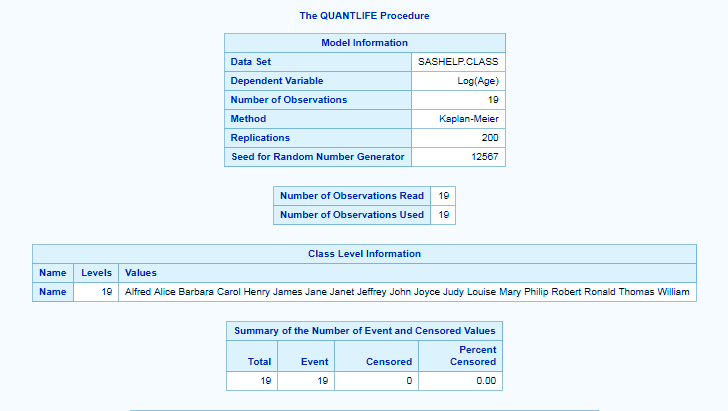
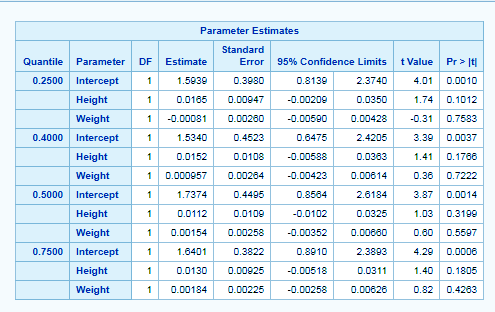
PROC QUANTLIFE Example-
ods graphics on;
proc quantlife data=sashelp.class  log plots=all seed=12567;
class name;
model age=height weight / quantile=(0.25 0.5 0.4 0.75);
run;
b. PROC QUANTREG
The QUANTREG procedure in SAS/STAT uses quantile regression to model the effects of covariates on quantiles of a response variable by creating an output data set that contains the parameter estimates for all quantiles.
We can also perform different hypothesis tests such as ANOVA, t-tests, and also obtain specific nonlinear transformations. The output data set contains a set of predicted values, estimated errors, and other statistics.
A Syntax of PROC QUANTREG-
PROC QUANTREG dataset <options>;
CLASS <variables>;
MODEL response = <effects> </ options>;
The PROC QUANTREG and MODEL statements are required.
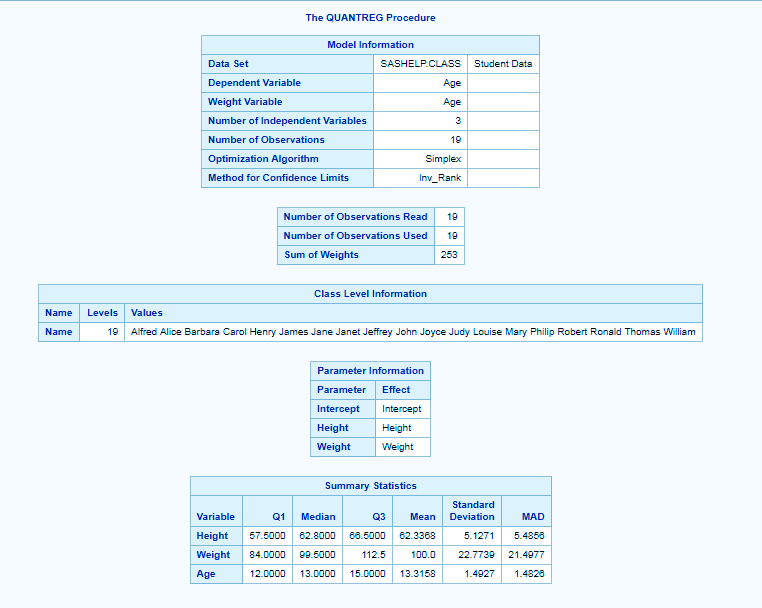
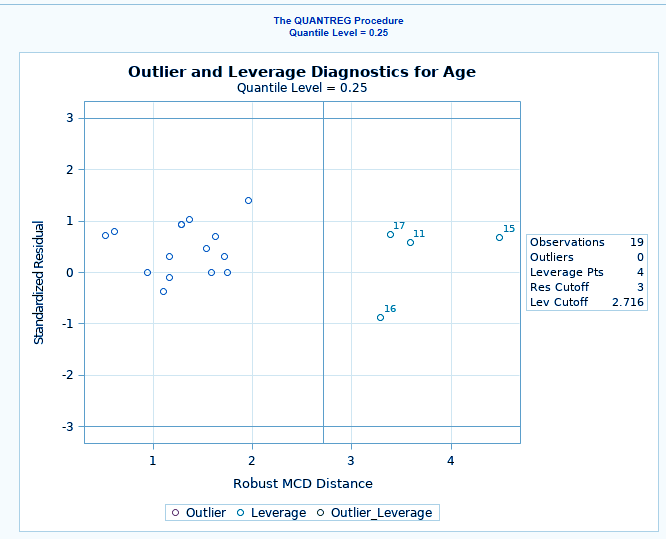
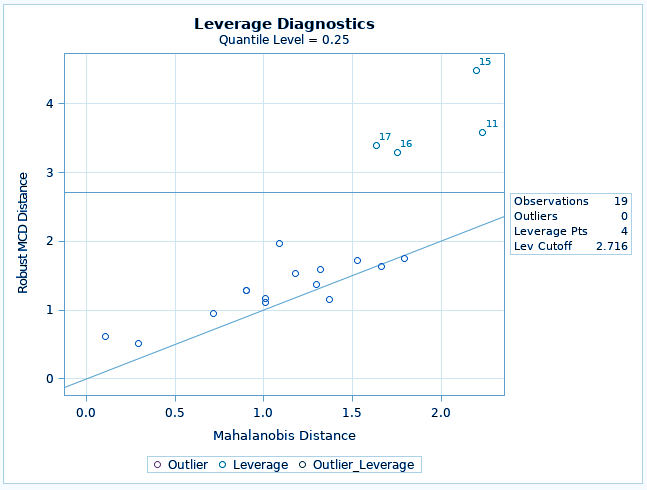
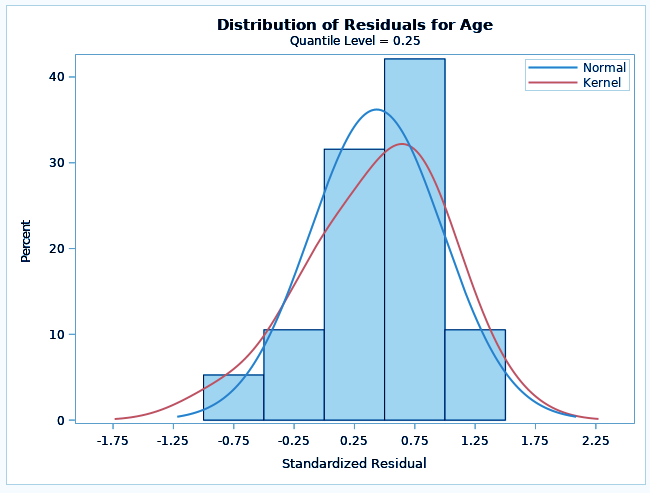
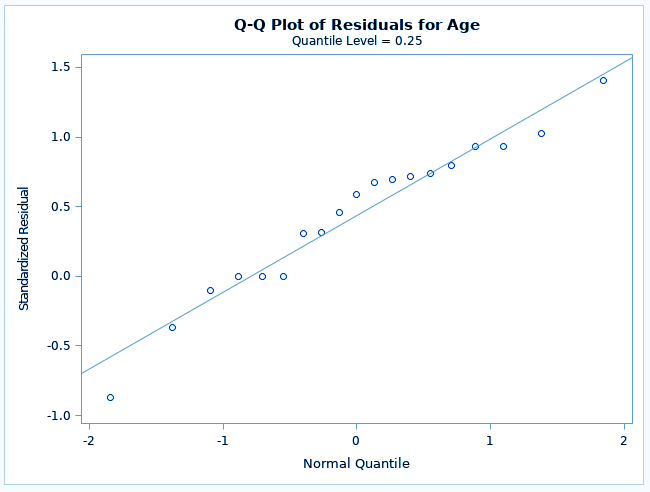
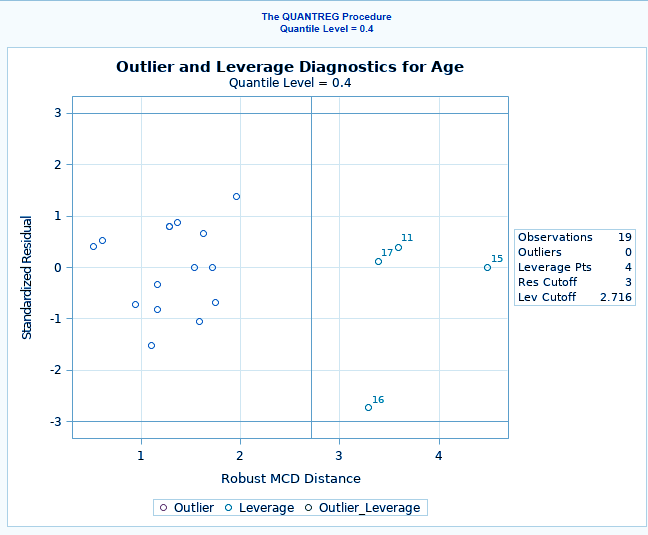
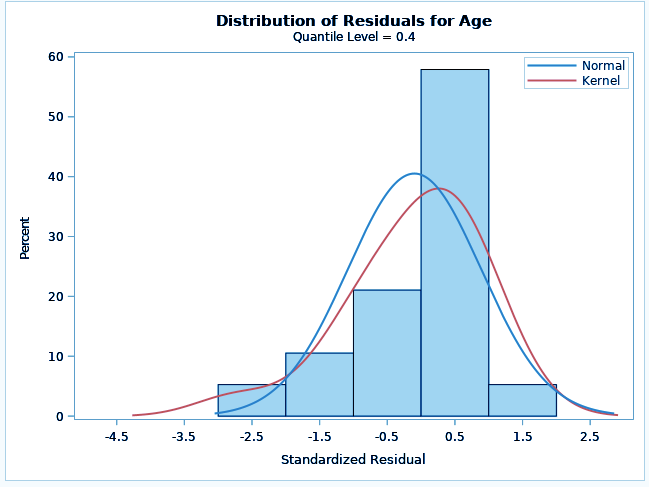
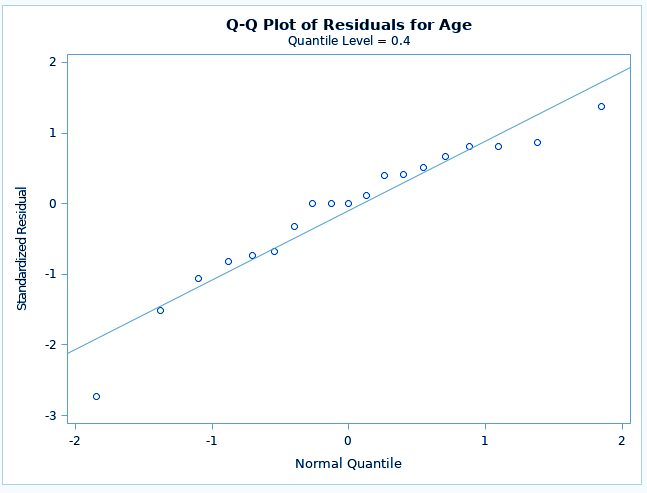
PROC QUANTREG Example-
ods graphics on;
proc quantreg data=sashelp.class ;
class name;
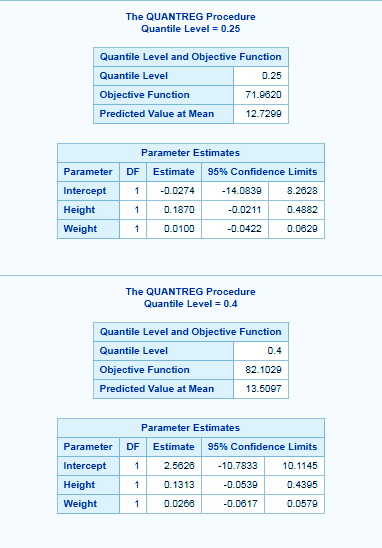
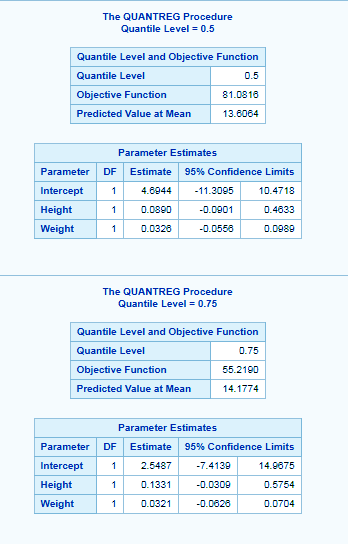
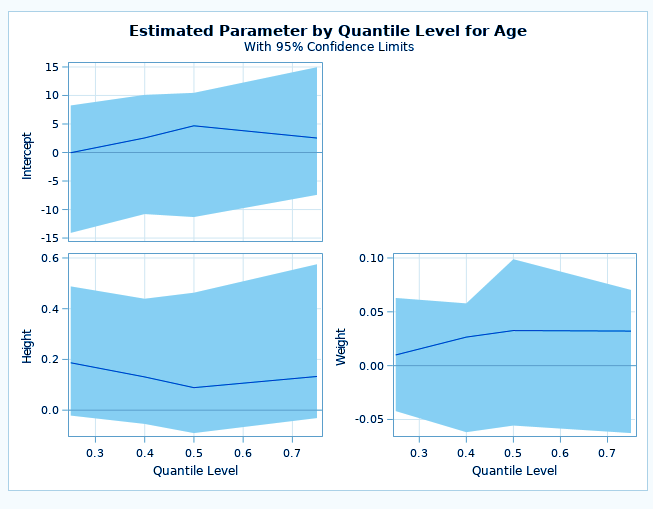
model age=height weight / quantile=(0.25 0.5 0.4 0.75) plots= all;
run;
Here, QUANTILE=option requests an estimate of quantile process for each regression parameter and displays plots for each quantile.
c. PROC QUANTSELECT
We have already discussed this procedure in detail in SAS/STAT Model Selection tutorial.
This was all about SAS/STAT Quantile Regression Tutorial. Hope you like our explanation.
Conclusion
Hence, this was a complete description of the procedures for quantile regression in SAS/STAT: PROC QUANTLIFE, PROC QUANTREG, and PROC QUANTSELECT with syntax and examples.
If you are Happy with DataFlair, do not forget to make us happy with your positive feedback on Google
