SparkR DataFrame and DataFrame Operations
1. Objective
In this article, we will learn the whole concept of SparkR DataFrame. Further, we will also learn SparkR DataFrame Operations and how to run SQL queries from SparkR.
SparkR DataFrame operations
You must test your Spark Learning so far
2. SparkR DataFrame
Data is organized as a distributed collection of data into named columns. That we call on SparkDataFrame. Basically, it is as same as a table in a relational database or a data frame in R. Moreover, we can construct a DataFrame from a wide array of sources. For example structured data files, tables in Hive, external databases. Also, existing local R data frames are used for construction
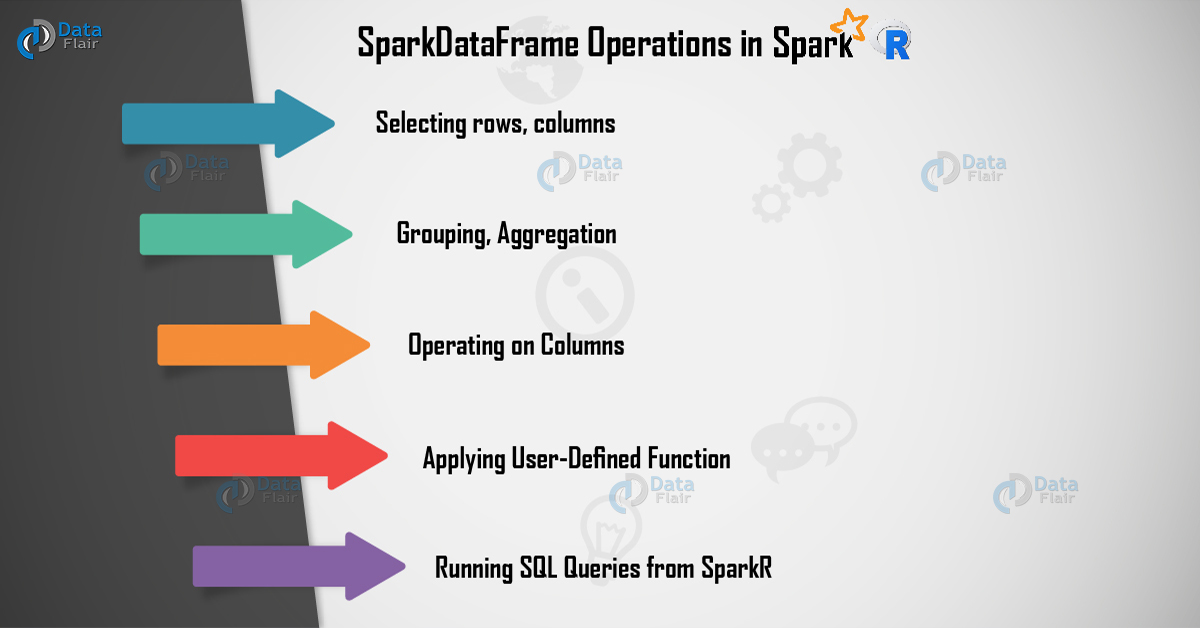
3. SparkR DataFrame Operations
Basically, for structured data processing, SparkDataFrames supports many functions. Let’s discuss some basic examples of it:
i. Selecting rows, columns
# Create the SparkDataFrame
df <- as.DataFrame(faithful)
# Get basic information about the SparkDataFrame
df
## SparkDataFrame[eruptions:double, waiting:double]
# Select only the “eruptions” column
head(select(df, df$eruptions))
## eruptions
##1 3.600
##2 1.800
##3 3.333
# You can also pass in column name as strings
head(select(df, “eruptions”))
# Filter the SparkDataFrame to only retain rows with wait times shorter than 50 mins
head(filter(df, df$waiting < 50))
## eruptions waiting
##1 1.750 47
##2 1.750 47
##3 1.867 48
Have a look at Spark Paired RDD
ii. Grouping, Aggregation
To aggregate data after grouping, SparkR DataFrame support various commonly used functions.
For example, as shown below we are computing a histogram of the waiting time in the faithful dataset.
# We use the `n` operator to count the number of times each waiting time appears
head(summarize(groupBy(df, df$waiting), count = n(df$waiting)))
## waiting count
##1 70 4
##2 67 1
##3 69 2
# We can also sort the output from the aggregation to get the most common waiting times
waiting_counts <- summarize(groupBy(df, df$waiting), count = n(df$waiting))
head(arrange(waiting_counts, desc(waiting_counts$count)))
## waiting count
##1 78 15
##2 83 14
##3 81 13
Do you know about Spark Executor
iii. Operating on Columns
There are some Functions that can directly apply to columns. It works for data processing and during aggregation. Here, an example shows the use of basic arithmetic functions.
# Convert waiting time from hours to seconds.
# Note that we can assign this to a new column in the same SparkDataFrame
df$waiting_secs <- df$waiting * 60
head(df)
## eruptions waiting waiting_secs
##1 3.600 79 4740
##2 1.800 54 3240
##3 3.333 74 4440
iv. Applying User-Defined Function
There are various kinds of User-Defined Functions supported in SparkR:
a. Run a given function on a large dataset using dapply or dapplyCollect
- Dapply
Basically, Dapply applies a function to each partition of a SparkDataFrame. That function to be applied to each partition of the SparkDataFrame. There is one parameter required, to which a data.frame corresponds to each partition will be passed. The output of function should be a data.frame. The schema specifies the row format of the resulting a SparkDataFrame. It must match to data types of returned value.
Have a look at SparkContext
# Convert waiting time from hours to seconds.
# Note that we can apply UDF to DataFrame.
schema <- structType(structField(“eruptions”, “double”), structField(“waiting”, “double”),
structField(“waiting_secs”, “double”))
df1 <- dapply(df, function(x) { x <- cbind(x, x$waiting * 60) }, schema)
head(collect(df1))
## eruptions waiting waiting_secs
##1 3.600 79 4740
##2 1.800 54 3240
##3 3.333 74 4440
##4 2.283 62 3720
##5 4.533 85 5100
##6 2.883 55 3300
- dapplyCollect
As same as dapply, apply a function to each partition of a SparkDataFrame. Also collect the result back. The output of function should be a data.frame. However, Schema is not required to be passed.
Note: dapplyCollect can fail if the output of UDF run on all the partition. It cannot be pulled to the driver and fit in driver memory.
Do you know about Spark Machine Learning with R
# Convert waiting time from hours to seconds.
# Note that we can apply UDF to DataFrame and return a R’s data.frame
ldf <- dapplyCollect(
df,
function(x) {
x <- cbind(x, “waiting_secs” = x$waiting * 60)
})
head(ldf, 3)
## eruptions waiting waiting_secs
##1 3.600 79 4740
##2 1.800 54 3240
##3 3.333 74 4440
b. Run a given function on a large dataset grouping by input column(s) and using gapply or gapplyCollect
- Gapply
Apply a function to each group of a SparkDataFrame. The function is to be applied to each group of the SparkDataFrame and should have only two parameters: grouping key and R data.frame corresponding to that key. The groups are chosen from SparkDataFrames column(s). The output of function should be a data.frame. The schema specifies the row format of the resulting SparkDataFrame. It must represent R function’s output schema on the basis of Spark data types. The column names of the returned data.frame are set by the user.
Best preparation for upcoming Spark Interview
# Determine six waiting times with the largest eruption time in minutes.
schema <- structType(structField(“waiting”, “double”), structField(“max_eruption”, “double”))
result <- gapply(
df,
“waiting”,
function(key, x) {
y <- data.frame(key, max(x$eruptions))
},
schema)
head(collect(arrange(result, “max_eruption”, decreasing = TRUE)))
## waiting max_eruption
##1 64 5.100
##2 69 5.067
##3 71 5.033
##4 87 5.000
##5 63 4.933
##6 89 4.900
- gapplyCollect
As same as gapply, it applies a function to each partition of a SparkDataFrame. Also collects the result back to R data.frame. Here, also the output of the function should be a data.frame. Although, the schema is not required here to be passed.
Note: gapplyCollect can fail if the output of UDF run on all the partition. It cannot be pulled to the driver. Also, fit in driver memory.
Let’s revise the Spark Stage
# Determine six waiting times with the largest eruption time in minutes.
result <- gapplyCollect(
df,
“waiting”,
function(key, x) {
y <- data.frame(key, max(x$eruptions))
colnames(y) <- c(“waiting”, “max_eruption”)
y
})
head(result[order(result$max_eruption, decreasing = TRUE), ])
## waiting max_eruption
##1 64 5.100
##2 69 5.067
##3 71 5.033
##4 87 5.000
##5 63 4.933
##6 89 4.900
c. Run local R functions distributed using spark.lapply
Spark.lapply
As Similar as lapply in native R, spark.lapply runs a function over a list of elements. Also distributes the computations with Spark. The manner in which it Applies a function is similar to doParallel or lapply to elements of a list. Basically, all the results of all computations should fit on a single machine.
You must know about Spark GraphX API
# Perform distributed training of multiple models with spark.lapply. Here, we pass
# a read-only list of arguments which specifies family the generalized linear model should be.
families <- c(“gaussian”, “poisson”)
train <- function(family) {
model <- glm(Sepal.Length ~ Sepal.Width + Species, iris, family = family)
summary(model)
}
# Return a list of model’s summaries
model.summaries <- spark.lapply(families, train)
# Print the summary of each model
print(model.summaries)
v. Running SQL Queries from SparkR
We can also register a SparkR DataFrame as a temporary view in Spark SQL. Basically, that allows us to run SQL queries over its data. Moreover, to run SQL queries programmatically, sql function enables applications. Also, returns the result as a SparkDataFrame.
# Load a JSON file
people <- read.df(“./examples/src/main/resources/people.json”, “json”)
# Register this SparkDataFrame as a temporary view.
createOrReplaceTempView(people, “people”)
# SQL statements can be run by using the sql method
teenagers <- sql(“SELECT name FROM people WHERE age >= 13 AND age <= 19”)
head(teenagers)
## name
##1 Justin
Let’s check the comparison of Spark Batch Processing and Real-time Processing
So, this was all in SparkR DataFrame Tutorial. Hope you like our explanation.
4. Conclusion – SparkR DataFrame
As a result, we have seen all the SparkR DataFrame Operations. Also, we have seen several examples to understand the topic well. Although, if any query occurs, feel free to ask in the comment section.
See also –
Your opinion matters
Please write your valuable feedback about DataFlair on Google


