Python Project on Traffic Signs Recognition with 95% Accuracy using CNN & Keras
Master Python with 70+ Hands-on Projects and Get Job-ready - Learn Python
Python Project – Traffic Signs Recognition
You must have heard about the self-driving cars in which the passenger can fully depend on the car for traveling. But to achieve level 5 autonomous, it is necessary for vehicles to understand and follow all traffic rules.
In the world of Artificial Intelligence and advancement in technologies, many researchers and big companies like Tesla, Uber, Google, Mercedes-Benz, Toyota, Ford, Audi, etc are working on autonomous vehicles and self-driving cars. So, for achieving accuracy in this technology, the vehicles should be able to interpret traffic signs and make decisions accordingly.
This is the 8th project of DataFlair’s series of 20 Python projects. I recommend you to bookmark the previous projects:
- Fake News Detection Python Project
- Parkinson’s Disease Detection Python Project
- Color Detection Python Project
- Speech Emotion Recognition Python Project
- Breast Cancer Classification Python Project
- Age and Gender Detection Python Project
- Handwritten Digit Recognition Python Project
- Chatbot Python Project
- Driver Drowsiness Detection Python Project
- Traffic Signs Recognition Python Project
- Image Caption Generator Python Project
What is Traffic Signs Recognition?
There are several different types of traffic signs like speed limits, no entry, traffic signals, turn left or right, children crossing, no passing of heavy vehicles, etc. Traffic signs classification is the process of identifying which class a traffic sign belongs to.
Traffic Signs Recognition – About the Python Project
In this Python project example, we will build a deep neural network model that can classify traffic signs present in the image into different categories. With this model, we are able to read and understand traffic signs which are a very important task for all autonomous vehicles.
The Dataset of Python Project
For this project, we are using the public dataset available at Kaggle:
The dataset contains more than 50,000 images of different traffic signs. It is further classified into 43 different classes. The dataset is quite varying, some of the classes have many images while some classes have few images. The size of the dataset is around 300 MB. The dataset has a train folder which contains images inside each class and a test folder which we will use for testing our model.

Prerequisites
This project requires prior knowledge of Keras, Matplotlib, Scikit-learn, Pandas, PIL and image classification.
To install the necessary packages used for this Python data science project, enter the below command in your terminal:
pip install tensorflow keras sklearn matplotlib pandas pil
Want to become a pro in Python?
Check out 270+ Free Python Tutorials
Steps to Build the Python Project
To get started with the project, download and unzip the file from this link – Traffic Signs Recognition Zip File
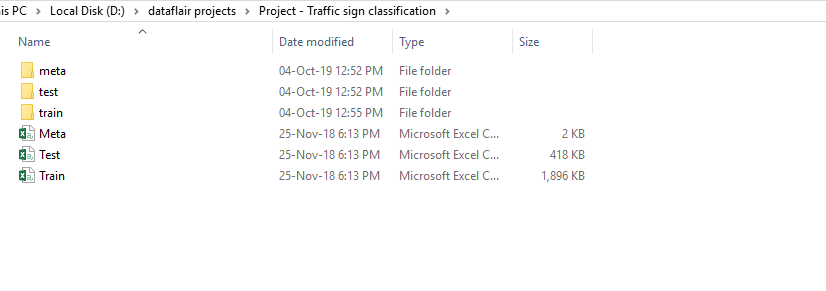
And extract the files into a folder such that you will have a train, test and a meta folder.
Create a Python script file and name it traffic_signs.py in the project folder.
Our approach to building this traffic sign classification model is discussed in four steps:
- Explore the dataset
- Build a CNN model
- Train and validate the model
- Test the model with test dataset
Step 1: Explore the dataset
Our ‘train’ folder contains 43 folders each representing a different class. The range of the folder is from 0 to 42. With the help of the OS module, we iterate over all the classes and append images and their respective labels in the data and labels list.
The PIL library is used to open image content into an array.
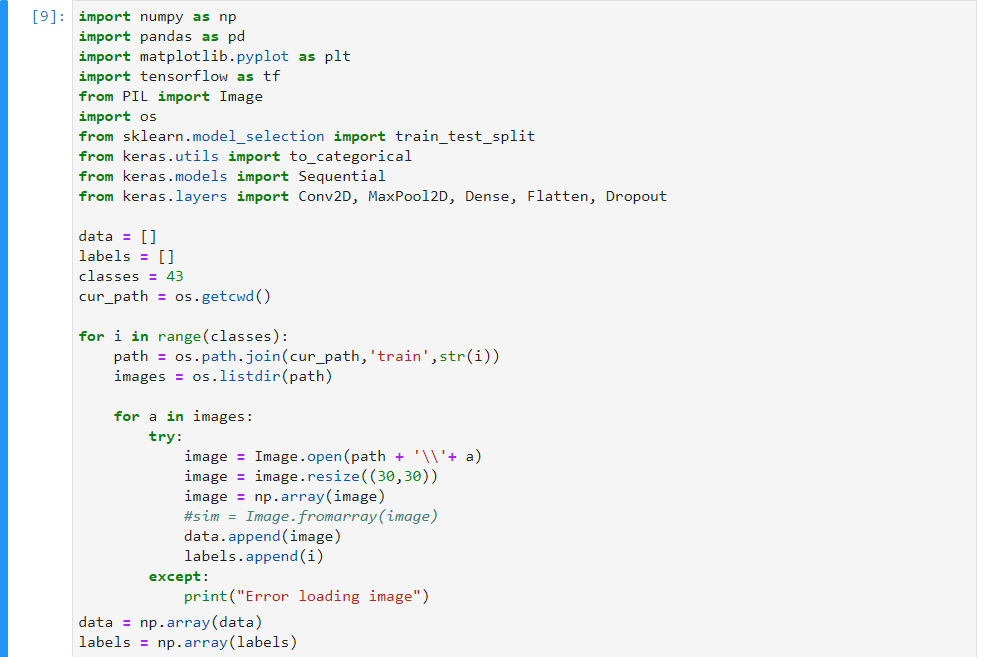
Finally, we have stored all the images and their labels into lists (data and labels).
We need to convert the list into numpy arrays for feeding to the model.
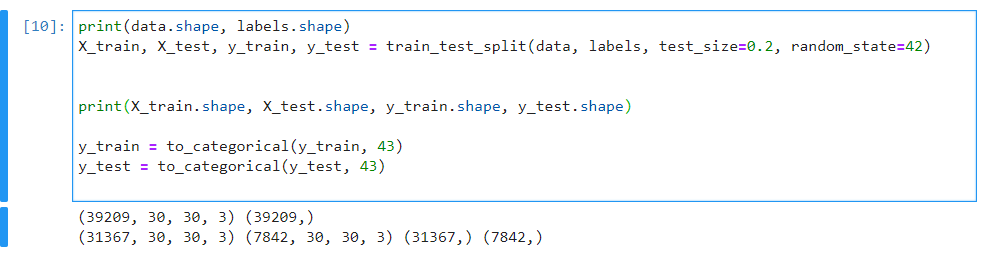
The shape of data is (39209, 30, 30, 3) which means that there are 39,209 images of size 30×30 pixels and the last 3 means the data contains colored images (RGB value).
With the sklearn package, we use the train_test_split() method to split training and testing data.
From the keras.utils package, we use to_categorical method to convert the labels present in y_train and t_test into one-hot encoding.
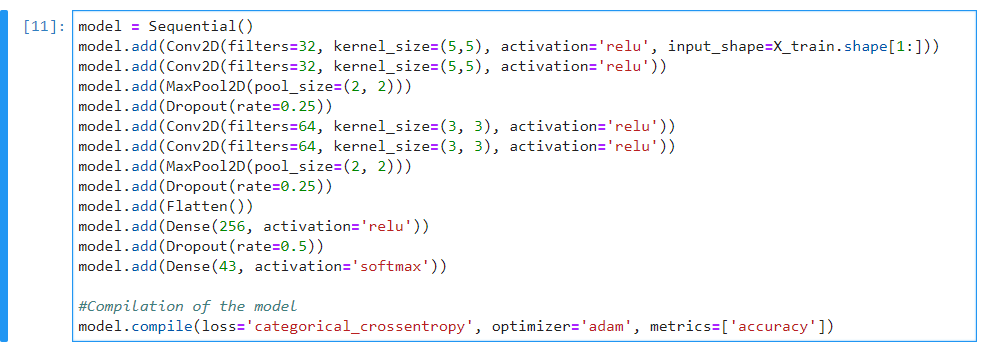
Step 2: Build a CNN model
To classify the images into their respective categories, we will build a CNN model (Convolutional Neural Network). CNN is best for image classification purposes.
The architecture of our model is:
- 2 Conv2D layer (filter=32, kernel_size=(5,5), activation=”relu”)
- MaxPool2D layer ( pool_size=(2,2))
- Dropout layer (rate=0.25)
- 2 Conv2D layer (filter=64, kernel_size=(3,3), activation=”relu”)
- MaxPool2D layer ( pool_size=(2,2))
- Dropout layer (rate=0.25)
- Flatten layer to squeeze the layers into 1 dimension
- Dense Fully connected layer (256 nodes, activation=”relu”)
- Dropout layer (rate=0.5)
- Dense layer (43 nodes, activation=”softmax”)
We compile the model with Adam optimizer which performs well and loss is “categorical_crossentropy” because we have multiple classes to categorise.
Steps 3: Train and validate the model
After building the model architecture, we then train the model using model.fit(). I tried with batch size 32 and 64. Our model performed better with 64 batch size. And after 15 epochs the accuracy was stable.
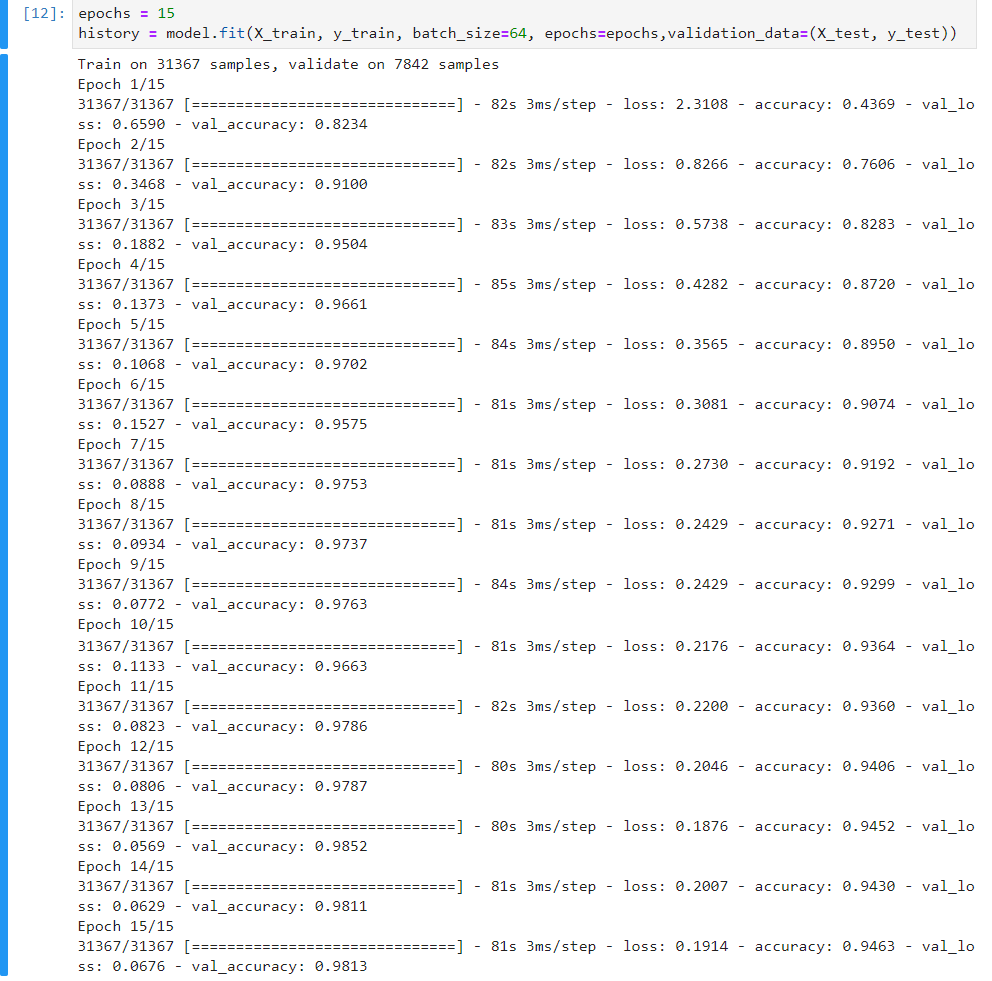
Our model got a 95% accuracy on the training dataset. With matplotlib, we plot the graph for accuracy and the loss.
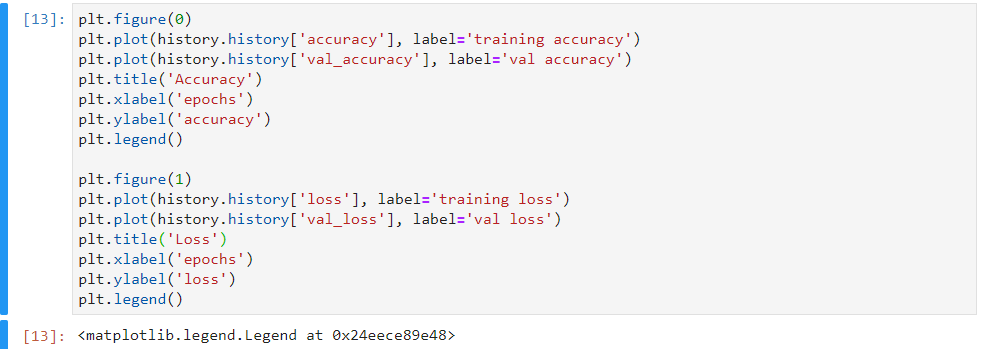
Plotting Accuracy
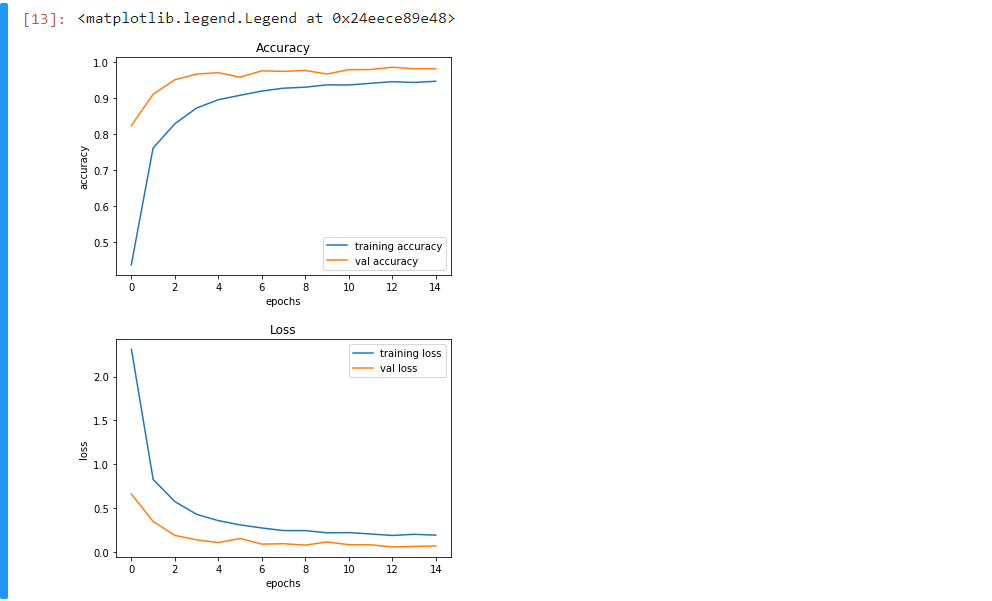
Accuracy and Loss Graphs
Step 4: Test our model with test dataset
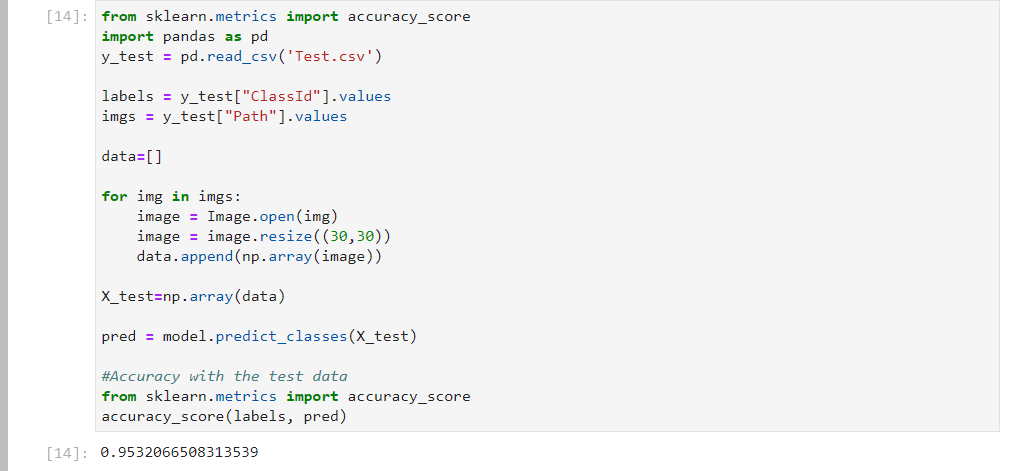
Our dataset contains a test folder and in a test.csv file, we have the details related to the image path and their respective class labels. We extract the image path and labels using pandas. Then to predict the model, we have to resize our images to 30×30 pixels and make a numpy array containing all image data. From the sklearn.metrics, we imported the accuracy_score and observed how our model predicted the actual labels. We achieved a 95% accuracy in this model.
In the end, we are going to save the model that we have trained using the Keras model.save() function.
model.save(‘traffic_classifier.h5’)
Full Source code:
import numpy as np
import pandas as pd
import matplotlib.pyplot as plt
import cv2
import tensorflow as tf
from PIL import Image
import os
from sklearn.model_selection import train_test_split
from keras.utils import to_categorical
from keras.models import Sequential, load_model
from keras.layers import Conv2D, MaxPool2D, Dense, Flatten, Dropout

data = []
labels = []
classes = 43
cur_path = os.getcwd()

#Retrieving the images and their labels
for i in range(classes):
    path = os.path.join(cur_path,'train',str(i))
    images = os.listdir(path)

    for a in images:
        try:
            image = Image.open(path + '\\'+ a)
            image = image.resize((30,30))
            image = np.array(image)
            #sim = Image.fromarray(image)
            data.append(image)
            labels.append(i)
        except:
            print("Error loading image")

#Converting lists into numpy arrays
data = np.array(data)
labels = np.array(labels)

print(data.shape, labels.shape)
#Splitting training and testing dataset
X_train, X_test, y_train, y_test = train_test_split(data, labels, test_size=0.2, random_state=42)

print(X_train.shape, X_test.shape, y_train.shape, y_test.shape)

#Converting the labels into one hot encoding
y_train = to_categorical(y_train, 43)
y_test = to_categorical(y_test, 43)

#Building the model
model = Sequential()
model.add(Conv2D(filters=32, kernel_size=(5,5), activation='relu', input_shape=X_train.shape[1:]))
model.add(Conv2D(filters=32, kernel_size=(5,5), activation='relu'))
model.add(MaxPool2D(pool_size=(2, 2)))
model.add(Dropout(rate=0.25))
model.add(Conv2D(filters=64, kernel_size=(3, 3), activation='relu'))
model.add(Conv2D(filters=64, kernel_size=(3, 3), activation='relu'))
model.add(MaxPool2D(pool_size=(2, 2)))
model.add(Dropout(rate=0.25))
model.add(Flatten())
model.add(Dense(256, activation='relu'))
model.add(Dropout(rate=0.5))
model.add(Dense(43, activation='softmax'))

#Compilation of the model
model.compile(loss='categorical_crossentropy', optimizer='adam', metrics=['accuracy'])

epochs = 15
history = model.fit(X_train, y_train, batch_size=32, epochs=epochs, validation_data=(X_test, y_test))
model.save("my_model.h5")

#plotting graphs for accuracy
plt.figure(0)
plt.plot(history.history['accuracy'], label='training accuracy')
plt.plot(history.history['val_accuracy'], label='val accuracy')
plt.title('Accuracy')
plt.xlabel('epochs')
plt.ylabel('accuracy')
plt.legend()
plt.show()

plt.figure(1)
plt.plot(history.history['loss'], label='training loss')
plt.plot(history.history['val_loss'], label='val loss')
plt.title('Loss')
plt.xlabel('epochs')
plt.ylabel('loss')
plt.legend()
plt.show()

#testing accuracy on test dataset
from sklearn.metrics import accuracy_score

y_test = pd.read_csv('Test.csv')

labels = y_test["ClassId"].values
imgs = y_test["Path"].values

data=[]

for img in imgs:
    image = Image.open(img)
    image = image.resize((30,30))
    data.append(np.array(image))

X_test=np.array(data)

pred = model.predict_classes(X_test)

#Accuracy with the test data
from sklearn.metrics import accuracy_score
print(accuracy_score(labels, pred))

model.save(‘traffic_classifier.h5’)
WAIT! Have you checked our latest tutorial on OpenCV & Computer Vision
Traffic Signs Classifier GUI
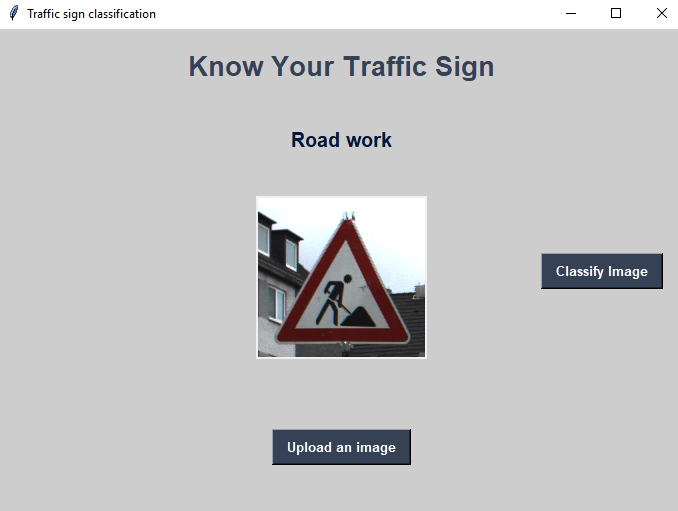
Now we are going to build a graphical user interface for our traffic signs classifier with Tkinter. Tkinter is a GUI toolkit in the standard python library. Make a new file in the project folder and copy the below code. Save it as gui.py and you can run the code by typing python gui.py in the command line.
In this file, we have first loaded the trained model ‘traffic_classifier.h5’ using Keras. And then we build the GUI for uploading the image and a button is used to classify which calls the classify() function. The classify() function is converting the image into the dimension of shape (1, 30, 30, 3). This is because to predict the traffic sign we have to provide the same dimension we have used when building the model. Then we predict the class, the model.predict_classes(image) returns us a number between (0-42) which represents the class it belongs to. We use the dictionary to get the information about the class. Here’s the code for the gui.py file.
Code:
import tkinter as tk
from tkinter import filedialog
from tkinter import *
from PIL import ImageTk, Image

import numpy
#load the trained model to classify sign
from keras.models import load_model
model = load_model('traffic_classifier.h5')

#dictionary to label all traffic signs class.
classes = { 1:'Speed limit (20km/h)',
            2:'Speed limit (30km/h)',
            3:'Speed limit (50km/h)',
            4:'Speed limit (60km/h)',
            5:'Speed limit (70km/h)',
            6:'Speed limit (80km/h)',
            7:'End of speed limit (80km/h)',
            8:'Speed limit (100km/h)',
            9:'Speed limit (120km/h)',
            10:'No passing',
            11:'No passing veh over 3.5 tons',
            12:'Right-of-way at intersection',
            13:'Priority road',
            14:'Yield',
            15:'Stop',
            16:'No vehicles',
            17:'Veh > 3.5 tons prohibited',
            18:'No entry',
            19:'General caution',
            20:'Dangerous curve left',
            21:'Dangerous curve right',
            22:'Double curve',
            23:'Bumpy road',
            24:'Slippery road',
            25:'Road narrows on the right',
            26:'Road work',
            27:'Traffic signals',
            28:'Pedestrians',
            29:'Children crossing',
            30:'Bicycles crossing',
            31:'Beware of ice/snow',
            32:'Wild animals crossing',
            33:'End speed + passing limits',
            34:'Turn right ahead',
            35:'Turn left ahead',
            36:'Ahead only',
            37:'Go straight or right',
            38:'Go straight or left',
            39:'Keep right',
            40:'Keep left',
            41:'Roundabout mandatory',
            42:'End of no passing',
            43:'End no passing veh > 3.5 tons' }

#initialise GUI
top=tk.Tk()
top.geometry('800x600')
top.title('Traffic sign classification')
top.configure(background='#CDCDCD')

label=Label(top,background='#CDCDCD', font=('arial',15,'bold'))
sign_image = Label(top)

def classify(file_path):
    global label_packed
    image = Image.open(file_path)
    image = image.resize((30,30))
    image = numpy.expand_dims(image, axis=0)
    image = numpy.array(image)
    pred = model.predict_classes([image])[0]
    sign = classes[pred+1]
    print(sign)
    label.configure(foreground='#011638', text=sign)

def show_classify_button(file_path):
    classify_b=Button(top,text="Classify Image",command=lambda: classify(file_path),padx=10,pady=5)
    classify_b.configure(background='#364156', foreground='white',font=('arial',10,'bold'))
    classify_b.place(relx=0.79,rely=0.46)

def upload_image():
    try:
        file_path=filedialog.askopenfilename()
        uploaded=Image.open(file_path)
        uploaded.thumbnail(((top.winfo_width()/2.25),(top.winfo_height()/2.25)))
        im=ImageTk.PhotoImage(uploaded)

        sign_image.configure(image=im)
        sign_image.image=im
        label.configure(text='')
        show_classify_button(file_path)
    except:
        pass

upload=Button(top,text="Upload an image",command=upload_image,padx=10,pady=5)
upload.configure(background='#364156', foreground='white',font=('arial',10,'bold'))

upload.pack(side=BOTTOM,pady=50)
sign_image.pack(side=BOTTOM,expand=True)
label.pack(side=BOTTOM,expand=True)
heading = Label(top, text="Know Your Traffic Sign",pady=20, font=('arial',20,'bold'))
heading.configure(background='#CDCDCD',foreground='#364156')
heading.pack()
top.mainloop()
Output:
Summary
In this Python project with source code, we have successfully classified the traffic signs classifier with 95% accuracy and also visualized how our accuracy and loss changes with time, which is pretty good from a simple CNN model.
Time to become the next Python developer
Enroll for the Python Online Course at DataFlair now!
If you liked the Python project on traffic signs classification, do share it on social media with your friends and colleagues. For more projects like this, keep visiting DataFlair.
Did we exceed your expectations?
If Yes, share your valuable feedback on Google


I m not able to get the output for this as shown here. Please help to resolve it.
i can help you if you are using windows 10
I’m getting invalid syntax what to do
Can u Pls let me know whether this project can be deployed in a android app by converting it into tensorflow lite model
Hello Pavithra,
We are here to help you.
Yes use the tensorflow lite converter to convert the model into a tensorflow lite model then you can also deploy it in an android app.
thank you for your replay
can u help how to run this code……there are so many files in this project
Can you tell me the version of your Python, Tensorflow, and Keras you work on this project? because I have problems to run the program with the latest version of those libraries.
I have the same problem too
tell me if you could run that
can you tell me how to run this program.
Why you are not addressing the class skew of the dataset??
I am getting error with tensor flow as cannot concatnate str..
This is a python version error ,python 2.7 and 3.5 use different str encoding using utf-8 as encoder
how i can open or view the traffic_classifier.h5 file
Using a Sublime Text you can open it and to give you a view it will be a stream of bytecode only
You can do this with the help of Sublime text editor
Good Day! I’d like to train this model in a different data set, but I’m not able to do this. I wonder if you could help me to solve this problem, please.
hello victor!! Did you find the original data set to this project….if yes can you please share that
Hi, when I try looping for a in images, I get unexpected eof error. Why is this?thanks
The error occurs when execute “data = np.array(data)”
ValueError: could not broadcast input array from shape (30,30,3) into shape (30,30)
Please help me to fix it.
Thanks
Please add this and convert it to rgb type image
before reshaping
global label_packed
image = Image.open(file_path)
image = Image.convert(‘RGB’) //Add this line there in array 3 represents the RGB value
File traffic_sign:
ERORR: import pandas as pd
ModuleNotFoundError: No module named ‘pandas’
File gui:
ERORR: from PIL import ImageTk, Image
ModuleNotFoundError: No module named ‘PIL’
Sir can please tell what algorithm wer using in this project
it says key error[accuracy] when i run training py file..what do i do
You should convert your image into RGB type.
You can add this line:
image = Image.open(file_path)
Image = Image.convert(‘RGB’) //This line Cheers
hello
my accuracy_score is comming=0.19
i haven’t made any changes in the model
Good day! I have run the code perfectly once. But in the next day, it return the error “Value passed to parameter ‘input’ has DataType uint8 not in list of allowed values: float16, bfloat16, float32, float64”.
I am not sure what is the problem.
Please help me to fix it.
Thanks
Hey. How can I add an original sign next to the one we selected from the tests in the output? thanks in advance
are we really using cv2 anywhere?
Opencv is a python library that allows you to perform image processing , object detection,face detection etc.
This are the some opencv projects in python.
1 Selfie Capture System
2 Fruit Detection
3 Running hill climbing game with hand gestures
4 Face mask detection
Hi this is perfectly working for test folder images. But what about other images for example an image downloaded from internet?
For me this is not working for other images
If I want the output to be presented on a webpage (html) instead of the Gui. how would I do that?
meaning, what code would I need to provide in the html file for that work work?.
which algorithm is used?
My Friend, either you have posted the wrong code, or copied someone else’s and that too badly. Model is far from ideal, gives 30% accuracy in 30 epochs, I don’t know how you got 95%, that too is an overfit. Maybe the dataset has changed.
Hello, after fitting the model and obtaining an accuracy of 96% when I make the forecast using the model, I am obtaining an accuracy of 58% only
Hiii…
ValueError: Error when checking input: expected conv2d_1_input to have shape (30, 30, 3) but got array with shape (30, 30, 4)
Exception in Tkinter callback
I’m getting error like this .
can u plz help me
thank u
In this project which type pre-processing are used
this project will run on which IDE comfortably.
pil module is not exist in current version. Instead of that can v use pillow module. if v can use suggest me where and all need to do changes
for a in images:
try:
image = Image.open(path + ‘\\’+ a)
image = image.resize((30,30))
image = np.array(image)
data.append(image)
labels.append(i)
except:
print(“Error loading image”)
above code is not working….pls help