Python Project – COVID-19 Spread Analysis with Flask
Python course with 57 real-time projects - Learn Python
In this python project, we will implement a live dashboard for COVID 19 spread analysis. This dashboard will provide many insightful visualizations for the study of coronavirus spread. In this project, we will work on three different datasets and generate different dashboards.
Analyze COVID-19 Virus Spread with Python
We will be using flask and folium python packages for making interactive dashboards.
Flask: It is a web server gateway interface application in python. This is used for developing web apps. Using Flask we can build applications that can scale up to complex applications. Install Flask using:
pip install Flask
Folium: It is a python API for visualizing data. It is a good API to include map related visualizations. Install Folium using:
pip install folium
Download Dataset
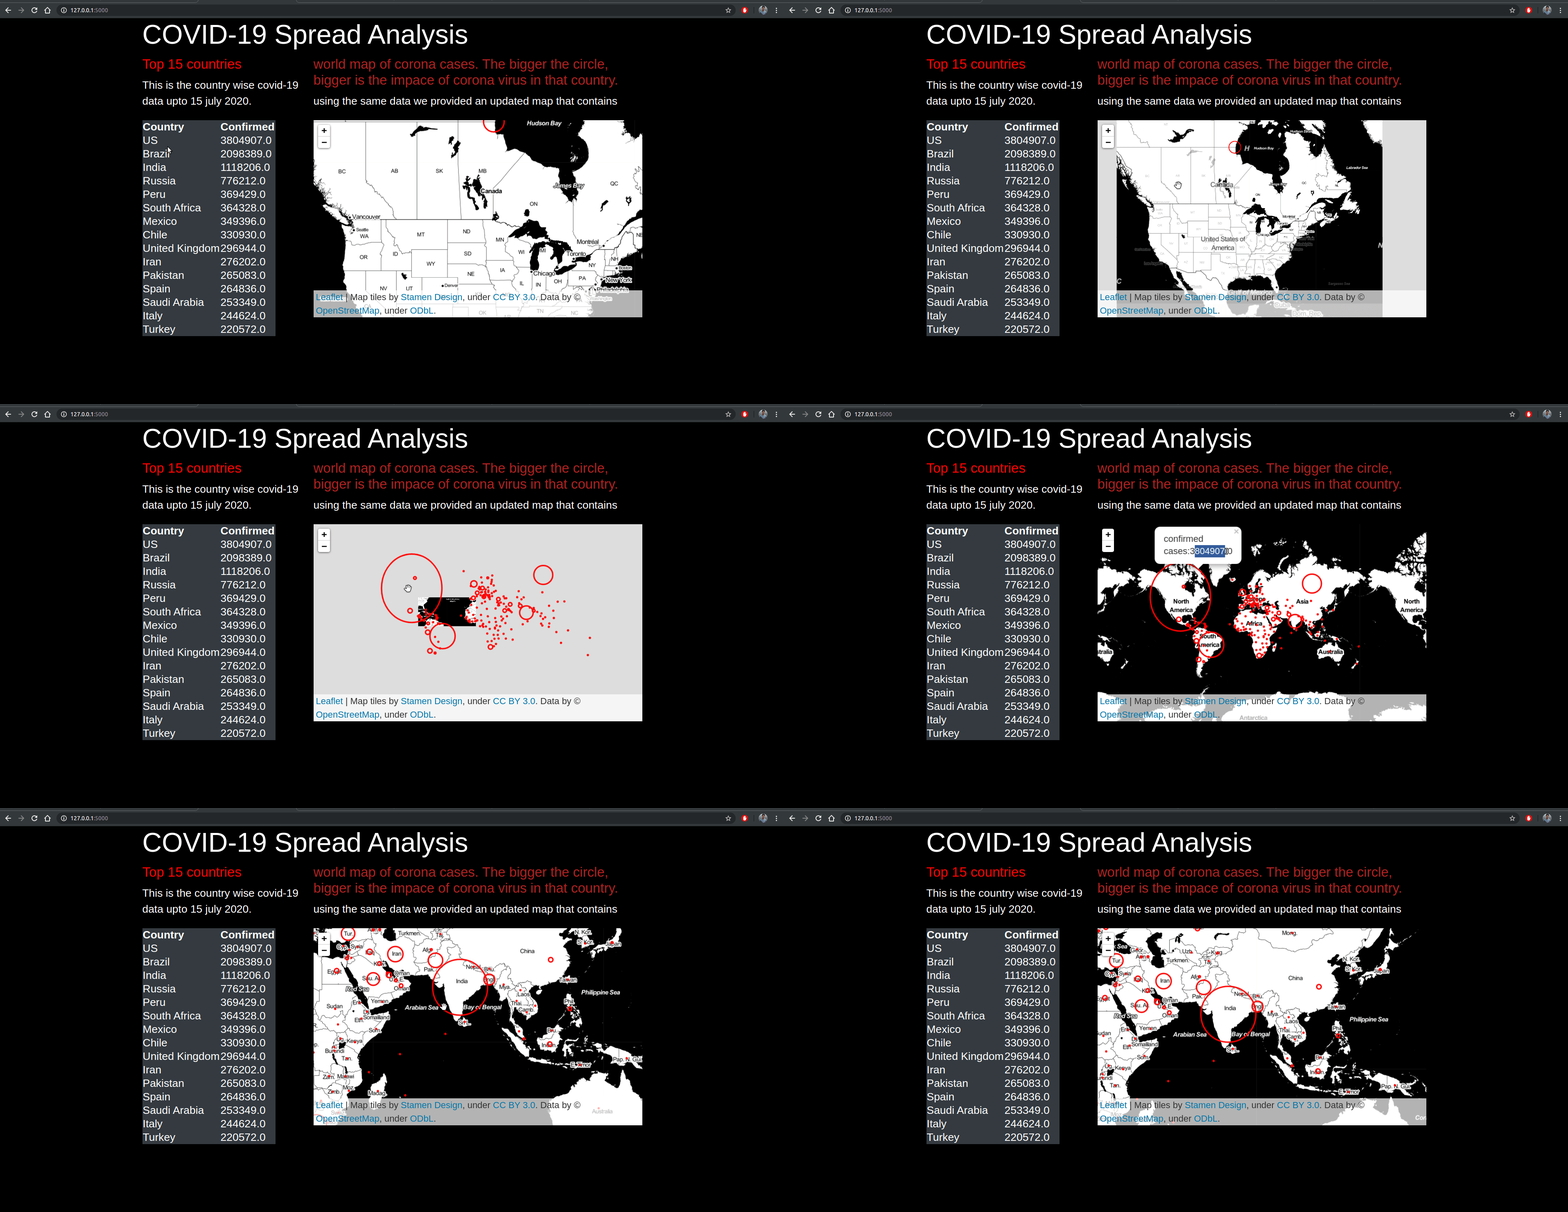
The dataset consists of corona spread data from different countries and different cities. This dataset also contains the latitude and longitude of corona affected areas. We will filter and visualize the countries and the cites within countries with maximum corona cases.
Please download all the datasets: Covid-19 DataSet
Let’s dive to project code
The directory tree for the project is as follows:
- app.py
- templates:
- home.html
- base.html
- static:
- style.css
Create a file app.py and add the following code:
1. Load the dataset and collect the top 15 regions having the largest corona cases:
import pandas as pd
corona_df = pd.read_csv('dataset.csv')
by_country = corona_df.groupby('Country_Region').sum()[['Confirmed', 'Deaths', 'Recovered', 'Active']]
cdf = by_country.nlargest(n, 'Confirmed')[['Confirmed']]
For ease, let’s make a function that will return the updated data frame, cdf.
def find_top_confirmed(n = 15):

  import pandas as pd
  corona_df = pd.read_csv('dataset.csv')
  by_country = corona_df.groupby('Country_Region').sum()[['Confirmed', 'Deaths', 'Recovered', 'Active']]
  cdf = by_country.nlargest(n, 'Confirmed')[['Confirmed']]
  return cdf
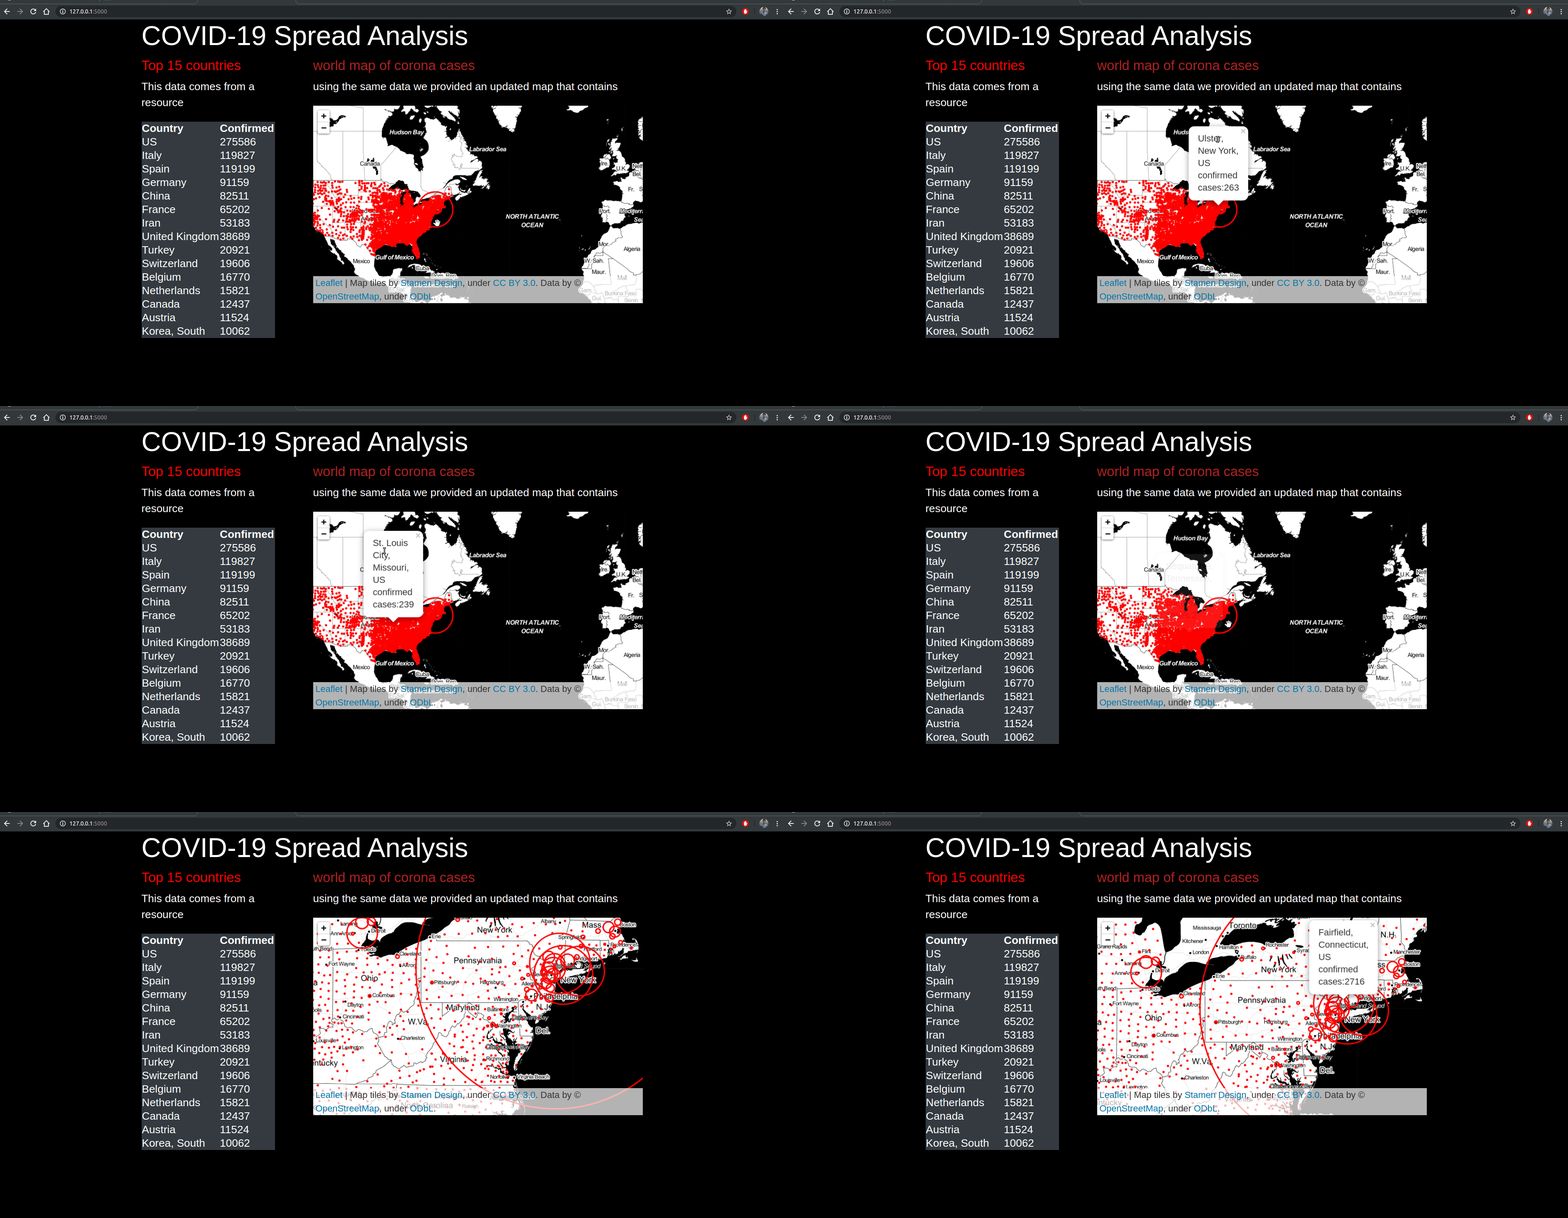
2. Make a sample map using the folium package and write a function to make circles on active corona cases regions:
import folium
import pandas as pd
corona_df = pd.read_csv('dataset.csv')

corona_df=corona_df.dropna()

m=folium.Map(location=[34.223334,-82.461707],
            tiles='Stamen toner',
            zoom_start=8)

def circle_maker(x):
    folium.Circle(location=[x[0],x[1]],
                 radius=float(x[2])*10,
                 color="red",
                 popup='{}\n confirmed cases:{}'.format(x[3],x[2])).add_to(m)
corona_df[['Lat','Long_','Confirmed','Combined_Key']].apply(lambda x:circle_maker(x),axis=1)

html_map=m._repr_html_()
3. Now do the required settings for flask app.
from flask import Flask,render_template

app=Flask(__name__)

@app.route('/')
def home():
    return render_template("home.html",table=cdf, cmap=html_map,pairs=pairs)

if __name__=="__main__":
    app.run(debug=True)
4. Now create two HTML pages inside templates folder: base.html and home.html and paste the below code in it.
base.html:
<head>
  <link
    rel="stylesheet"
    href="https://stackpath.bootstrapcdn.com/bootstrap/4.5.0/css/bootstrap.min.css"
    integrity="sha384-9aIt2nRpC12Uk9gS9baDl411NQApFmC26EwAOH8WgZl5MYYxFfc+NcPb1dKGj7Sk"
    crossorigin="anonymous"
  />

  <link
    rel="stylesheet"
    type="text/css"
    href="{{ url_for('static',filename='style.css')}}"
  />
</head>

{% block content %} {% endblock %}
home.html:
{% extends "base.html" %} {% block content %}


<div class="container">
    <h1>COVID-19 Spread Analysis</h1>
  <div class="row">

    <div class="col-4">
        <h5><font color="red">Top 15 countries</font></h5>
        <p>This data comes from a resource</p>
        <table class="table-responsive-sm table-dark">
        <thead>
            <tr>
            <th scope="col">Country</th>
            <th scope="col">Confirmed</tr>
                </tr>
        </thead>
        <tbody>
    {% for pair in pairs %}
    <tr>
    <td>{{ pair[0]}}</td>
    <td>{{ pair[1]}}</td>
    </tr>
    {% endfor %}
    </tbody>
    </table></div>
    <div class="col-8">
        <h5><font color="firebrick">world map of corona cases</font></h5>
        <p>using the same data we provided an updated map that contains</p>
        {{cmap|safe}}</div>

  </div>
</div>


{% endblock %}
5. Inside static folder make style.css file and paste the below code.
style.css:
body {
  background-color: black;
  color: white;
}

h1, td, tr {
    color: white;
}
Now run the flask app and visualize corona statistics using the dashboard. To run the flask app open the terminal and run the app.py file.
python3 app.py
Now, open the dashboard at localhost:5050
Project part-2
Let’s perform a similar analysis on new datasets. The steps are similar which we have discussed in the previous run
Download the dataset
Please download the second dataset: Covid-19 DataSet
Create the following files:
- app.py
- base.html, and home.html inside templates folder
- style.css inside static folder.
After creating all the files paste the below code inside respective files:
app.py:
def find_top_confirmed(n = 15):

    import pandas as pd
    corona_df=pd.read_csv("dataset2.csv")
    by_country = corona_df.groupby('Country').sum()[['Confirmed', 'Deaths', 'Recovered', 'Active']]
    cdf = by_country.nlargest(n, 'Confirmed')[['Confirmed']]
    return cdf

cdf=find_top_confirmed()
pairs=[(country,confirmed) for country,confirmed in zip(cdf.index,cdf['Confirmed'])]


import folium
import pandas as pd
corona_df = pd.read_csv("dataset2.csv")
corona_df=corona_df[['Lat','Long_','Confirmed']]
corona_df=corona_df.dropna()

m=folium.Map(location=[34.223334,-82.461707],
            tiles='Stamen toner',
            zoom_start=8)

def circle_maker(x):
    folium.Circle(location=[x[0],x[1]],
                 radius=float(x[2]),
                 color="red",
                 popup='confirmed cases:{}'.format(x[2])).add_to(m)
corona_df.apply(lambda x:circle_maker(x),axis=1)

html_map=m._repr_html_()
from flask import Flask,render_template

app=Flask(__name__)

@app.route('/')
def home():
    return render_template("home.html",table=cdf, cmap=html_map,pairs=pairs)

if __name__=="__main__":
    app.run(debug=True)
base.html:
<head>
  <link
    rel="stylesheet"
    href="https://stackpath.bootstrapcdn.com/bootstrap/4.5.0/css/bootstrap.min.css"
    integrity="sha384-9aIt2nRpC12Uk9gS9baDl411NQApFmC26EwAOH8WgZl5MYYxFfc+NcPb1dKGj7Sk"
    crossorigin="anonymous"
  />

  <link
    rel="stylesheet"
    type="text/css"
    href="{{ url_for('static',filename='style.css')}}"
  />
</head>

{% block content %} {% endblock %}
home.html:
{% extends "base.html" %} {% block content %}


<div class="container">
    <h1>COVID-19 Spread Analysis</h1>
  <div class="row">

    <div class="col-4">
        <h5><font color="red">Top 15 country</font></h5>
        <p>This is the countrywise covid-19 data upto 20 july 2020.</p>
        <table class="table-responsive-sm table-dark">
        <thead>
            <tr>
            <th scope="col">Country</th>
            <th scope="col">Confirmed</tr>
                </tr>
        </thead>
        <tbody>
    {% for pair in pairs %}
    <tr>
    <td>{{ pair[0]}}</td>
    <td>{{ pair[1]}}</td>
    </tr>
    {% endfor %}
    </tbody>
    </table></div>
    <div class="col-8">
        <h5><font color="firebrick">world map of corona cases. The bigger the circle, bigger is the impace of corona virus in that province state.</font></h5>
        <p>using the same data we provided an updated map that contains</p>
        {{cmap|safe}}</div>

  </div>
</div>


{% endblock %}
style.css:
body {
  background-color: black;
  color: white;
}

h1,
td,
tr {
  color: white;
}
Run the app.py file to run the flask app:
python3 app.py
Project part 3
Let’s perform a similar analysis on a different datasets. The steps are similar which we have discussed in the previous run
Download dataset3 and repeat the steps for this dataset: Covid-19 DataSet
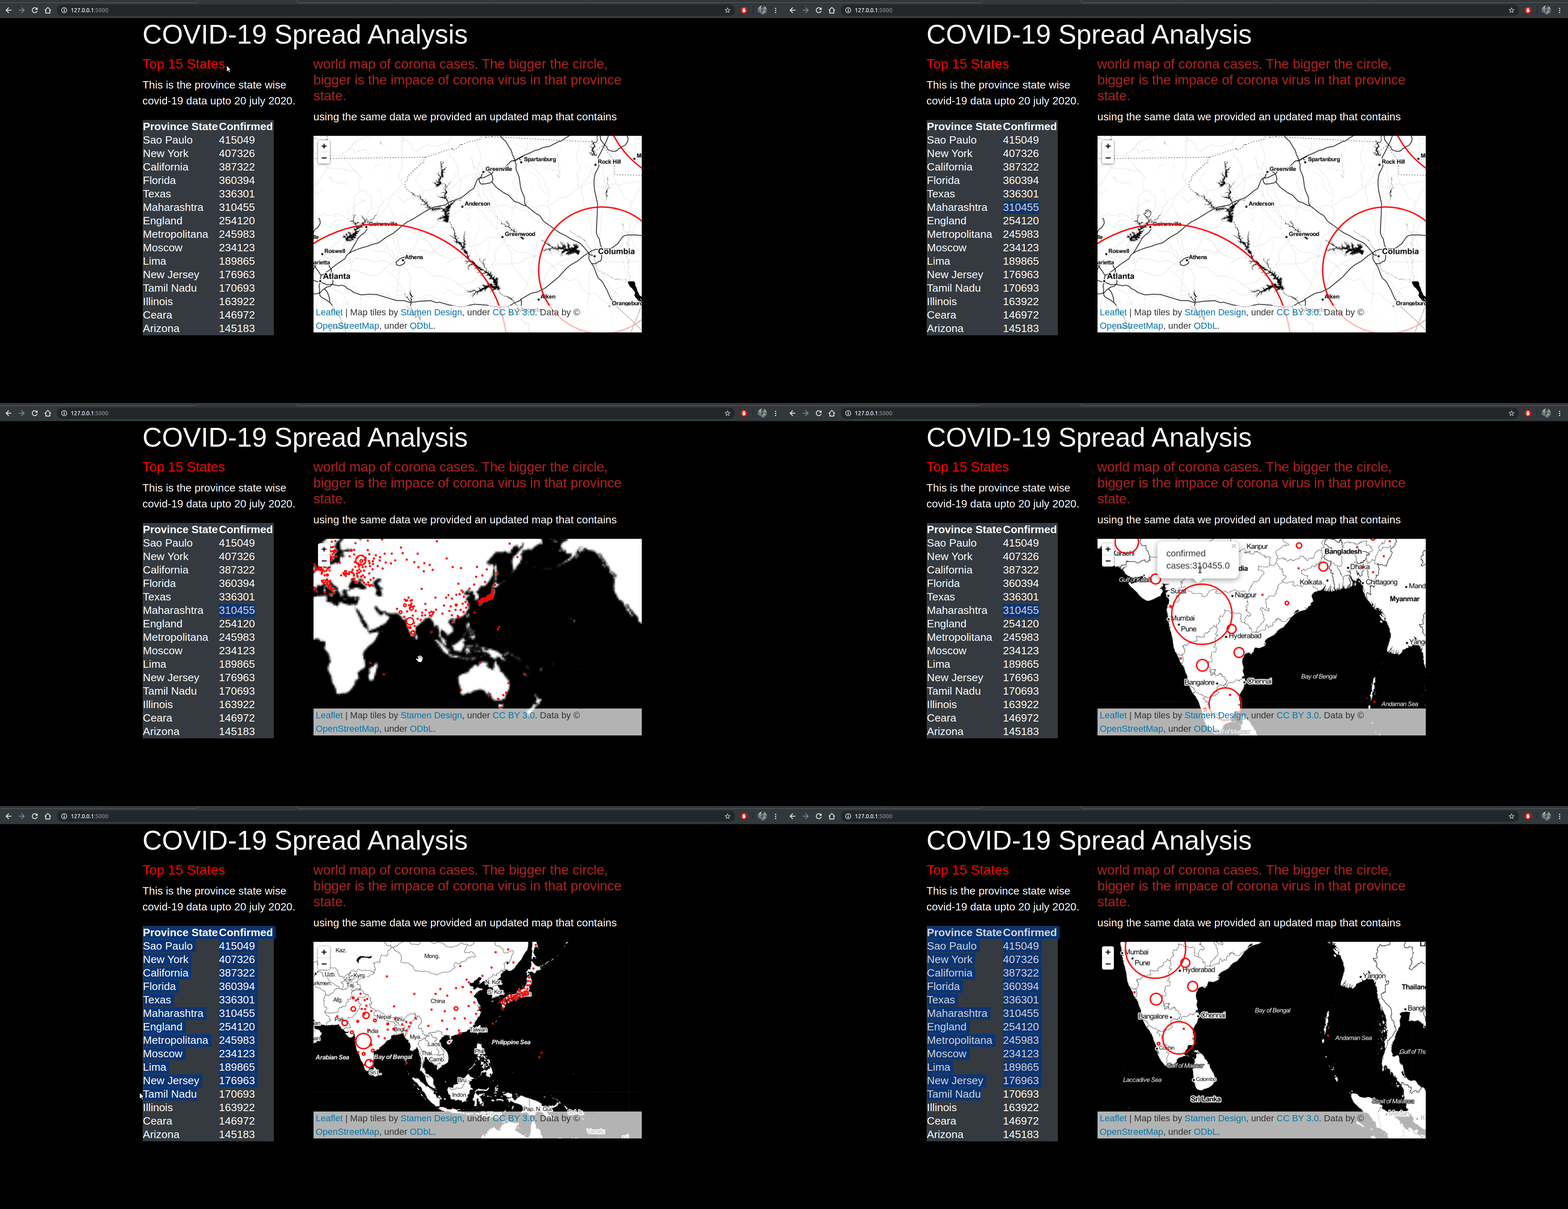
This dataset contains state-wise information of COVID 19 cases.
app.py:
def find_top_confirmed(n = 15):

  import pandas as pd

  corona_df=pd.read_csv("dataset3.csv")
  by_country = corona_df.groupby('Province_State').sum()[['Confirmed', 'Deaths', 'Recovered', 'Active']]
  cdf = by_country.nlargest(n, 'Confirmed')[['Confirmed']]
  return cdf


cdf=find_top_confirmed()
pairs=[(province_state,confirmed) for province_state,confirmed in zip(cdf.index,cdf['Confirmed'])]


import folium
import pandas as pd
corona_df = pd.read_csv("dataset3.csv")
corona_df=corona_df[['Lat','Long_','Confirmed']]
corona_df=corona_df.dropna()

m=folium.Map(location=[34.223334,-82.461707],
            tiles='Stamen toner',
            zoom_start=8)

def circle_maker(x):
    folium.Circle(location=[x[0],x[1]],
                 radius=float(x[2]),
                 color="red",
                 popup='confirmed cases:{}'.format(x[2])).add_to(m)
corona_df.apply(lambda x:circle_maker(x),axis=1)

html_map=m._repr_html_()
from flask import Flask,render_template

app=Flask(__name__)

@app.route('/')
def home():
    return render_template("home.html",table=cdf, cmap=html_map,pairs=pairs)

if __name__=="__main__":
    app.run(debug=True)
base.html:
<head>
  <link
    rel="stylesheet"
    href="https://stackpath.bootstrapcdn.com/bootstrap/4.5.0/css/bootstrap.min.css"
    integrity="sha384-9aIt2nRpC12Uk9gS9baDl411NQApFmC26EwAOH8WgZl5MYYxFfc+NcPb1dKGj7Sk"
    crossorigin="anonymous"
  />

  <link
    rel="stylesheet"
    type="text/css"
    href="{{ url_for('static',filename='style.css')}}"
  />
</head>

{% block content %} {% endblock %}
home.html:
{% extends "base.html" %} {% block content %}


<div class="container">
    <h1>COVID-19 Spread Analysis</h1>
  <div class="row">

    <div class="col-4">
        <h5><font color="red">Top 15 States</font></h5>
        <p>This is the province state wise covid-19 data upto 20 july 2020.</p>
        <table class="table-responsive-sm table-dark">
        <thead>
            <tr>
            <th scope="col">Province State</th>
            <th scope="col">Confirmed</tr>
                </tr>
        </thead>
        <tbody>
    {% for pair in pairs %}
    <tr>
    <td>{{ pair[0]}}</td>
    <td>{{ pair[1]}}</td>
    </tr>
    {% endfor %}
    </tbody>
    </table></div>
    <div class="col-8">
        <h5><font color="firebrick">world map of corona cases. The bigger the circle, bigger is the impace of corona virus in that province state.</font></h5>
        <p>using the same data we provided an updated map that contains</p>
        {{cmap|safe}}</div>

  </div>
</div>


{% endblock %}
style.css:
body {
  background-color: black;
  color: white;
}

h1,
td,
tr {
  color: white;
}
Again run the app.py file and open the dashboard at localhost:5050
Summary
In this COVID-19 spread analysis project, we have seen how to build a dashboard using flask and python folium. In this dashboard, we are visualizing the region-wise effect of coronavirus. The table in the left panel shows the total active cases till date in the respective region. In the right panel, we have integrated a world map and represent the impact of the virus using a red circle. More the number of cases in the region on the map, the bigger is the red circle in that region. To integrate world map and red circles we make use of the python folium library.
Did you like this article? If Yes, please give DataFlair 5 Stars on Google


it not working , iam getting some error “file not found error =dataset.csc”
the dataset shousld be a .csv not csc
Download all datasets from the link provided and make sure you paste all of them in the same folder.
BTW, it should be .csv
How to open the link automatically in the browser without copying the link and pasting in the browser.
By the way , project is working fine.
how do we update the dataset?
You can add more dataset in the directory and refresh the page
Thanks rahul for helping the community, keep learning and happy coding.
thanks for reply, i have made the files but i’m not able to run the program, can you please tell me what files to be created and which file to run.
I wanna need slides on this topics because I ll do it as my project
Flask is showing ‘lazy loading’, and if i direct run through flask run, it shows cdf not defined.
Lazy loading is beacause of a syntax error. Make sure you have this line in your code: cdf = by_country.nlargest(n, ‘Confirmed’)[[‘Confirmed’]]
I am getting error in the flask part(that pairs is getting it shows create parameter or import pairs)
Make sure you have defined pairs before using the same. Please download the source code from the link provided.
How to run the project with different 3 parts??? Can you drop a vdo or slides that how to deal with the 3 parts ??
All three parts use different datasets, just download the dataset of the three parts and run the provided code.
I’m getting this error
File “/Users/ps/Industrial-Project/app.py”, line 33, in home
return render_template(“home.html”,table=cdf, cmap=html_map,pairs=pairs)
NameError: name ‘pairs’ is not defined.
How can I correct this?
Pairs are defined in apps.py so make sure you have this line’pairs=[(country,confirmed) for country,confirmed in zip(cdf.index,cdf[‘Confirmed’])]’ in apps.py
please tell me how to download and directly run on vscode
What’s the front-end and back-end in this
Front-end uses HTML and CSS files (home.html, base.html, and style.css) and apps.py is for backend
too many typos and missing lines!
very frustration to try to ‘Learn” from
i can’t get a red circle on confirmed placed there is only map is visible .please let me what is the error in this
The circles are drawn using the Circle method of folium library. Try reinstalling the library.
i got error
cdf = by_country.nlargest(n,’Confirmed’)[[‘Confirmed’]]
NameError: name ‘n’ is not defined
n is an argument of ‘find_top_confirmed’ method so make sure your function defination matches with this ‘def find_top_confirmed(n = 15):’
which idle to use for this project?
Tried it , its opening but the circles are not showing
The circles are drawn using Circle method of folium library. Try reinstalling the library.
Bumped into this looking for folium map integration which is actually embedded in the bootstrap .css it appears but, even as a beginner coder I can pick-up several areas this project is incomplete and not ‘copy-paste’. T address some of the above comments:
– It seems the datasets have been updated and the names changed from simply ‘dataset’, you have to copy-in whatever filename you are referring to.
– the 2 bits of code in step 1 are basically the same with the second as a separate function, you should only use 1 but: if you use the first note that the ‘n’ has not been defined (it is in the 2nd), you either need to define n first (n=15) or simply replace n by 15. If you use the function note the function is not called in any of the following code and hence the cdf not defined error
– pairs is not defined anywhere and not sure what it is supposed to contain but you can get the code running by just removing this.
Anyway, all seems a bit sloppy
What were the problems encountered during the development
may i help you !!!!
for solutions fro every type of error occuring in above projects:
for project 1:
*declare n=15 or put 15 in place of “n”
*for “pairs error” use this line of code before reading dataset file :
code:
” cdf=find_top_confirmed() pairs=[(country,confirmed) for country,confirmed in zip(cdf.index,cdf[‘Confirmed’])] ”
*enjoy ur lockdown all 🙂
Can u plz provide the video on how to run this whole project
can anyone please provide a entire code..as im bit confused..
i tried to upload these datasets into weka. it shows some errors
Is it compulsory to take all three parts?
Can we take 1 part of this and only one data set that you given??
In which software this project will run?
Can anyone tell me??
How did you point out which port in localhost should be opened? I don’t see that in the code! I can’t open it in the port mentioned above!
On this part of project 2
def circle_maker(x):
folium.Circle(location=[x[0], x[1]], radius=float(x[2]),
color=”red”,
popup=’confirmed cases:{}’.format(x[2])).add_to(m)
corona_df.apply(lambda x: circle_maker(x), axis=1)
I am getting this error on the location part
Expected type ‘tuple[float, float]’, got ‘list’ instead