Handwritten Character Recognition with Neural Network
Machine Learning courses with 100+ Real-time projects Start Now!!
In this machine learning project, we will recognize handwritten characters, i.e, English alphabets from A-Z. This we are going to achieve by modeling a neural network that will have to be trained over a dataset containing images of alphabets.
Project Prerequisites
Below are the prerequisites for this project:
- Python (3.7.4 used)
- IDE (Jupyter used)
Required frameworks are
- Numpy (version 1.16.5)
- cv2 (openCV) (version 3.4.2)
- Keras (version 2.3.1)
- Tensorflow (Keras uses TensorFlow in backend and for some image preprocessing) (version 2.0.0)
- Matplotlib (version 3.1.1)
- Pandas (version 0.25.1)
Download Dataset
The dataset for this project contains 372450 images of alphabets of 28×2, all present in the form of a CSV file:
Handwritten character recognition dataset
Steps to develop handwritten character recognition
Download Project Code
Please download project source code: Handwritten Character Recognition with Neural Network
import matplotlib.pyplot as plt
import cv2
import numpy as np
from keras.models import Sequential
from keras.layers import Dense, Flatten, Conv2D, MaxPool2D, Dropout
from keras.optimizers import SGD, Adam
from keras.callbacks import ReduceLROnPlateau, EarlyStopping
from keras.utils import to_categorical
import pandas as pd
import numpy as np
from sklearn.model_selection import train_test_split
from sklearn.utils import shuffle
- First of all, we do all the necessary imports as stated above. We will see the use of all the imports as we use them.
Read the data:
data = pd.read_csv(r"D:\a-z alphabets\A_Z Handwritten Data.csv").astype('float32')

print(data.head(10))
- Now we are reading the dataset using the pd.read_csv() and printing the first 10 images using data.head(10)
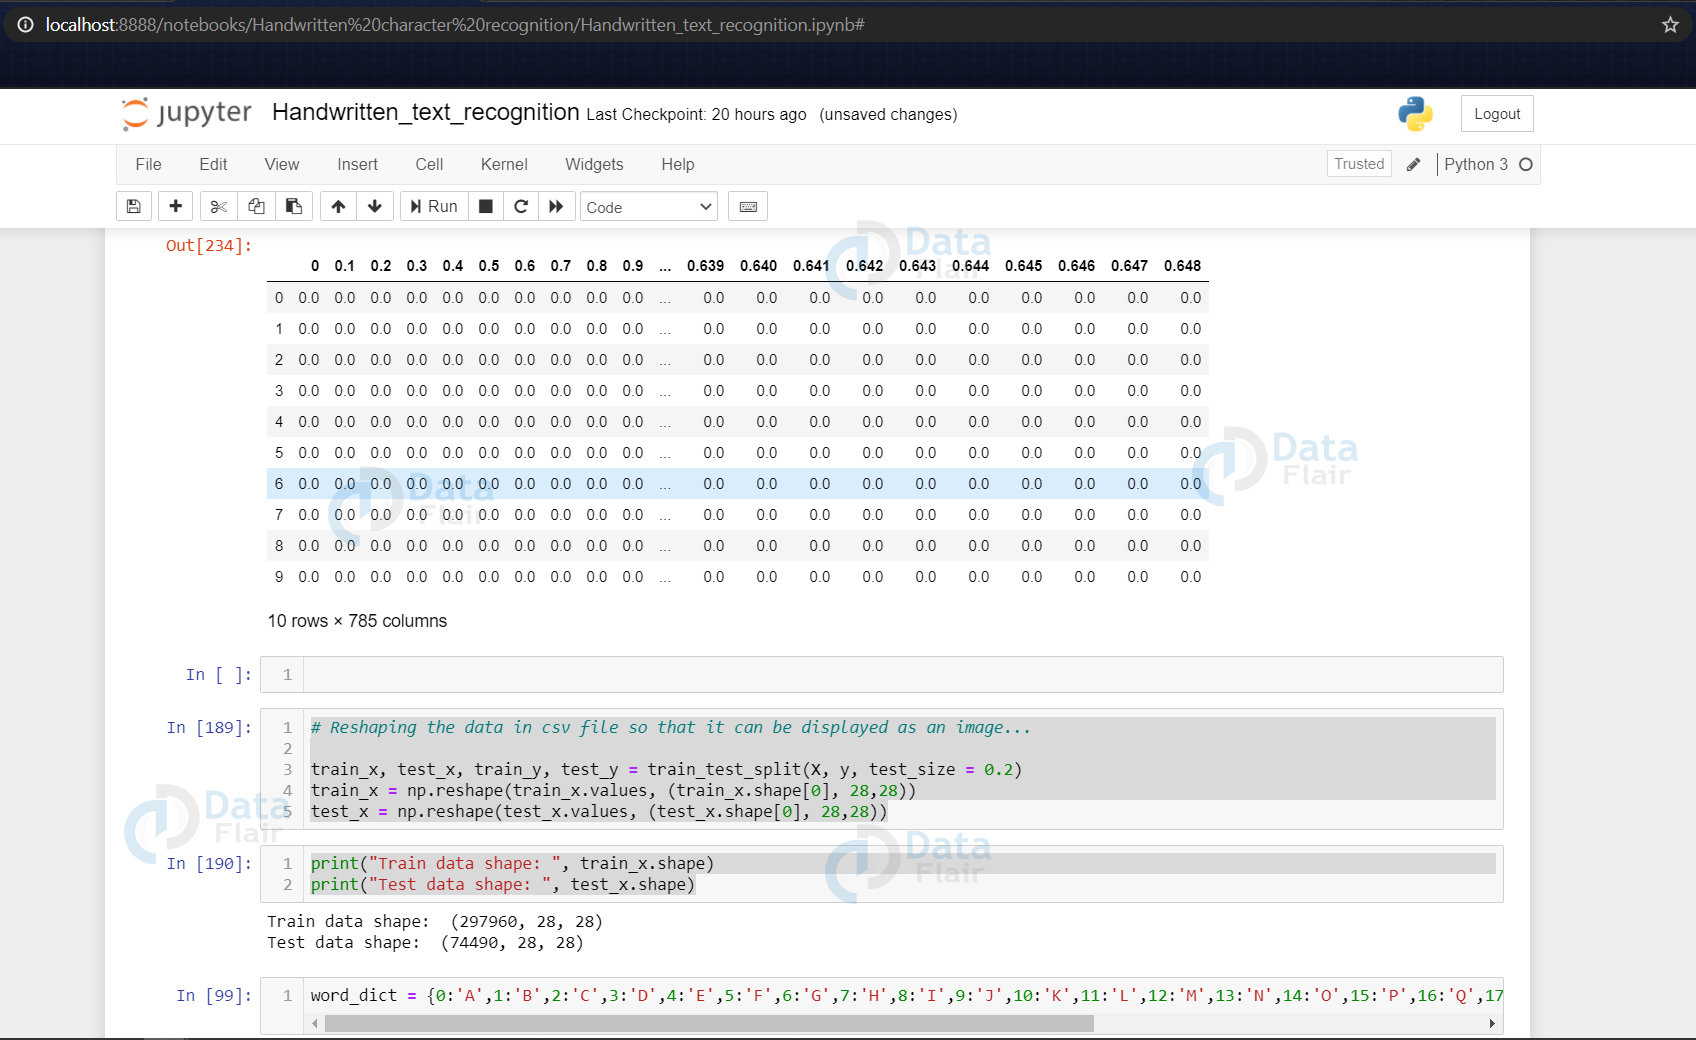
(The above image shows some of the rows of the dataframe data using the head() function of dataframe)
Split data into images and their labels:
X = data.drop('0',axis = 1)
y = data['0']
Splitting the data read into the images & their corresponding labels. The ‘0’ contains the labels, & so we drop the ‘0’ column from the data dataframe read & use it in the y to form the labels.
Reshaping the data in the csv file so that it can be displayed as an image
train_x, test_x, train_y, test_y = train_test_split(X, y, test_size = 0.2)

train_x = np.reshape(train_x.values, (train_x.shape[0], 28,28))
test_x = np.reshape(test_x.values, (test_x.shape[0], 28,28))

print("Train data shape: ", train_x.shape)
print("Test data shape: ", test_x.shape)
- In the above segment, we are splitting the data into training & testing dataset using train_test_split().
- Also, we are reshaping the train & test image data so that they can be displayed as an image, as initially in the CSV file they were present as 784 columns of pixel data. So we convert it to 28×28 pixels.
word_dict = {0:'A',1:'B',2:'C',3:'D',4:'E',5:'F',6:'G',7:'H',8:'I',9:'J',10:'K',11:'L',12:'M',13:'N',14:'O',15:'P',16:'Q',17:'R',18:'S',19:'T',20:'U',21:'V',22:'W',23:'X', 24:'Y',25:'Z'}
- All the labels are present in the form of floating point values, that we convert to integer values, & so we create a dictionary word_dict to map the integer values with the characters.
Plotting the number of alphabets in the dataset
y_int = np.int0(y)
count = np.zeros(26, dtype='int')
for i in y_int:
    count[i] +=1

alphabets = []
for i in word_dict.values():
    alphabets.append(i)

fig, ax = plt.subplots(1,1, figsize=(10,10))
ax.barh(alphabets, count)

plt.xlabel("Number of elements ")
plt.ylabel("Alphabets")
plt.grid()
plt.show()
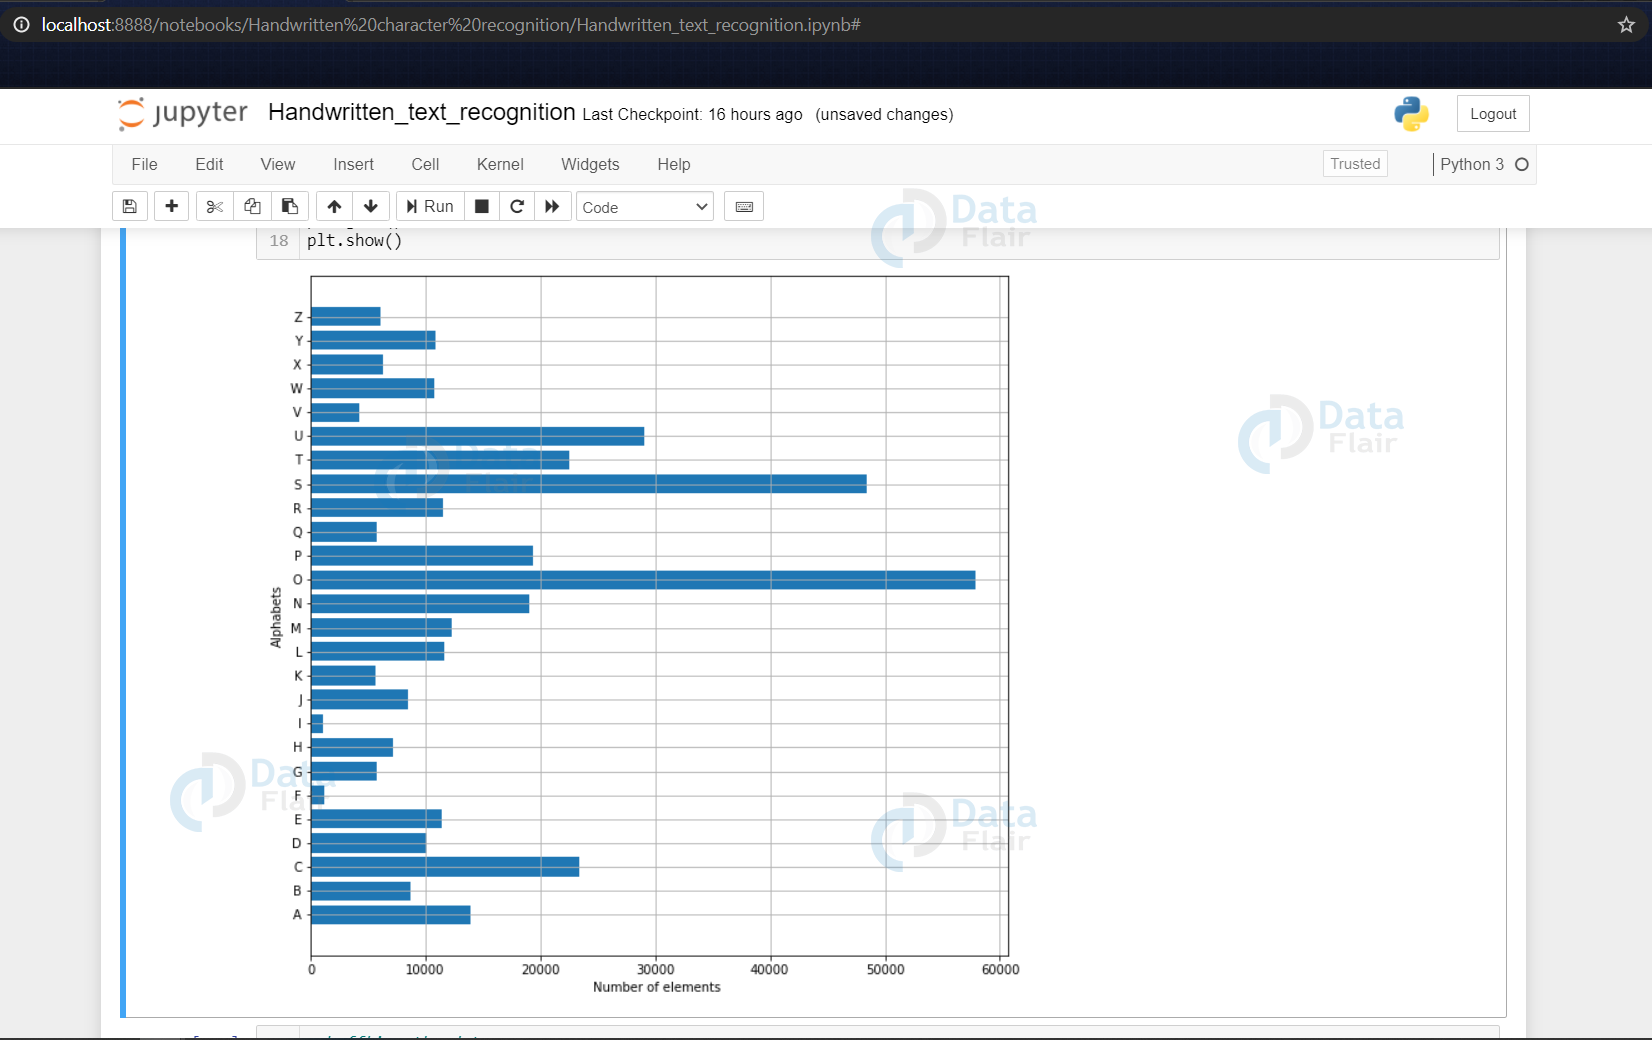
- Here we are only describing the distribution of the alphabets.
- Firstly we convert the labels into integer values and append into the count list according to the label. This count list has the number of images present in the dataset belonging to each alphabet.
- Now we create a list – alphabets containing all the characters using the values() function of the dictionary.
- Now using the count & alphabets lists we draw the horizontal bar plot.
Shuffling the data
shuff = shuffle(train_x[:100])

fig, ax = plt.subplots(3,3, figsize = (10,10))
axes = ax.flatten()

for i in range(9):
    _, shu = cv2.threshold(shuff[i], 30, 200, cv2.THRESH_BINARY)
    axes[i].imshow(np.reshape(shuff[i], (28,28)), cmap="Greys")
plt.show()
- Now we shuffle some of the images of the train set.
- The shuffling is done using the shuffle() function so that we can display some random images.
- We then create 9 plots in 3×3 shape & display the thresholded images of 9 alphabets.
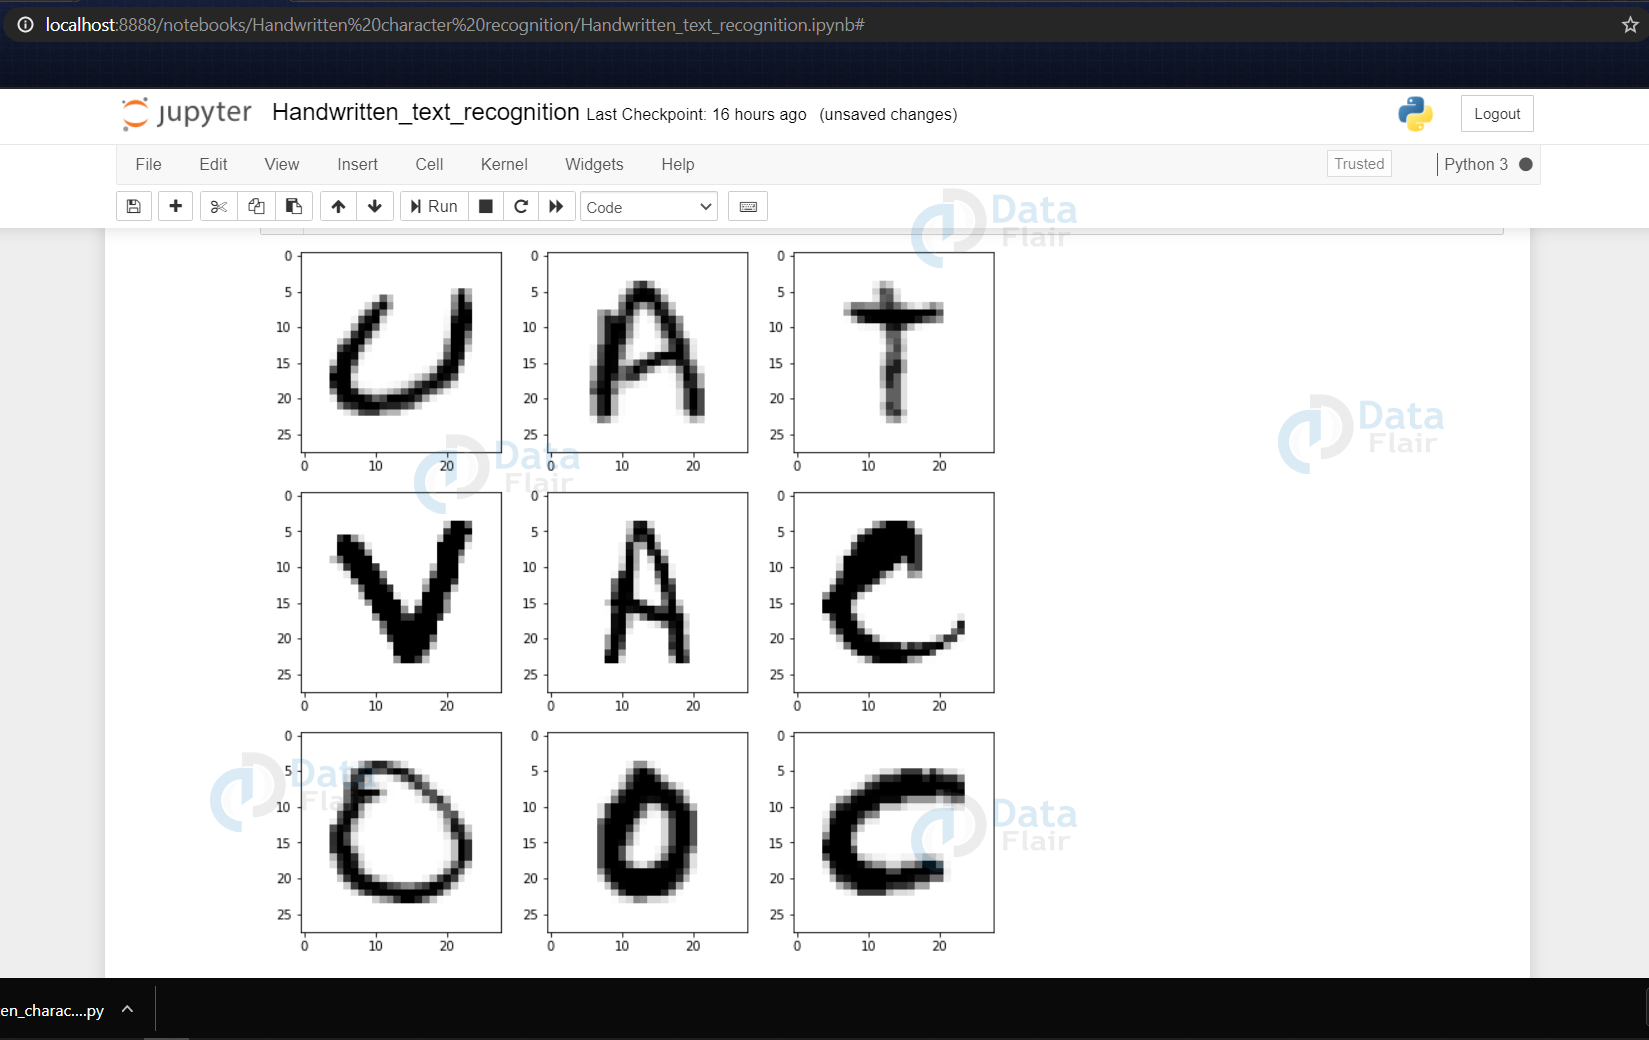
(The above image depicts the grayscale images that we got from the dataset)
Data Reshaping
Reshaping the training & test dataset so that it can be put in the model
train_X = train_x.reshape(train_x.shape[0],train_x.shape[1],train_x.shape[2],1)
print("New shape of train data: ", train_X.shape)

test_X = test_x.reshape(test_x.shape[0], test_x.shape[1], test_x.shape[2],1)
print("New shape of train data: ", test_X.shape)


Now we reshape the train & test image dataset so that they can be put in the model.

New shape of train data:  (297960, 28, 28, 1)
New shape of train data:  (74490, 28, 28, 1)
Now we reshape the train & test image dataset so that they can be put in the model.
New shape of train data: (297960, 28, 28, 1)
New shape of train data: (74490, 28, 28, 1)
train_yOHE = to_categorical(train_y, num_classes = 26, dtype='int')
print("New shape of train labels: ", train_yOHE.shape)

test_yOHE = to_categorical(test_y, num_classes = 26, dtype='int')
print("New shape of test labels: ", test_yOHE.shape)
Here we convert the single float values to categorical values. This is done as the CNN model takes input of labels & generates the output as a vector of probabilities.
Now we define the CNN.
What is CNN?
CNN stands for Convolutional Neural Networks that are used to extract the features of the images using several layers of filters.
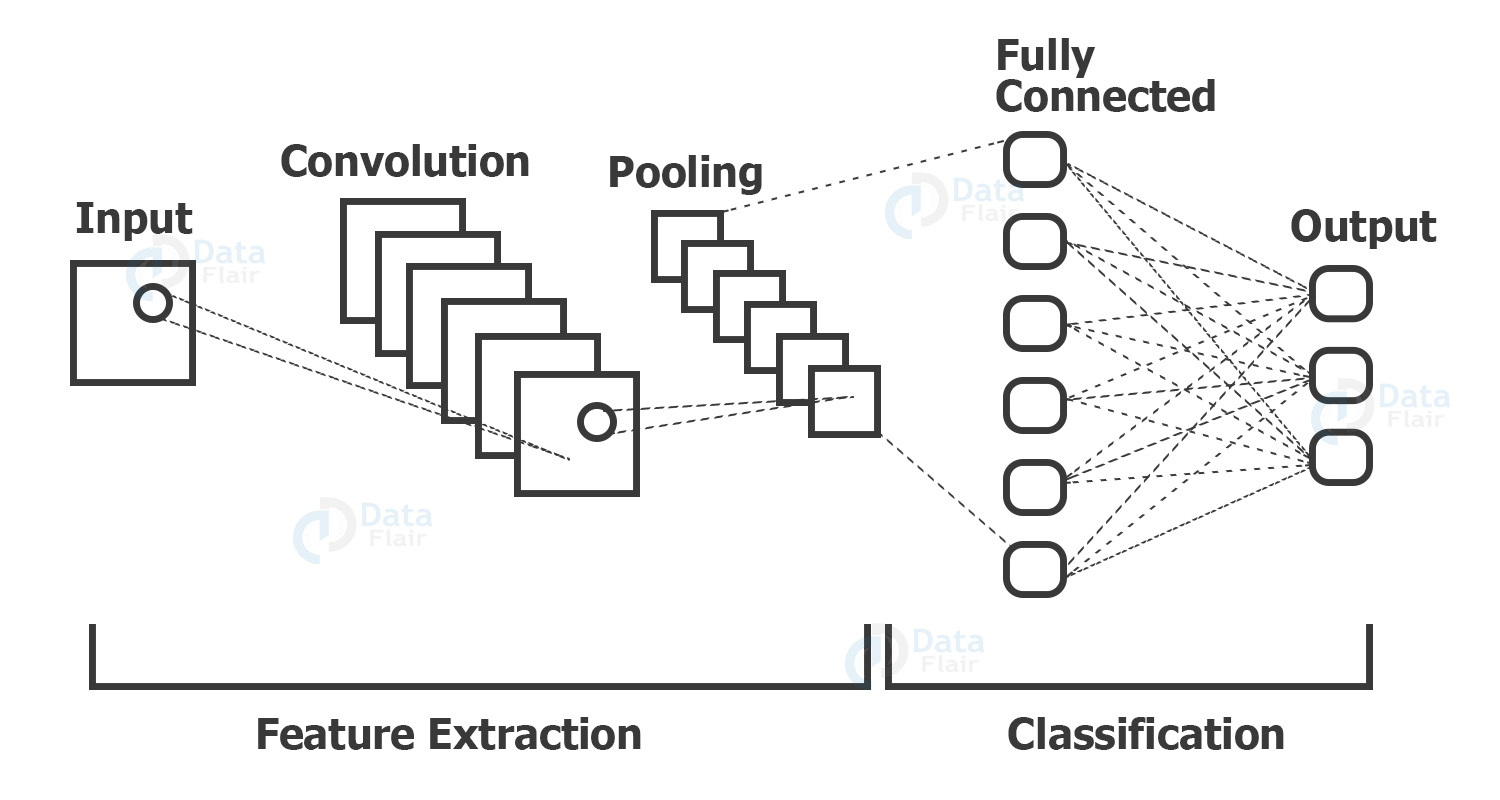
(Example of how a CNN looks logically)
The convolution layers are generally followed by maxpool layers that are used to reduce the number of features extracted and ultimately the output of the maxpool and layers and convolution layers are flattened into a vector of single dimension and are given as an input to the Dense layer (The fully connected network).
The model created is as follows:
model = Sequential()

model.add(Conv2D(filters=32, kernel_size=(3, 3), activation='relu', input_shape=(28,28,1)))
model.add(MaxPool2D(pool_size=(2, 2), strides=2))

model.add(Conv2D(filters=64, kernel_size=(3, 3), activation='relu', padding = 'same'))
model.add(MaxPool2D(pool_size=(2, 2), strides=2))

model.add(Conv2D(filters=128, kernel_size=(3, 3), activation='relu', padding = 'valid'))
model.add(MaxPool2D(pool_size=(2, 2), strides=2))

model.add(Flatten())

model.add(Dense(64,activation ="relu"))
model.add(Dense(128,activation ="relu"))

model.add(Dense(26,activation ="softmax"))
Above we have the CNN model that we designed for training the model over the training dataset.
Compiling & Fitting Model
model.compile(optimizer = Adam(learning_rate=0.001), loss='categorical_crossentropy', metrics=['accuracy'])

history = model.fit(train_X, train_yOHE, epochs=1,  validation_data = (test_X,test_yOHE))
- Here we are compiling the model, where we define the optimizing function & the loss function to be used for fitting.
- The optimizing function used is Adam, that is a combination of RMSprop & Adagram optimizing algorithms.
- The dataset is very large so we are training for only a single epoch, however, as required we can even train it for multiple epochs (which is recommended for character recognition for better accuracy).
model.summary()
model.save(r'model_hand.h5')
Now we are getting the model summary that tells us what were the different layers defined in the model & also we save the model using model.save() function.
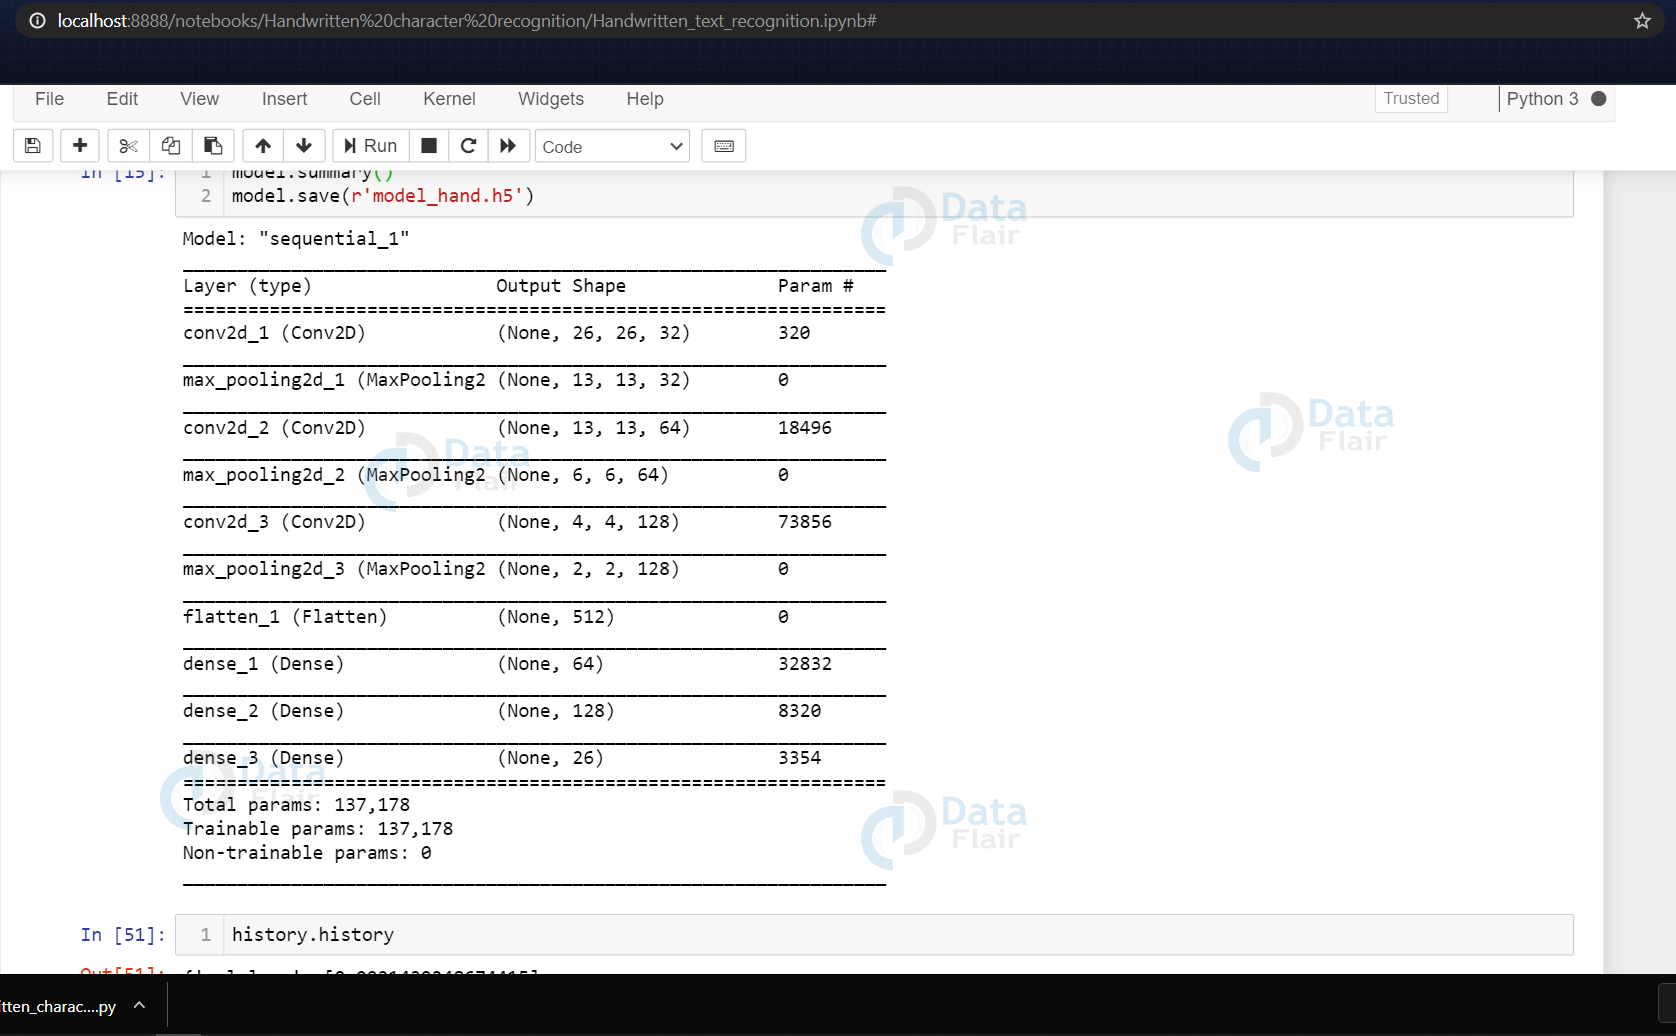
(Summary of the defined model)
Getting the Train & Validation Accuracies & Losses
print("The validation accuracy is :", history.history['val_accuracy'])
print("The training accuracy is :", history.history['accuracy'])
print("The validation loss is :", history.history['val_loss'])
print("The training loss is :", history.history['loss'])
In the above code segment, we print out the training & validation accuracies along with the training & validation losses for character recognition.
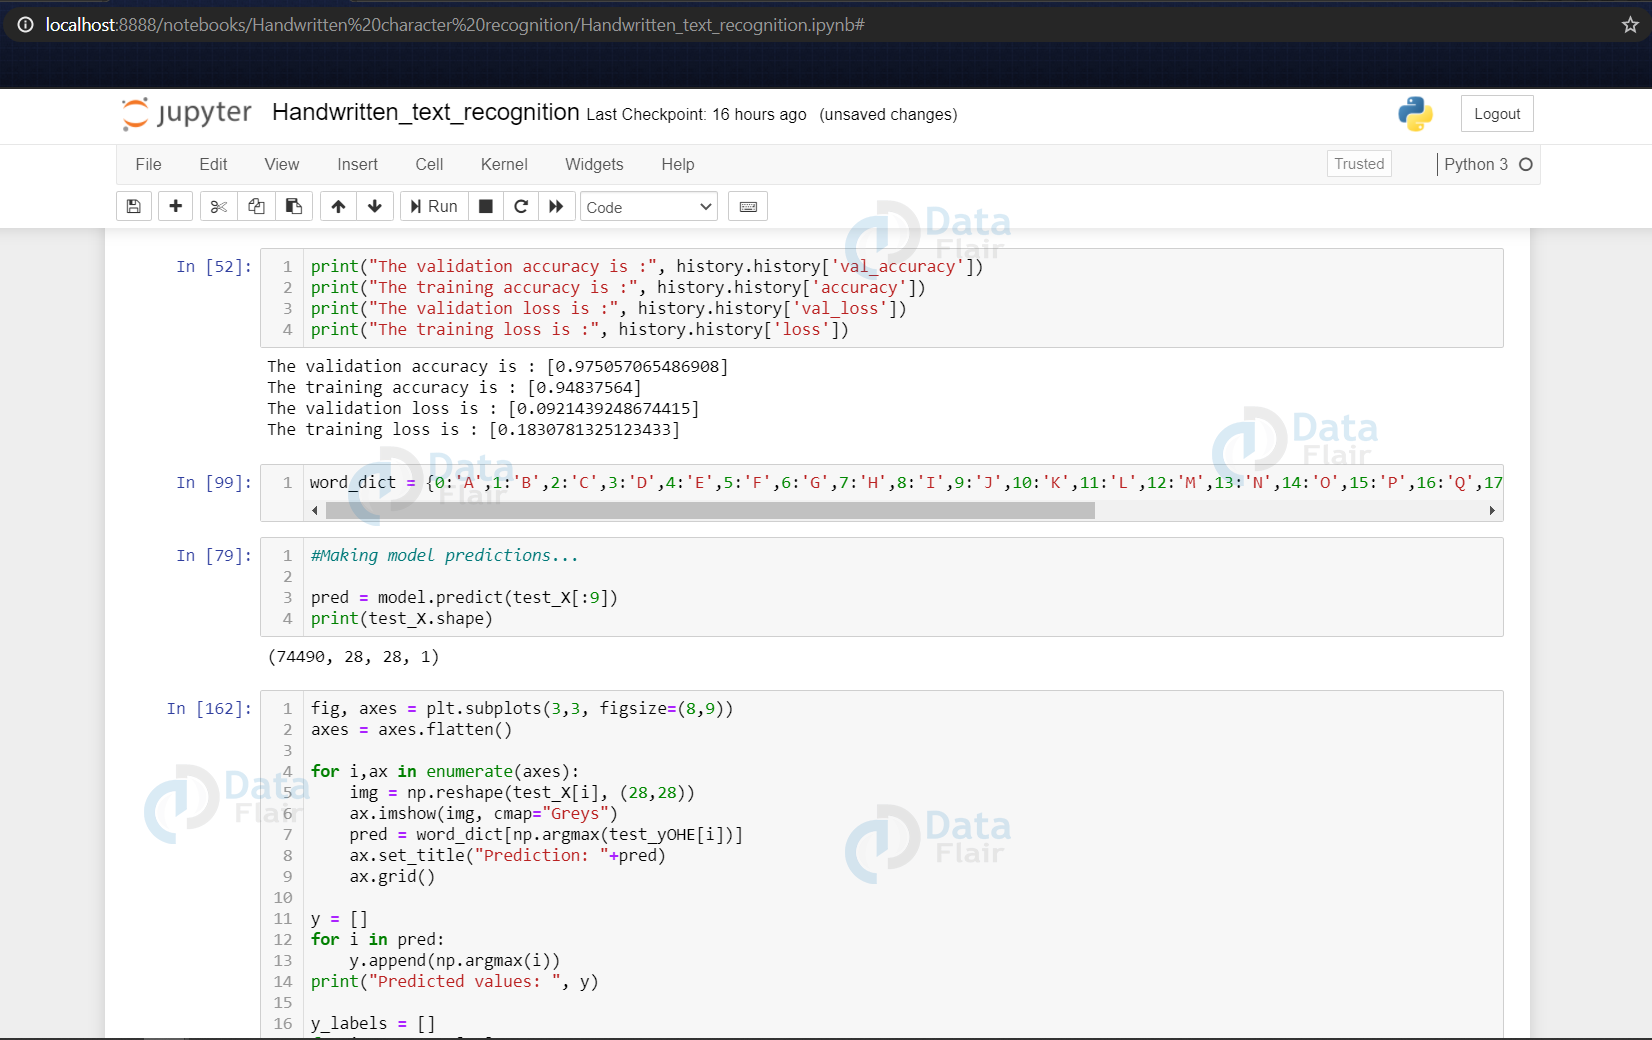
Doing Some Predictions on Test Data
fig, axes = plt.subplots(3,3, figsize=(8,9))
axes = axes.flatten()

for i,ax in enumerate(axes):
    img = np.reshape(test_X[i], (28,28))
    ax.imshow(img, cmap="Greys")

    pred = word_dict[np.argmax(test_yOHE[i])]
    ax.set_title("Prediction: "+pred)
    ax.grid()
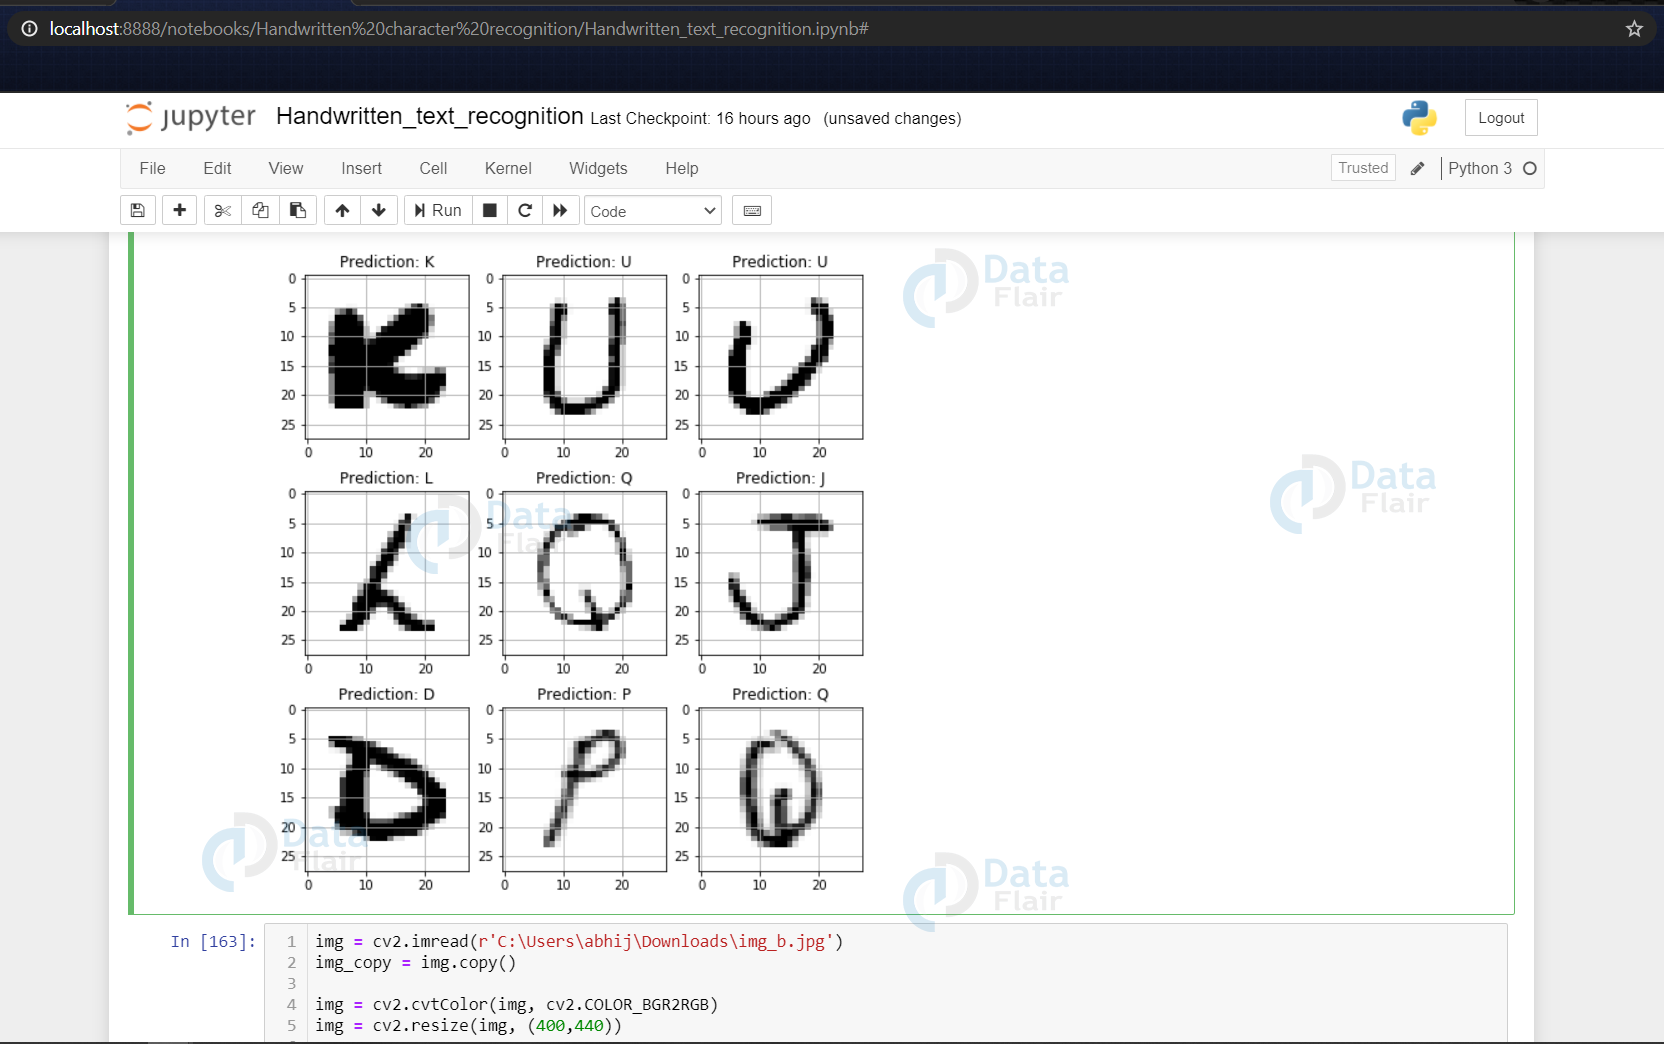
- Here we are creating 9 subplots of (3,3) shape & visualize some of the test dataset alphabets along with their predictions, that are made using the model.predict() function for text recognition.
Doing Prediction on External Image
img = cv2.imread(r'C:\Users\abhij\Downloads\img_b.jpg')
img_copy = img.copy()

img = cv2.cvtColor(img, cv2.COLOR_BGR2RGB)
img = cv2.resize(img, (400,440))
- Here we have read an external image that is originally an image of alphabet ‘B’ and made a copy of it that is to go through some processing to be fed to the model for the prediction that we will see in a while.
- The img read is then converted from BGR representation (as OpenCV reads the image in BGR format) to RGB for displaying the image, & is resized to our required dimensions that we want to display the image in.
img_copy = cv2.GaussianBlur(img_copy, (7,7), 0)
img_gray = cv2.cvtColor(img_copy, cv2.COLOR_BGR2GRAY)
_, img_thresh = cv2.threshold(img_gray, 100, 255, cv2.THRESH_BINARY_INV)

img_final = cv2.resize(img_thresh, (28,28))
img_final =np.reshape(img_final, (1,28,28,1))
- Now we do some processing on the copied image (img_copy).
- We convert the image from BGR to grayscale and apply thresholding to it. We don’t need to apply a threshold we could use the grayscale to predict, but we do it to keep the image smooth without any sort of hazy gray colors in the image that could lead to wrong predictions.
- The image is to be then resized using cv2.resize() function into the dimensions that the model takes as input, along with reshaping the image using np.reshape() so that it can be used as model input.
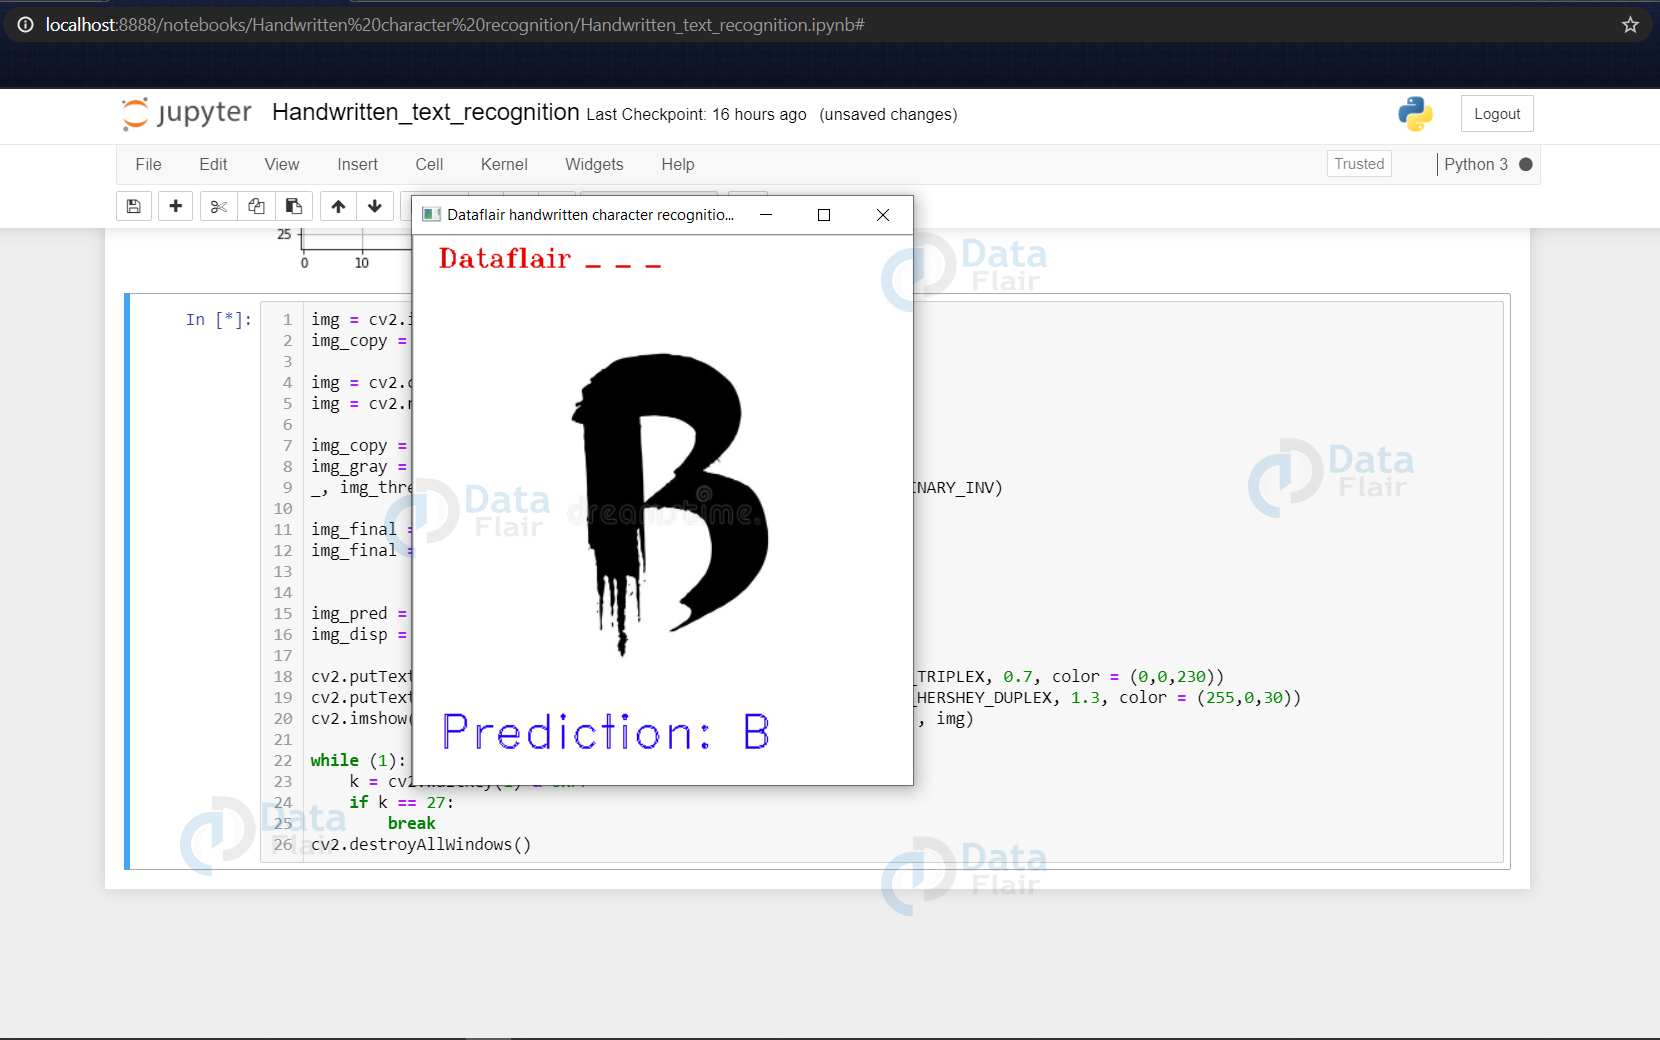
img_pred = word_dict[np.argmax(model.predict(img_final))]

cv2.putText(img, "Dataflair _ _ _ ", (20,25), cv2.FONT_HERSHEY_TRIPLEX, 0.7, color = (0,0,230))
cv2.putText(img, "Prediction: " + img_pred, (20,410), cv2.FONT_HERSHEY_DUPLEX, 1.3, color = (255,0,30))
cv2.imshow('Dataflair handwritten character recognition _ _ _ ', img)
- Now we make a prediction using the processed image & use the np.argmax() function to get the index of the class with the highest predicted probability. Using this we get to know the exact character through the word_dict dictionary.
- This predicted character is then displayed on the frame.
while (1):
    k = cv2.waitKey(1) & 0xFF
    if k == 27:
        break
cv2.destroyAllWindows()
- Here we are setting up a waitKey in a while loop that will be stuck in loop until Esc is pressed, & when it gets out of loop using cv2.destroyAllWindows() we destroy any active windows created to stop displaying the frame.
Conclusion
Handwritten character recognition is a classic machine learning project that teaches how to handle image data and build powerful models. The goal is to train a machine to read letters or numbers written by hand. One of the most famous datasets for this is MNIST, which has thousands of images of handwritten digits from 0 to 9. It’s perfect for beginners to learn about classification problems using neural networks.
We have successfully developed Handwritten character recognition (Text Recognition) with Python, Tensorflow, and Machine Learning libraries.
Handwritten characters have been recognized with more than 97% test accuracy. This can be also further extended to identifying the handwritten characters of other languages too.
You give me 15 seconds I promise you best tutorials
Please share your happy experience on Google


can this be used to convert handwritten sentences to text sentences of the same…
How do we know amount of labels from dataset?
e.g
Count of ‘O’ = 12***
Count of ‘A’ = 232*
did you get the solution for the labelling problem???? I have same confusion
they label them using “sort by name”
We are getting a error on that error in optimizer (Learning_rate) for passing keyword.Can you please help us what should we do line number 68
Typeerror: Passed to optimizer: ‘+Str(k))
model.compile( loss=’categorical_crossentropy’, metrics=[‘accuracy’],optimizer=’adam’)
you can use that code.its work for me
can you please share the dataset because i can’t download
data = pd.read_csv(r”D:\a-z alphabets\A_Z Handwritten Data.csv”).astype(‘float32’)
print(data.head(10))
i am getting error please solve this reply through email
data = pd.read_csv(“dataset path Location /filename.csv”
Note::
You need to differentiate path Location use forward-slash (/)
It is not giving me accurate output
Give the path where you have download the csv dataset
Respected sir,
I have read and try to implement your handwritten-character-recognition-neural-network in my project i.e. implementation for Gujarati Language.
I got a very helpful article for me.
I need some help to design CVS file. i have an confusion how to get the value for X = data.drop(‘0’,axis = 1) y = data[‘0’].
It is not working in my CSV. I have prepared CSV file of 30 X 30 pixel images of 60 individuals.
It is a kind help needed from your side.
Thanks.
how to recognize multiple characters from a single image?
prediction is not working for me.
When I give B it predicts Y
it is working with training and testing data.
But when I give a letter written in mspaint.
it is not able to predict.
yeah its not giving that?Did you got it why?
Doing Prediction on External Image
img = cv2.imread(r’C:\Users\abhij\Downloads\img_b.jpg’)
Can anyone send the dataset for “img_b.jpg”
Where is”img_b.jpg”? The file is missing.
can i get the complete program in a file.
How to plot confusion matrix and classification report for this ?
I am having trouble installing packages. Need help
img_pred = word_dict[np.argmax(model.predict(img_final))]
what command line is written after this img_disp= ….????
Can u share the full code plz or ss..
Can I get a similarity score between the handwritten letter and the actual letter (letters from the dataset)? If it’s possible could you explain how?
i cannot import SGD and Adam from keras.optmizers while i am running the program in anaconda prompt and writing the code in visual studio code. how to rectify this error because “from” is not working in anaconda prompt.
It is giving wrong predictions.
how can i use desicion tree – random forest in this project ??
how to solve Reading Large File as Pandas DataFrame Memory Error Issue
How can i add numericals tu this dataset and create alphanumeric model
it is predicting a wrong letter. I have fed with “d” but it is predicting that as z