130 Data Science Interview Questions and Answers [Latest]
Free Machine Learning courses with 130+ real-time projects Start Now!!
DataFlair has published a series of best Data Science Interview Questions which consists of more than 130 data science interview questions and answers. Bookmark the links now and thank us later –
- Data Science Interview Questions for Freshers
- Data Science Interview Questions for Intermediate Level
- Data Science Interview Questions for Experienced
So, let’s start with the first part – top Data Science Interview Questions for Freshers.
We bring to you a variety of challenging, insightful data science interview questions curated by top data scientists, industry experts, and experienced professionals widely asked in the industry. This will surely help you to get your desired data science job. This blog consists of the following types of questions –
- Scenario-based data science interview questions to help build critical thinking and improve performance under pressure.
- Project-based data science interview questions based on the projects you worked on.
- Technical data science interview questions related to different programming languages like R, SQL, Python.
- Non-technical data science interview questions based on your problem-solving ability, analytical thinking, and skills.
- And finally open-ended and behavior-based data science interview questions.
Not only this, all the below data science interview questions cover the important concepts of data science, machine learning, statistics, and probability.
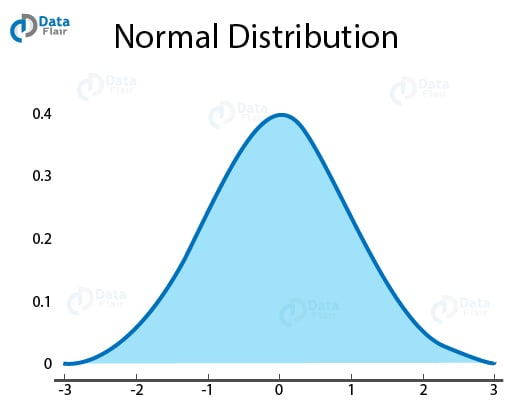
Q.1 What do you understand by the term Normal Distribution?
Normal Distribution is also known as Gaussian Distribution. It is a type of probability distribution that is symmetric about the mean. it shows that the data is closer to the mean and the frequency of occurrences in data are far from the mean.
Q.2 How will you explain linear regression to a non-tech person?
Linear Regression is a statistical technique of measuring the linear relationship between the two variables. By linear relationship, we mean that an increase in a variable would lead to increase in the other variable and a decrease in one variable would lead to attenuation in the second variable as well. Based on this linear relationship, we establish a model that predicts the future outcomes based on an increase in one variable.
Q.3 How will you handle missing values in data?
There are several ways to handle missing values in the given data-
- Dropping the values
- Deleting the observation (not always recommended).
- Replacing value with the mean, median and mode of the observation.
- Predicting value with regression
- Finding appropriate value with clustering
Q.4 How will you verify if the items present in list A are present in series B?
We will use the isin() function. For this, we create two series s1 and s2 –
s1 = pd.Series([1, 2, 3, 4, 5])
s2 = pd.Series([4, 5, 6, 7, 8])
s1[s1.isin(s2)]
Q.5 How to find the positions of numbers that are multiples of 4 from a series?
For finding the multples of 4, we will use the argwhere() function. First, we will create a list of 10 numbers –
s1 = pd.Series([1, 2, 3, 4, 5, 6, 7, 8, 9, 10])
np.argwhere(ser % 4==0)
Output > [3], [7]
Q.6 How are KNN and K-means clustering different?
Firstly, KNN is a supervised learning algorithm. In order to train this algorithm, we require labeled data. K-means is an unsupervised learning algorithm that looks for patterns that are intrinsic to the data. The K in KNN is the number of nearest data points. On the contrary, the K in K-means specify the number of centroids.
Read our latest article on K-means clustering and learn everything about it.
Q.7 Can you stack two series horizontally? If so, how?
Yes, we can stack the two series horizontally using concat() function and setting axis = 1.
df = pd.concat([s1, s2], axis=1)
Q.8 How can you convert date-strings to timeseries in a series?
Input:
s = pd.Series(['02 Feb 2011', '02-02-2013', '20160104', '2011/01/04', '2014-12-05', '2010-06-06T12:05])
To solve this, we will use the to_datetime() function.
pd.to_datetime(s)
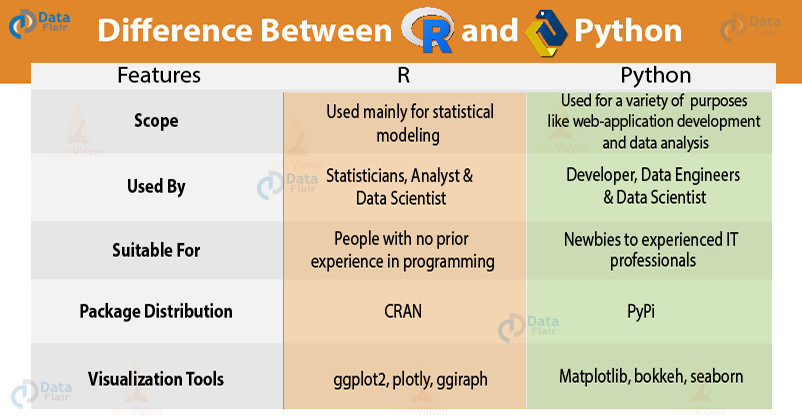
Q.9 Python or R – Which one would you prefer for text analytics?
Both Python and R provide robust functionalities for working with text data. R provides extensive text analytics libraries but its data mining libraries are still in a nascent stage. Python is best suited for enterprise level and for increasing software productivity. For handling unstructured data, R provides a vast variety of support packages. Python is best apt at handling colossal data while R has memory constraints and is slower in response to large data. Therefore, the preference for using Python or R depends on the area of functionality and usage.
Revise Python vs R to frame the answer of this data science interview question
Q.10 Explain ROC curve.
Receiver Operating Characteristic is a measurement of the True Positive Rate (TPR) against False Positive Rate (FPR). We calculate True Positive (TP) as TPR = TP/ (TP + FN). On the contrary, false positive rate is determined as FPR = FP/FP+TN where where TP = true positive, TN = true negative, FP = false positive, FN = false negative.
Q.11 How is AUC different from ROC?
AUC curve is a measurement of precision against the recall. Precision = TP/(TP + FP) and TP/(TP + FN). This is in contrast with ROC that measures and plots True Positive against False positive rate.
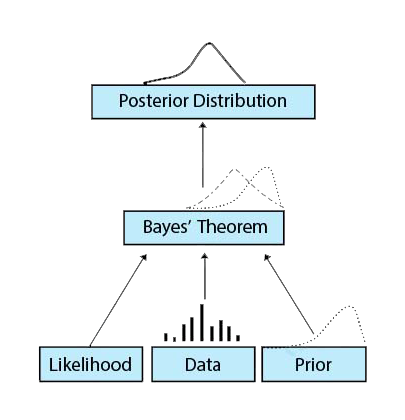
Q.12 Why is Naive Bayes referred to as Naive?
Ans. In Naive Bayes, the assumptions and probabilities that are computed of the features are independent of each other. It is the assumption of feature independence that makes Naive Bayes, “Naive”.
Q.13 How will you create a series from a given list in Pandas?
We will the list to the Series() function.
ser1 = pd.Series(mylist)
Q.14 Explain bias, variance tradeoff.
Bias leads to a phenomenon called underfitting. This is caused by the introduction of error due to the oversimplification of the model. On the contrary, variance occurs due to complexity in the machine learning algorithm. In variance, the model also learns noise and other distortions that affect the overall performance of it. If you increase the complexity of your model, then the error will go down due to reduction in bias. However, after a certain point, the error will increase due to increasing complexity and addition of noise. This is known as bias-variance tradeoff. A good machine learning algorithm should possess low bias and low variance.
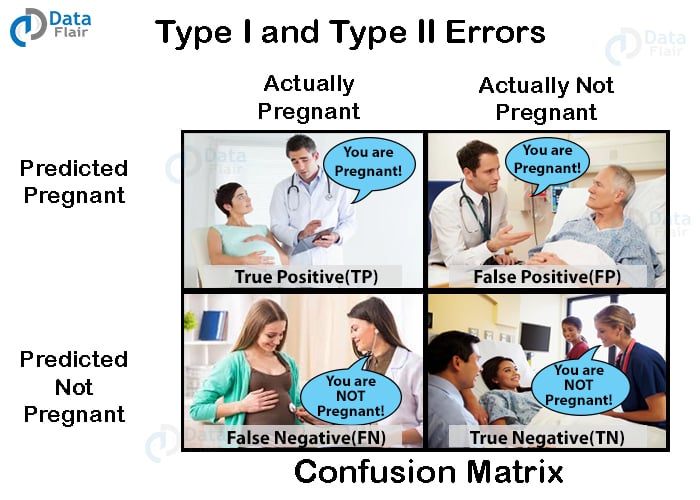
Q.15 What is a confusion matrix?
A confusion matrix is a table that delineates the performance of a supervised learning algorithm. It provides a summary of prediction results on a classification problem. With the help of confusion matrix, you can not only find the errors made by the predictor but also the type of errors.
Q.16 What is SVM? Can you name some kernels used in SVM?
SVM stands for support vector machine. They are used for classification and prediction tasks. SVM consists of a separating plane that discriminates between the two classes of variables. This separating plane is known as hyperplane. Some of the kernels used in SVM are –
- Polynomial Kernel
- Gaussian Kernel
- Laplace RBF Kernel
- Sigmoid Kernel
- Hyperbolic Kernel
Support Vector Machine – Important topic for data science interview
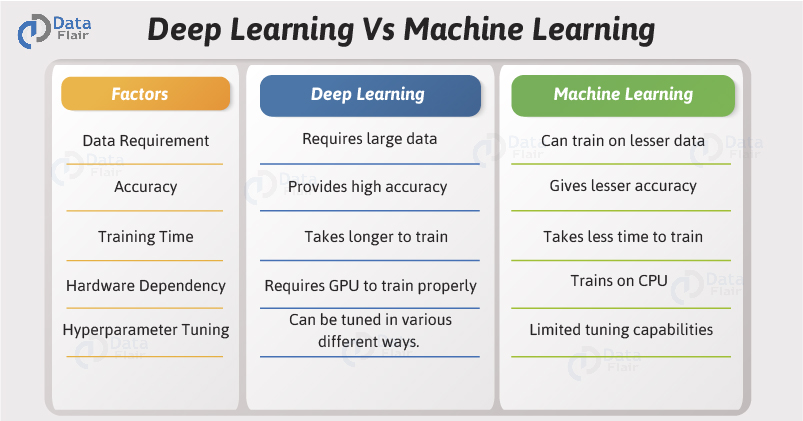
Q.17 How is Deep Learning different from Machine Learning?
Deep Learning is an extension of Machine Learning. It is a special area within ML that is about developing algorithms that simulate human nervous system. Deep Learning involves neural networks which are trained over large datasets to understand the patterns and then perform classification and prediction. Check out the detailed comparison of Deep Learning vs Machine Learning in easy steps
Q.18 How can you compute significance using p-value?
After a hypothesis test is conducted, we compute the significance of the results. The p-value is present between 0 and 1. If the p-value is less than 0.05, then it means that we cannot reject the null hypothesis. However, if it is greater than 0.05, then we reject the null hypothesis.
Q.19 Why don’t gradient descent methods always converge to the same point?
This is because, in some cases, they reach to local or local optima point. The methods don’t always achieve global minima. This is also dependent on the data, the descent rate and origin point of descent.
Q.20 Explain A/B testing.
To perform a hypothesis testing of a randomized experiment with two variables A and B, we make use of A/B testing. A/B testing is used to optimize web-pages based on user preferences where small changes are added to web-pages that are delivered to a sample of users. Based on their reaction to the web-page and reaction of the rest of the audience to the original page, we can carry out this statistical experiment.
Q.21 What is box cox transformation?
In order to transform the response variable so that the data meets its required assumptions, we make use of Box Cox Transformation. With the help of this technique, we can transform non-normal dependent variables into normal shapes. We can apply a broader number of tests with the help of this transformation.
Q.22 What is meant by ‘curse of dimensionality’? How can we solve it?
While analyzing the dataset, there are instances where the number of variables or columns are in excess. However, we are required to only extract significant variables from the group. For example, consider that there are a thousand features. However, we only need to extract handful of significant features. This problem of having numerous features where we only need a few is called ‘curse of dimensionality’.
There are various algorithms for dimensionality reduction like PCA (Principal Component Analysis).
Q.23 What is the difference between recall and precision?
Recall is the fraction of instances that have been classified as true. On the contrary, precision is a measure of weighing instances that are actually true. While recall is an approximation, precision is a true value that represents factual knowledge.
Q.24 What is pickle module in Python?
For serializing and de-serializing an object in Python, we make use of pickle module. In order to save this object on drive, we make use of pickle. It converts an object structure into character stream.
Learn everything about Pickle module in Python
Q.25 What are the different forms of joins in a table?
Some of the different joins in a table are –
- Inner Join
- Left Join
- Outer Join
- Full Join
- Self Join
- Cartesian Join
Q.26 List differences between DELETE and TRUNCATE commands.
DELETE command is used in conjunction with WHERE clause to delete some rows from the table. This action can be rolled back.
However, TRUNCATE is used to delete all the rows of a table and this action cannot be rolled back.
Q.27 Can you tell some clauses used in SQL?
Some of the commonly used clauses in SQL are –
- WHERE
- GROUP BY
- ORDER BY
- USING
Q.28 How will you get second highest salary of an employee emp from employee_table?
In order to get the second highest salary of an employee, we will use the following query –
SELECT TOP 1 salary
FROM(
SELECT TOP 2 salary
FROM employee_table
ORDER BY salary DESC) AS emp
ORDER BY salary ASC;
According to many data scientist, this question is considered as the most asked data science interview question.
Q.29 What is a foreign key?
A foreign key is a special key that belongs to one table and can be used as a primary key of another table. In order to create a relationship between the two tables, we reference the foreign key with the primary key of the other table.
Q.30 What do you mean by Data Integrity?
With data integrity, we can define the accuracy as well as the consistency of the data. This integrity is to be ensured over the entire life-cycle.
Q.31 How is SQL different from NoSQL?
SQL deals with Relational Database Management Systems or RDBMS. This type of database stores structured data that is organized in rows and columns, that is, in a table. However, NoSQL is a query language that deals with Non-Relational Database Management Systems. The data present here is unstructured. Structured data is mostly generated from services, gadgets and software systems. However, unstructured data, which is increasing day by day, is generated from users directly.
Q.32 Can you tell me about some NoSQL databases?
Some of the popular NoSQL databases are Redis, MongoDB, Cassandra, HBase, Neo4j etc.
Q.33 How is Hadoop used in Data Science?
Hadoop provides the data scientists the ability to deal with large scale unstructured data. Furthermore, various new extensions of Hadoop like Mahout and PIG provide various features to analyze and implement machine learning algorithms on large scale data. This makes Hadoop a comprehensive system that is capable of handling all forms of data, making it an ideal suite for data scientists.
Improve your Hadoop skills and become the next data scientist
Q.34 How can you select an ideal value of K for K-means clustering?
There are several methods like the elbow method and kernel method to find the number of centroids in the given cluster. However, to ascertain an approximate number of centroids quickly, we can also take the square root of the number of data points divided by two. While this technique is not entirely accurate but is fast as compared to the previously mentioned techniques.
It is the right time to practice your data science learning through Project – Uber Data Analysis Project in R
Q.35 Define underfitting and overfitting.
Most statistics and ML projects need to fit a model on training data to be able to create predictions. There can be two problems while fitting a model- overfitting and underfitting.
- Overfitting is when a model has random error/noise and not the expected relationship. If a model has a large number of parameters or is too complex, there can be overfitting. This leads to bad performance because minor changes to training data highly changes the model’s result.
- Underfitting is when a model is not able to understand the trends in the data. This can happen if you try to fit a linear model to non-linear data. This also results in bad performance.
Q.36 What are univariate, bivariate and multivariate analysis?
Three types of analysis are univariate, bivariate and multivariate.
- Univariate analysis includes descriptive statistical analysis techniques which you can differentiate on the basis of how many variables are involved. Some pie charts can have a single variable.
- Bivariate analysis explains the difference between two variables at one time. This can be analyzing sale volume and spending volume using a scatterplot.
- Multivariate analysis has more than two variables and explains effects of variables on responses.
Best Data Science Interview Questions
Below I am sharing top data science interview questions and this time I am not providing the answers. Now it is your turn to answer. Try to answer them and then share your answer through comments. Trust me this is the best practice for any interview preparations. So, here are the questions –
Q.1 Tell us about your favorite machine learning algorithm and why you like this?
Q.2 If you are a data scientist, how will you collect the data. What will be your data acquisition and retention strategy?
Q.3 Which uncommon skills you can add to your data science team?
Q.4 How did you upgrade your analytical skills? Tell us your practices
Q.5 If I will give you a data set, what will you do with it to know whether it suits your business needs or not?
Q.6 Tell us how to effectively represent data using 5 dimensions.
Q.7 What do you know about an exact test?
Q.8 What makes a good data scientist?
Q.9 Which tools will help you to succeed in your role as a data scientist?
Q.10 How would you resolve a dispute with a colleague?
Q.11 Have you ever changed someone’s opinion at work?
Q.12 According to you, what makes data science so popular?
These were some of the most asked data science interview questions. I hope you will try to frame the answers on your own, post them through comments. Let’s check how much you know about Data Science, Machine Learning, and R.
Summary
So, this is the end of our first part of data science interview questions. Hope you enjoyed it. If there is anything we missed or you have any suggestions comment below. It will help other students to crack the data science interview.
If you want to practice top scenario or situation based data science interview questions then don’t forget to check the second part of the Data Science Interview Questions and Answers Series.
All the best👍
Did we exceed your expectations?
If Yes, share your valuable feedback on Google


I really get stunned by the article provided on your site. Never saw that any site published this much about data science and I loved and I can share with my friends that this site is more useful to us about data science.
Thank you.
We are glad to hear that our genuine users are liking and sharing DataFlair tutorials with others. Do let us know if you are looking for any other technology and we will be glad to help you out.
Please check the answer to question to Q18.
If p-value <= significance value, reject the null hypothesis,
else, fail to reject the null hypothesis.