Essential Math and Statistics concepts hand in hand for Data Science
Machine Learning courses with 100+ Real-time projects Start Now!!
Converting raw and quantitative data into organized and informative information needs a lot of brain power and understanding. It is true that everyone can’t be Aryabhatta but, you can be hardworking, focused and dedicated.
So, it is time to show your dedication and hard work for learning maths and statistics for data science.
Mathematics and Statistics are two of the most important concepts of Data Science. Data Science revolves around these two fields and draws their concepts to operate on the data. Today, we will explore the various concepts that build up data science and their practical usages in this field.
Mathematics & Statistics for Data Science
Data Science has become a trending technology in the world today. In order to learn data science, you must reinforce your knowledge of mathematics and statistics. So let’s first explore how much maths is required for data science –
Math for Data Science
Mathematics has created an impact on every discipline. The magnitude of the usage of mathematics varies according to the disciplines. There are two main components of mathematics that contribute to Data Science namely – Linear Algebra and Calculus.
In this section of mathematics for data science, we will briefly overview these two fields and learn how they contribute towards Data Science.
1. Linear Algebra
It is the first and foremost topic of data science. Linear Algebra is widely used in image recognition, text analysis and also dimensionality reduction. Consider these two images –


Can you tell which picture is of the dog and which belong to the cat? Well, of course, you can! This is because our minds have been trained since birth to recognize cats from dogs. As a result, we use our instincts to derive insights about the data.
But what if you are required to design an algorithm through which cats and dogs can be classified? This task is known as classification and it is the most popular application of machine learning. As a matter of fact, the computer is able to recognize the images of cats and dogs through linear algebra.
It stores this image in the form of matrices. These matrices form the most important component of linear algebra. Linear Algebra is designed to solve problems of linear equations. These equations can sometimes contain higher dimension variables.
These higher dimension variables cannot be visualized or manipulated. Therefore, we invoke the power of matrices to help us in manipulating data of n-dimensions. There are three types of matrices –
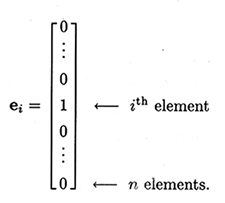
- Vectors – These are single dimensional matrices. By single, we mean that they n-rows but just one column.
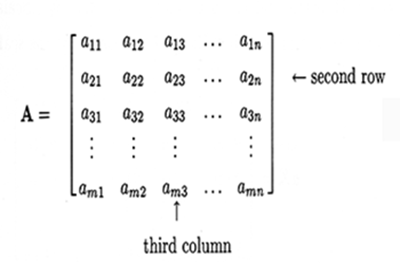
- 2-Dimensional Matrix – These type of matrices are the most common ones and have two dimensions. There is an arrangement of n-rows and n-columns.
- Scalars – Thok
- t is, their order is much greater than 2.
There are several support libraries and tools for linear algebra. One such library is numpy, which is used in Python programming. Here is a sample numpy code for creating vectors and matrices –
import numpy as np
arr = np.array([1,4,7,8])
arr
> array([1, 4, 7, 8])
arr2 = np.array([[1,2,3], [4,5,6], [7,8,9], [10,11,12]])
arr2
>array([[ 1, 2, 3],
[ 4, 5, 6],
[ 7, 8, 9],
[10, 11, 12]])
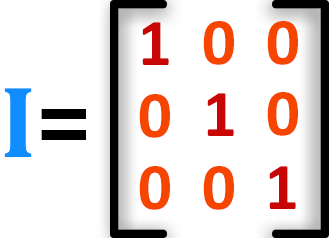
Another important form of matrices is the identity matrix. In this, the matrix is with 1’s but only diagonally. Rest of the values in the matrix are 0.
Explore Top Python Libraries in just 3 Min
Linear Algebra Techniques for Data Science
There are other important types of matrices like inverse matrix and operations like transpose of a matrix. Now, we will overview some of the important linear algebra techniques that are used in data science.
Single Value Decomposition – Singular Value Decomposition allows you to manipulate matrices by dividing them into three different matrices. These matrices are a product of scaling, rotation, and shearing.
Eigenvalue Decomposition – Eigenvalue decomposition allows you to reduce matrices in order to boost the matrix operations. It helps to generate new vectors that are in the same direction as the former ones. We further decompose the matrix into eigenvalue and eigenvectors
Principal Component Analysis – In order to reduce higher dimensions, we use Principal Component Analysis. It is most widely used for dimensionality reduction, which is the processing of reducing the number of variables or dimensions without losing strongly correlated labels.
2. Calculus
Another important requirement of Maths for Data Science is calculus. Calculus is used essentially in optimization techniques. You cannot have a deep knowledge of machine learning without calculus.
Using calculus, you can carry out mathematical modeling of artificial neural networks and also increase their accuracy and performance. Calculus can be classified into –
2.1 Differential Calculus
Differential Calculus studies the rate at which the quantities change. Derivates are most widely used for finding the maxima and minima of the functions. Derivates are used in optimization techniques where we have to find the minima in order to minimize the error function.
Another important concept of derivates that you must know about is the partial derivates that are used for designing backpropagation in neural networks. Chain Rule is another important concept used to compute backpropagation.
Apart from minimizing error functions and backpropagation, we utilize differential game theory for Generative Adversarial Neural Networks.
2.2 Integral Calculus
Integral Calculus is the mathematical study of the accumulation of quantities and for finding the area under the curve. Integrals are further divided into definite integrals and indefinite integrals.
Integration is most widely used in computing probability density functions and variance of the random variable. Bayesian Inference is another important field in machine learning that makes use of the integral calculus.
After understanding the important topics of mathematics, we will now take a look at some of the important concepts of statistics for data science –
Statistics for Data Science
Statistics is the study of collection, analysis, visualization and interpretation of the data. Data Science is like a powerful sports-car that runs on statistics. It uses stats to churn raw data into insights that make up the data products.
Statistics deals with raw data and helps the industries to take careful data-driven decisions. Statistics provides you with various tools and features that can help you to unearth a massive amount of data.
Furthermore, with statistics, you can develop a profound comprehension of data through data summarization and inference. Speaking of these two terms, statistics is divided into two –
- Descriptive Statistics
- Inferential Statistics
1. Descriptive Statistics
Descriptive Statistics or summary statistics is used for describing the data. It deals with the quantitative summarization of data. This summarization is performed through graphs or numerical representations.
In order to have a full grasp of descriptive statistics, you must possess some of the following key concepts –
1.1 Normal Distribution
In a normal distribution, we represent a large number of data samples in a plot. Using normal distribution, we represent large values of variables in a bell-shaped curve which is also known as a Gaussian Curve.
This bell curve is symmetric in nature, meaning that the values further away from the mean taper off equally in both the left and right directions. For undertaking inferential statistics, it is mandatory that the data is normally distributed.
Recommended reading – K-means Clustering
1.2 Central Tendency
Using a central tendency, we identify the central point of the data. Mean, Median and Mode are the three important parts of central tendency. Mean is the arithmetic average of all the values in sample data.
Whereas, the median is the middle value of the data (arranged ascendingly) and mode, which is the most frequently occurring value in our sample.
1.3 Skewness & Kurtosis
There can be instances of data, where the distribution does not exhibit any form of symmetry. For example, a Gaussian curve has zero skewness. When more data accumulates to the left side, we observe a positive skew and when data accumulates on the right side, we have a negative skew.
Kurtosis measures the “tailedness” of the graph. By tailedness, we infer that kurtosis measures the extreme values in either tails of the graph.
Basically, distributions with a large kurtosis have tails that are larger than the ones exhibited by normal distributions whereas, negative kurtosis has smaller tails than normal distributions.
1.4 Variability
Variability measures the distance of the data-point from the central mean of the distribution. There are various measures of variability such as range, variance, standard-deviation and inter-quartile ranges.
2. Inferential Statistics
Inferential Statistics is the procedure of inferring or concluding from the data. Through inferential statistics, we make a conclusion about the larger population by running several tests and deductions from the smaller sample.
For example, during an election survey, you want to know how many people support a particular political party. In order to do this, you simply have to ask everyone about their views, right?
This approach is simply not right, because there are billions of people in India and surveying every single person is an excruciatingly difficult task. Therefore, we select a smaller sample, make deductions from that sample and attribute our observations on the larger population.
There are various techniques in inferential statistics which are useful for data science. Some of these techniques are –
2.1 Central Limit Theorem
In a central limit theorem, the mean of the smaller sample is the same as that of the mean of the larger population. Therefore, the resulting standard deviation is equal to the standard deviation of the population.
An important concept of the Central Limit Theorem is the estimation of the population mean. Margin error can be calculated by multiplying the standard error of the mean with the z-score of the percentage of confidence level.
2.2 Hypothesis Testing
Hypothesis testing is the measure of assumption. Using hypothesis testing, we attribute the results from a smaller sample on a much larger group. There are two hypotheses that we require to test against each other – Null Hypothesis and Alternate Hypothesis.
A null hypothesis represents the ideal scenario whereas an alternate hypothesis is usually the opposite of it, that using which, we try to prove it wrong.
2.3 ANOVA
Using ANOVA, we test our hypothesis for multiple groups. It is an improvement of another form of an inferential technique called t-test. ANOVA performs the testing with a minimal error rate.
One metric for measuring ANOVA is called f-ratio. F-ratio is the ratio of the mean-square internally to the group and mean-square between the groups.
2.4 Qualitative Data Analysis
Qualitative Data Analysis consists of two important techniques – correlation and regression. Correlation is the measure of finding relationships between random variables and bi-variate data. Regression is another form of qualitative data analysis.
In regression, we estimate the relationship between the variables. There is simple regression and multi-variable regression. Also, if the function is non-linear in nature, then we have a non-linear regression.
Summary
Math and statistics are the backbone of data science. Every data scientist must understand how numbers work, how to measure trends, and how to make decisions based on data. Key topics include probability, mean, median, standard deviation, correlation, and hypothesis testing. These help in drawing conclusions from data. Without a solid math foundation, it’s hard to explain or trust your data models.
Linear algebra and calculus also play a part, especially in machine learning. Concepts like vectors, matrices, and derivatives are used to build models like linear regression, neural networks, and recommendation systems. You don’t have to be a math genius—but you must understand how and why algorithms behave the way they do. This helps you tune your models better and avoid errors in predictions.
Statistics is the art of drawing insights from limited data. It helps you test ideas, understand risk, and validate your assumptions. Whether you are measuring customer satisfaction or predicting sales, statistical knowledge is essential. Tools like Python and R have built-in support for statistical calculations, but understanding the “why” behind numbers gives you the edge. A good data scientist is not just a coder, but also a thinker who interprets data with logic.
Hope now you are clear with all the concepts related to mathematics and statistics for data science. It’s time to check how this concept will help you to get your first job in data science.
Provide your valuable feedback on the above topic through comments.
Your 15 seconds will encourage us to work even harder
Please share your happy experience on Google


Thanks for sharing valuable information.
Thanks for sharing valuable information.
Having a degree in Maths & Statistics.
Help me to revise maths and statistics
Very interesting.
Regards
Having a degree in Maths & Statistics.
Help me to revise maths and statistics
Very interesting.
Regards