Data Science Prerequisites – Top Skills Every Data Scientist Need to Have
Machine Learning courses with 100+ Real-time projects Start Now!!
Data Science is a massive sector, it is not just one standalone topic but a combination of many. Often, many of us wandering from where to start the learning and what are the prerequisites for data science.
So, in this article, we will go through some of the topics that are required for aspiring Data Scientists to master in order to solve data-oriented problems.
We will divide this article into two sections – Fundamental Prerequisites and Programming Prerequisites of Data Science. Then, we will further elaborate on each topic and list out important parts of both the sections required to be a proficient Data Scientist.
Let us start with our first Data Science Prerequisites – Fundamental Prerequisites.
What are the Prerequisites for Data Science?
Here are some Fundamental Prerequisites for Data Science –
1. Statistics
Data Science is a more recent terminology. While it has been in existence for many decades, its formal name was ‘Statistics’ and the Data Scientist was known as ‘Statistician’. Data Science is all about Statistics. It forms the core backbone and gives Data Science its true form.
Data Science is like a powerful sports car. It is a state of the art machine that can churn data and give out insights about it. Under the hood lies bare statistics. This statistics powers the car and gives it the ability to process all the information that comes along the way.
In order to master Data Science, one must first learn Statistics.
There are various concepts in Statistics that one must know about. Overall, Statistics can be classified into two groups –
- Descriptive Statistics
- Inferential Statistics
Essential Data Science Ingredients – Top Data Science Tools
1.1 Descriptive Statistics
Descriptive Statistics is about describing the data. It helps you to understand your data. It deals with the quantitative summarization of your data through numerical representations or graphs. Some of the concepts required for understanding Descriptive Statistics are:
- Normal Distribution
- Central Tendency
- Kurtosis
- Variability
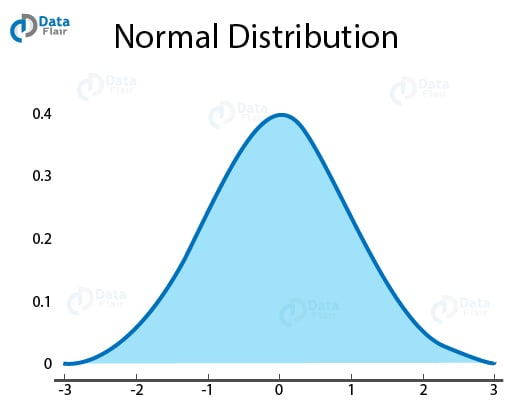
a. Normal Distribution
Normal Distribution, also known as Gaussian Distribution is a representation of large samples of data in a plot. It is a distribution of the values of a variable using a probability function.
In a normal distribution, there is a symmetric bell-shaped curve where the observations cluster at a central peak where they represent average or mean. As the values move further away from the mean, they taper off equally in both the left and right direction.
In order to perform inferential statistics, it is necessary for the data to be normally distributed.
b. Central Tendency
A Central Tendency or measure of Central Tendency identifies a central point within a given sample of data. There are three parts of central tendency – mean, median and mode.
Like the normal distribution that we discussed above, mean occurs at the central point of the sample data. And it is known as the arithmetic average of all the data values. It is the sum of all the data values divided by the number of data values. It is written as –
![]()
Another measure of Central Tendency is median. A median is the middle value of the data arranged in order of their ascending magnitude.
It is easier to find a middle value in a set of odd numbers but in order to find the middle value of the set of even numbers, we take the average of the two middle scores and take the output value as the median.
The third measure of Central Tendency is mode. A mode is the most frequently occurring value in the given data sample.
c. Skewness & Kurtosis
Skewness measures the lack of symmetry in a data sample. A symmetrical data is present in the form of normal distribution where the trail is evenly distributed to the left and right side of the mean. Skewness is zero for a normally distributed data sample.
A positive skew is facilitated by the data aggregating to the left side whereas a negative skew occurs when the data is stacked to the right side.
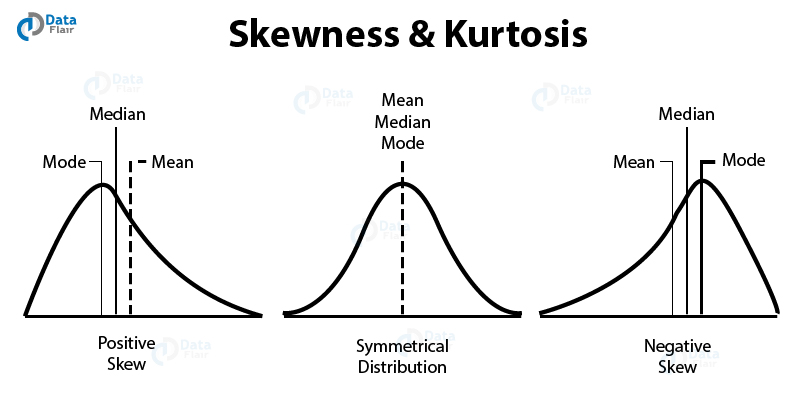
On the other hand, Kurtosis is a measurement of the ‘tailedness’ of the probability distribution. It measures if the data is heavy-tailed or light tailed in relation to the central location of the distribution. With high kurtosis, data-sets are heavy-tailed whereas with light kurtosis, data-sets possess light tails.
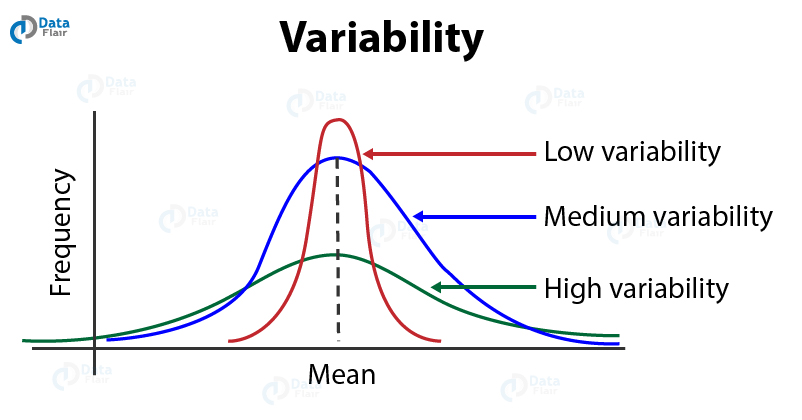
d. Variability
Variability is a measure that determines how far is the data point from the central mean of the distribution. It also measures the magnitude of the distance between these data-points. The measures of variability are range, variance, and standard deviation and interquartile range.
Range is a measure of the difference between the largest and the smallest value of your data sample. Variance is the difference of the squared values from the mean and Standard Deviation is the square root of the variance.
Interquartile range is the difference between the upper quartile and lower quartile. The lower quartile is the 1st quartile representing 25% of the data whereas upper quartile is the 3rd quartile representing 75% of the data.
After getting introduced to descriptive statistics and various measurements involved in it, we will move ahead to inferential statistics.
Do you know how Amazon is using Data Science? Top Data Science Use Cases
1.2 Inferential Statistics
While Descriptive Statistics is about describing the data, Inferential Statistics is about inferring or concluding from the data. In general, inferential statistics is about making inferences about the population through a smaller sample.
For example, consider that you have to count the number of people who have been vaccinated from polio in India. There are two ways to do this:
- You ask each and every person in the country if they have been vaccinated, or
- You draw a sample of people from your city and use the responses from the local population to calculate the average number of vaccinated people in the country.
The first method is not feasible as it is impossible to ask every individual citizen of this country.
The second task can be performed but with the implementation of certain statistical measures that will help us to draw conclusions or inferences from a small sample and use it to understand trends and patterns of a much larger group of people.
In this section, we will discuss in brief and introduce these inferential statistical tools that will help us to do the above task.
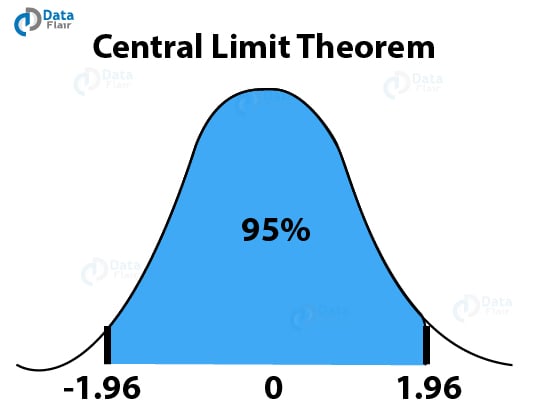
a. Central Limit Theorem
According to the central limit theorem, the mean of the sample is the same as that of the entire population. This also means that the standard deviation of the sample will be equal to the standard deviation of the population.
And finally, with the increase in the sample size, the standard errors will become lower resulting in a more normal shaped curve. This will also help in determining the mean of the population more accurately.
One concept that is important in Central Limit Theorem is “Confidence Interval”. This confidence interval is a measure of an estimate of the population mean. A confidence interval surrounds the mean of your sample. The process of constructing your interval involves the addition of a margin of error.
You can calculate the margin error by multiplying the standard error of mean with the z-score of the percentage of confidence level. Therefore, it is concluded that a confidence level represents the percentage of interval estimates containing the population.
Learn how these concepts are used in banking sector – Applications of Data Science in Banking.
b. Hypothesis Testing
Hypothesis testing is the measure of testing an assumption. It is used to infer the results of the hypothesis performed on sample group from a larger group or population.
The hypothesis that we need to test is called the Null Hypothesis and the hypothesis against which we need to test is known as an Alternate Hypothesis. Null Hypothesis is often the ideal case that we need to test.
For example, suppose we are surveying two groups of people – one group that smokes and the other which does not smoke. We assume that the mean of cancer patients in the smoking group is the same as the mean of cancer patients in the non-smoking group.
This is our null hypothesis that we need to test and decide if we have to reject this hypothesis or not.
Conversely, our alternate hypothesis would be: The number of cancer patients in the smoking group is much more than the non-smoking group. Therefore, the mean of the cancer patients in the smoking group is much higher than the non-smoking group.
Based on the given data and the evidence, we are able to test the two hypotheses and conclude if we need to reject the null hypothesis or we do not need to reject the null hypothesis.
The hypothesis is tested in four steps-
- We need to explain both the null and alternate hypothesis so that one of it can be rejected.
- Evaluating the data through an analysis plan.
- Compute the test statistic and physically analyze the sample data.
- Finally, we interpret the result and reject one of the two hypotheses.
c. ANOVA
ANOVA is basically hypothesis testing for multiple groups. It is used to check if the groups have the same means and variances. While t-test can prove to be tedious and complex owing to various factors, ANOVA can perform this role much better with a minimal error rate.
Using F-ratio, we can measure ANOVA. F-ratio is defined as the ratio of the Mean Square (between groups) to the Mean Square (internally in the group). The various steps towards calculating ANOVA are:
- Understanding and generating the two hypotheses – null and alternative. In null hypothesis, assume that the mean of all the groups is the same whereas in an alternative hypothesis, the mean is different.
- Calculate the mean squares within groups and mean squares between the groups.
- Calculate the F-ratio using the above-calculated values.
- Using the F-table, calculate the probability.
- If the calculated F-value is greater than the F-critical value, then we reject our null hypothesis.
d. Quantitative Data Analysis
Two of the common Quantitative Data Analysis techniques are correlation and regression. Correlation is a statistical relationship between two random variables and bivariate data. There are three types of correlation – Positive Correlation, Negative Correlation, and Zero Correlation.
A positive correlation means that there is a relationship between two variables that enables them to increase and decrease together. In a negative correlation, an increment in one form of variable causes a decrement in another variable.
Whereas in a zero correlation, there is absolutely no relation between the two variables.
Some common examples of correlation are – There is a positive correlation between people who eat more and obesity. Similarly, there is a negative correlation between people spending their time to exercise and their weight gain.
Another type of Quantitative Data Analysis is Regression. Regression is a statistical technique for estimating the relationships among variables. Regression can be simple regression, multiple regression based on the number of independent variables.
Furthermore, if the function used is non-linear in nature, then the type of regression is called non-linear regression.
After going through some of the basic concepts of Statistics in brief, we will now go through some of the mathematical prerequisites for Data Science.
2. Mathematics for Machine Learning
There are two really important topics of mathematics that one must know before getting into Data Science & Machine Learning.
While the depth of mathematics may seem daunting at first, but if you use the right approach through the practical implementation of maths, it can be quite fun! With this let us take a look at two of the concepts required to master in Data Science.
2.1 Linear Algebra
Linear algebra refers to study of vectors and linear functions. Linear algebra is central to all the topics of Mathematics, and in the case of Data Science, Linear Algebra forms the core backbone of Machine Learning.
It involves various matrix, vector, and tensor operations to carry out Machine Learning algorithms. Various machine learning topics like computer vision and natural language processing rely heavily on Linear Algebra.
With the emergence of advanced deep learning algorithms, computers are able to perform complex linear algebra problems. Your mobile phone using facial recognition to unlock itself relies on linear algebra.
Also, linear algebra is used in Principal Component Analysis (PCA) which is a topic of dimensionality reduction in machine learning.
Furthermore, it is used in conjunction with statistics through its implementation in multivariate statistics, solutions to least squares in regression and covariance matrix in Gaussian Distribution. Therefore, in order to become a data scientist, one must have strong fundamentals in Linear Algebra.
Do you know about Natural Language Processing? Learn through complete NLP Tutorial
2.2 Calculus
Calculus is a mathematical study of continuous change. We need calculus to understand how quantities dissipate (derivative) and accumulate (integrate) over time. In Data Science, calculus is used in optimization techniques.
One such optimization technique that uses calculus is gradient descent. Gradient Descent is a measurement of the change in the output of a function with a change in input.
Gradient Descent makes use of a “Cost Function” which measures the goodness of a given line. To find the gradient of this line, we make use of Partial Differential Calculus. Another important form of calculus used in Data Science is Multivariate Calculus.
Therefore, to understand optimization principles in Machine Learning, a Data Scientist must know calculus.
3. Programming Prerequisites for Data Science
After going through some of the fundamental prerequisites for Data Science, we will now have a look at some of the programming languages and tools required for this field.
While the fundamentals are necessary for designing recipes for cooking data science problems, we need programming languages and tools as its essential ingredients. Some of the tools and programming languages specialized for Data Science are –
3.1 Excel
Excel is an ideal introductory tool for Data Science. Microsoft Excel is widely used for data analysis, creating spreadsheets, visualization and complex calculations. You can implement the basic concepts of Statistics in Excel.
It will teach you the basics of data analysis and how to interface with tables. It will also help you to understand descriptive statistics through its visualization abilities.
You can also simulate a basic neural network in the spreadsheet of Excel to have a clearer understanding of it.
You can learn various features of excel like data sorting, filter, creating pivot tables to get a better understanding of handling data. Overall, for beginners who are learning how to handle data, Excel can be a good start.
3.2 Python
It is one of the most popular programming languages. It has a variety of applications ranging from web-application development to data science. Python is widely used as a programming language for Data Science due to the mass abundance of libraries and packages.
Python is open-source which means that you can enjoy a wide range of support for development and implementation of data science tools.
It is also popular due to its code-readability and an easy learning curve. This means that it is an ideal programming language for beginners. Python is an interpreter based language as it interprets the Python code line by line.
This offers a huge advantage when it comes to debugging. Python offers a large number of libraries like Tensorflow, Pytorch, Keras, scikit-learn that are specifically tailored for Data Science and machine learning.
You must learn more about – Python for Data Science
3.3 R
R is the most popular tool for data science aspirants and professional data scientists alike. R is customized to develop statistical models for analyzing large amount of data.
While R is an excellent tool for complex statistical problem, it has the problem of a steep learning curve, making it difficult for beginners. In order to become a proficient Data Scientist, it is a must that you learn R.
R also provides a variety of libraries and tools for in-depth data analysis. R has a cluster of pre-compiled distribution packages called CRAN.
There are over 10,000 packages in CRAN for various statistical applications. For beginners, RStudio is an ideal platform for users to test their R code in a standardized environment.
3.4 SQL
SQL is the most important programming language required for Data Science. It is a database query language which means that it is used to retrieve information from databases. A database is a collection of information organized in rows and columns in a table.
SQL is a tool that data scientists use for retrieving, manipulating and managing the data. The type of database used is called Relational Database. The word relational means that the data is structured and organized in rows and columns of the table.
SQL has several proprietaries like SQLite, MySQL etc. SQL has been used for several years and is one of the earliest tools developed for managing data. Data Extraction is the foremost and principal step in data science, making SQL an important tool.
Learn more about SQL with a complete SQL Tutorial
Summary
Data Science is a vast field based on multiple fields. In order to master Data Science, one must have knowledge of the underlying fields.
One of the most important things you need is curiosity. You should enjoy asking questions and trying to find answers using data. Problem-solving skills and the ability to think logically are more useful than memorizing formulas. If you’re comfortable using a computer and are open to learning, you already have the mindset needed for Data Science. With the right attitude and steady effort, even a beginner can succeed in this field.
Hope you liked the article.
Any questions regarding Data Science Prerequisites? Ask in the comment section below. We will love to answer your query.
We work very hard to provide you quality material
Could you take 15 seconds and share your happy experience on Google


