Want a Thriving Career? Focus on Machine Learning for Data Science!
Machine Learning courses with 100+ Real-time projects Start Now!!
Machine Learning is one of those fields that has taken over the world by storm. Aligned with Data Science, it has given a new meaning to the way we define and perceive data. In this article, we will see how relevant machine learning is in data science.
Furthermore, we will discuss various machine learning algorithms and also the tools used for machine learning.
Data Science is a vast domain of various underlying data operations. Predictive Modeling is one of the final steps of Data Science. In order to fully incorporate the power of predictive analytics, we make use of Machine Learning.
This field has been around for many years but has recently gained popularity due to the emergence of Deep Learning and high-performance computing.
At the end of this article, I will provide you the best Machine Learning Tutorials Series designed by DataFlair that will help you to master Machine Learning for Data Science. Let’s start-
Machine Learning for Data Science
Machine Learning is one of the most important processes in Data Science. With the help of machine learning, you can develop models that identify patterns in data and produce predictions. Machine Learning extends the procedure of Data Science beyond its scope.
While a Data Scientist need not have knowledge of all the algorithms of Machine Learning, he/she must have at least the knowledge of necessary algorithms that appeal to the domain usage.
For example, data scientists working in the finance industry must have knowledge of regression and time-series machine learning algorithms that will help them to predict the movement of stock prices.
Data Scientist in healthcare may also require knowledge of clustering and classification algorithms. However, in order to have a well-versed insight into Machine Learning, considerable knowledge of almost every important algorithm is required.
Formal definition of Machine Learning
Machine Learning is a branch of computer science and statistics where computers can perform tasks without an explicit requirement for programming. The model on which machine learning algorithms build is based on the training data which is a collection of historical datasets.
After training the algorithm over several instances of data, it is then tested or validated against new instances of data called test-data. Finally, the results are taken, accuracy is measured and the performance of the model is tuned to give out better results.
Machine Learning Algorithms can be classified into two types –
- Supervised Learning
- Unsupervised Learning
Supervised Learning
1. Simple Linear Regression
With the help of Linear Regression, we can measure the relationship between the two variables that are continuous. These two variables are
- Independent Variable – “x”
- Dependent Variable – “y”
In simple linear regression, there is only one predictor value which is the independent variable x. We can describe the relationship between x and y as:
y = mx + c
Where m is the slope and c is the intercept.
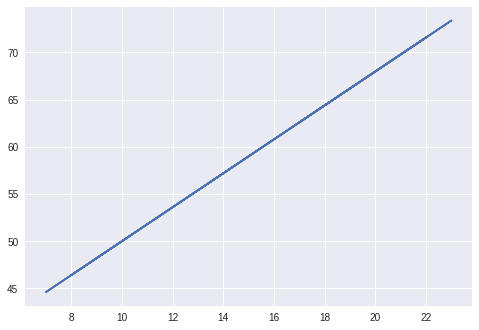
For example: The relationship between Fahrenheit and Celsius is a linear equation.
Fahrenheit = 9/5 * Celsius + 32
Fahrenheit is the y or output.
Celsius is the independent variable or x
The slope in the above equation is 9/5 and the intercept on the y-axis is made at 32.
Therefore, for a given input celsius of
= 17, 23, 18, 7, 19, 22, 8, 9, 14, 22
we obtain an output Fahrenheit temperature of
=62.6, 73.4, 64.4, 44.6, 66.2, 71.6, 46.4, 48.2, 57.2, 71.6.
This can be expressed visually as:
2. Logistic Regression
Unlike linear regression which is used for prediction, logistic regression is used for classification. More specifically, logistic regression is used for categorical classification.
That is, the output will be binary in nature (0 or 1). For example, based on the weather conditions, our Logistic Regression algorithm has to determine whether it will rain(1) or not rain (0).
Hypothesis and Sigmoid curve are two parts of the logistic regression. With the help of a hypothesis, we can formulate the probability of occurrence of an event. A logistic regression consists of two main parts – Hypothesis and Sigmoid.
A hypothesis determines the probability of the occurrence of an event. We fit the data that is obtained from the hypothesis into the sigmoid that carves a log function. This log function helps us to determine the category of the class.
The sigmoid is an S-shaped curve which is represented as follows:

We generate this with the help of logistic function –
1 / (1 + e^-x)
Here, e represents base of natural log and we obtain the S-shaped curve with values between 0 and 1. The equation for logistic regression is written as:
y = e^(b0 + b1*x) / (1 + e^(b0 + b1*x))
Here, b0 and b1 are the coefficients of the input x. These coefficients are estimated using the data through “maximum likelihood estimation”.
3. Decision Trees
With the help of decision trees, you can perform both prediction and classification. Decision Trees are used to make decisions with a given set of input. A decision tree can be understood with the following example:
Suppose you go to the market to buy a product. First, you assess if you really need the product, that is, you will go to the market only if you do not have the product. After assessing it, you will determine if it is raining or not. Only if the sky is clear, you will go to the market, otherwise, you will not go.
Unsupervised Learning
1. K-Nearest Neighbor
KNN is a popular unsupervised learning algorithm that makes use of clustering to recognize patterns in the data. Being unsupervised, KNN understands the implicit pattern of data, recognizes the clusters and assigns the input data points to that specific cluster.
In order to have proper assignment, the algorithm finds the relative distance between points and clusters them accordingly.
Assume that there are two classes of circles and squares. Looking at the below visualization, we can easily recognize circles and squares. However, there is a triangle present in the given distribution. We are tasked with finding a suitable class for this triangle.
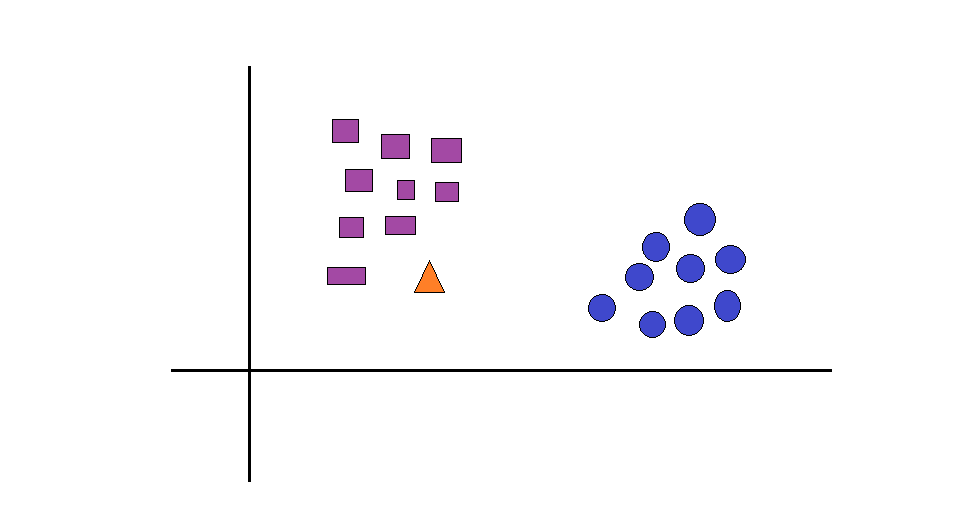
Based on the relative distances between the triangle and the two classes, we conclude that the triangle is closer to the squares. Therefore, the triangle belongs to the square class.
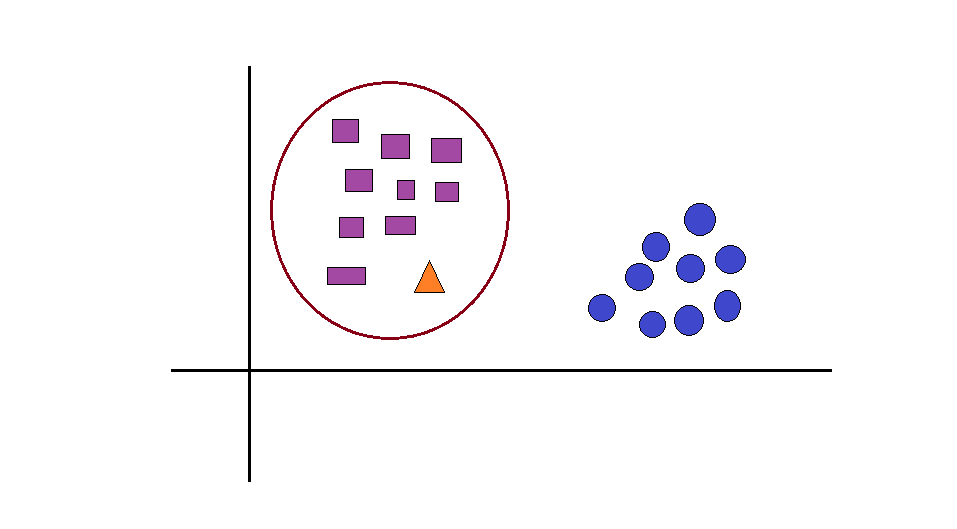
In order to calculate this distance, we make use of Euclidean distance between the data points.
Principle Component Analysis
One of the most important parts of data science is the dimension. There are several dimensions in data. The dimensions are represented as n.
For example, suppose that as a data scientist working in a financial company, you have to deal with customer data that involves their credit-score, personal details, salary and hundreds of other parameters.
In order to understand the significant labels that contribute towards our model, we use dimensionality reduction. PCA is a type of reduction algorithm.
With the help of PCA, we can reduce the number of dimensions while keeping all the important ones in our model. There are PCAs based on the number of dimensions and each one is perpendicular to the other (or orthogonal). The dot product of all the orthogonal PCs is 0.
Let us understand PCA through the plotting of a toy data, in which we see a pattern of data in a single direction.
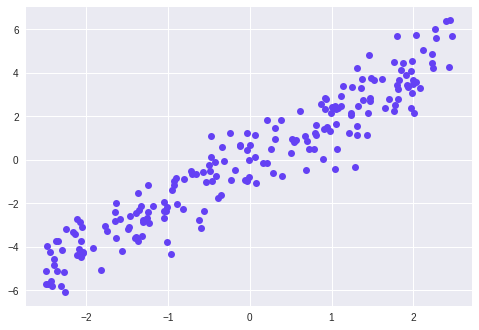
We will fit two PCAs in the above distribution of data points and arrange it in a single direction.
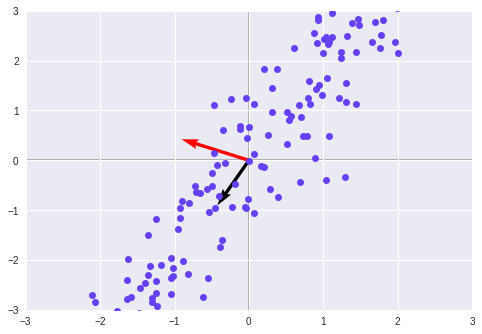
We see in the above graph that the black vector represents an oblique pattern of the data. The black value has a larger eigenvalue associated with it. This data has a larger variance. In order to further reduce this, we transform our dataset.
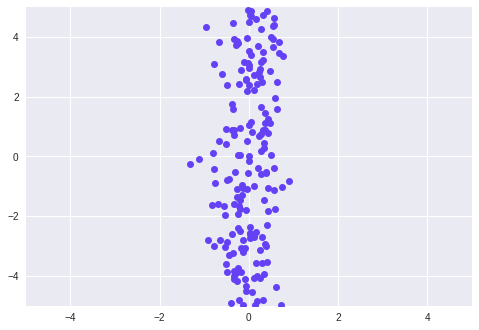
Therefore, we observe that the data has aligned to a single axis with maximum variance. In this way, we can use PCA to reduce the dimensions of our data.
Tools for Machine Learning in Data Science
Some of the popular machine learning tools used in Data Science are –
1. Scikit-learn – One of the most popular libraries of Python, Scikit-learn is a quintessential machine learning library that provides functions for classification, regression, PCA, random forest, LDA etc.
2. NLTK – For implementing machine learning algorithms on textual data, NLTK is an ideal library. With the help of this library, you can carry out various symbolic and statistical procedures for natural language processing. It also provides functions for stemming, lemmatization, punctuation etc.
3. PyTorch – For deep learning operations, Facebook AI released Pytorch, an open-source deep learning framework. Pytorch is flexible and agile. It can be used for rapid prototyping. Uber makes use of Pyro, which is built with PyTorch framework.
4. Keras – With the help of Keras, we can build APIs for designing neural networks. Keras is capable of running on top of Tensorflow, CNTK, and Theano. With Keras, you can perform rapid prototyping.
5. Apache Spark – Apache Spark is a big data platform that also provides provision for various machine learning operations. SparkML is a popular machine learning extension of the Spark that allows you to process data on a large scale.
Summary
Machine learning is the engine behind predictive data science. It allows computers to learn patterns from data and make decisions without being explicitly programmed. In data science, ML is used to build models that forecast sales, detect fraud, recommend products, or predict diseases. Algorithms like linear regression, decision trees, random forests, and neural networks are common tools in a data scientist’s toolkit.
To use machine learning effectively, you must know how to prepare data. This includes cleaning, normalizing, splitting into training and testing sets, and choosing the right model. Then, you train the model on past data and evaluate how well it performs. Tools like scikit-learn (Python), caret (R), and TensorFlow or PyTorch help make this process easier. These libraries offer pre-built functions for building, training, and tuning ML models.
Machine learning is more than just writing code. You need to understand the math behind algorithms, how to avoid overfitting, and how to interpret model outputs. You also need to monitor how your model performs in the real world. As a data scientist, machine learning is your main weapon for turning raw data into actionable insights. Mastering it makes you job-ready for top roles in tech and business.
Hope now you understand the importance of machine learning for data science. As I promised, here is the best Machine Learning Tutorials Series. Master it and become the next Data Scientist.
If you are Happy with DataFlair, do not forget to make us happy with your positive feedback on Google


