SAP BusinessObjects Reporting Tools – 9 Useful Tools You Should Try Today!
Interactive Online Courses: Elevate Skills & Succeed Enroll Now!
Previously, we learned about SAP HANA In-Memory Computing; now, in this article, we will talk about the reporting platform of SAP HANA known as SAP BusinessObjects BI 4 client tools.
We will discuss the different SAP BusinessObjects reporting tools that are available under the SAP BusinessObjects BI 4 package. We will also learn about the different kinds of connections that are established to connect SAP HANA database with the reporting tools.
What are SAP BusinessObjects Reporting Tools?
SAP BusinessObjects BI 4 is an SAP product that offers reporting applications and tools that use data from SAP BW and SAP HANA for reporting and analysis. The business objects reporting tool kit includes tools for reporting and dashboarding.
Business users can create reports and dashboards using these reporting interfaces by utilizing the data from SAP HANA in the form of tables or information views. The list of reporting tools available under SAP BusinessObjects BI 4 package is given below:
- SAP Lumira
- Web Intelligence
- SAP Crystal Reports
- Design Studio
- Dashboard designer
- Universe Designer (IDT/UDT)
- BusinessObjects Explorer
- Analysis Office
- MS Excel
All of these reporting tools connect to the SAP HANA database using individual connection drivers and database languages. Also, they provide the user with data modeling, ETL and reporting features.
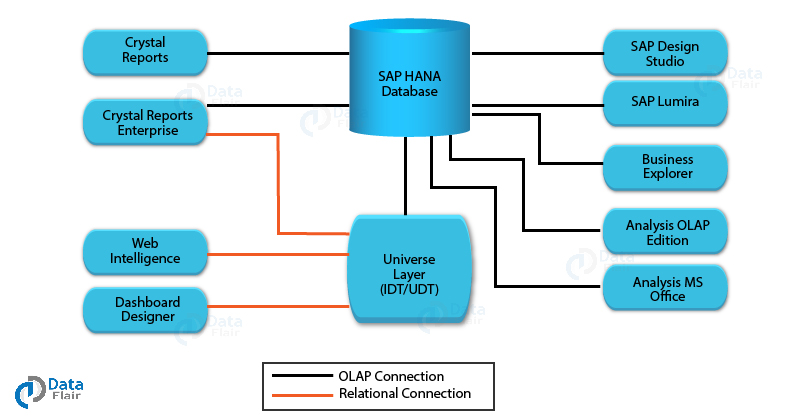
The reporting tools connect with SAP HANA in two ways; either by a direct OLAP connection or through an indirect semantic layer (universe creation) which is a relational connection.
All the tools use OLAP connection method except for Web Intelligence, Dashboard designer and Crystal Report Enterprise.
 Presently, SAP HANA uses support package 7 of SAP BusinessObjects BI 4.2 (SP7). SAP BusinessObjects BI 4.3 is expected to release in mid-2019.
Reporting Tools in SAP BusinessObjects BI Platform
In this section, we will learn in detail about the reporting tools or applications that are a part of the SAP BusinessObjects BI Platform (client tools package):
1. SAP Lumira
SAP Lumira is a self-service data visualization tool which enables business users to connect directly to the SAP HANA database, create visualizations, stories, reports, transform data and do ad-hoc dashboarding.
It uses the BICS connection driver and SQLDBC as the language to connect to the SAP HANA database.
2. SAP Crystal Reports
SAP Crystal Reports is a Windows-based tool for creating reports for printouts and publishing such as sales invoices, sales orders report, etc. The reason behind the name Crystal reports is because of its crystal clear and pixel perfect visuals.
Crystal reports use JDBC/ODBC connectors and SQL as the interaction language to connect to the SAP HANA database.
3. SAP Design Studio
SAP Design Studio is a dashboard designing tool that enables business users to create interactive reporting applications and dashboards. It is an advance-level designing tool that connects to the SAP HANA database using a BICS connection communicating through SQLDBC language.
Design Studio requires complete compatibility and support with SAP NetWeaver BW and SAP HANA platforms. It also provides the capability to do server-side programming.
4. MS Excel
MS Excel is a popular Microsoft tool. Business users can connect to the SAP HANA database through a direct OLAP connection via an ODBO connector that communicates using MDX language.
Only MS Excel can access hierarchical data and data in cube models, i.e., Analytic View and Calculation View in SAP HANA.
5. Analysis Office (OLAP)
Analysis Office is a self-service analysis tool, especially for multi-dimensional data analysis. It works on an OLAP type connection that establishes via BICS connector using SQLDB language connected to the SAP HANA database or SAP BW.
Users can access OLAP data sources and integrate data from more than one OLAP sources.
6. Explorer
Explorer is an information-discovery or exploring tool using which users from all over the enterprise can access the information and draw fresh insights from it. The Explorer tool connects to the SAP HANA database through an OLAP connection using a JDBC connector and SQL language.
7. Universe designer (IDT/UDT)
Universe Designer is a platform to design an intermediate layer on top of the SAP HANA database in case of indirect (relational) connections made with reporting tools like WebI (Web intelligence) and Dashboard Designer.
Universes are semantic layers which transform the information from relational and OLAP non-SAP data sources into business specific information. The reporting tools use the data available in the universe models instead of directly accessing the database.
A universe can be designed in two ways, either by using an Information Design Tool (IDT) or Universe Design Tool (UDT).
A universe is a semantic layer where we can manipulate data in different ways like applying filters, parameters, creating or deleting objects, business layer views, predefined queries, aggregation, variable mapping, etc.
After a semantic layer or universe creates, it publishes on the Business Objects Server Repository from where reporting tools such as Web Intelligence and Dashboards use them. Both IDT or UDT connects to the database using JDBC or ODBC connections communicating through SQL.
8. Web Intelligence
Web Intelligence is an advance-reporting tool having capabilities for ad-hoc reporting, detailed reporting, using query panels, etc. WebI access data from semantic layers through universes created using IDT tool.
The semantic layer creates on top of a non-SAP data source. With IDT, you can access multiple data sources, whereas, with UDT you can only access one data source at a time.
9. Dashboard designer
Dashboard Designer is a reporting tool in SAP BusinessObjects BI4 package for designing dashboards. It provides users with pre-designed dashboard templates which we can utilize in creating static or dynamic charts and visualizations as a part of the dashboard.
Dashboard designer also connects to data sources via universes.
Connections in SAP BusinessObjects Reporting Tools
All the SAP BusinessObjects reporting tools that we have discussed above form either a relational or an OLAP connection with the database layer.
A relational connection is made when the user needs to access conventional data tables. Relational connections can only be made via IDT or UDT created semantic layers.
On the contrary, if you need to access multi-dimensional data cubes, then an OLAP connection is required. It is a direct connection to the business layer of the data model as opposed to the relational connection which is an indirect connection.
These connections enable a user to connect to the data tables or information views in SAP HANA.
Summary
This was all we need to know about the SAP BusinessObjects BI reporting tools. We hope the information provided here is helpful. In the upcoming tutorials, we will discuss each reporting tool in detail and learn how to connect these tools with SAP HANA.
Having any query related to SAP HANA BusinessObjects Reporting Tools? Feel free to enter in the comment section.
Did you know we work 24x7 to provide you best tutorials
Please encourage us - write a review on Google


Hello,
We are looking for a reporting tool to capture non financial information for legal or external disclosure (applying financial consolidation scope).
We are a group of 25K employees worldwide, HQ in France.
Please contact me on my mobile 0033 6 21 08 84 66
Thank you
Regards
Safia IHBANE
People Analytics Manager, Nexans