How to Integrate SAP HANA with MS Excel – A Hassle Free Process
Placement-ready Courses: Enroll Now, Thank us Later!
Previously, we learned the Relational connection in SAP HANA, now, it’s time to integrate SAP HANA with MS Excel. That is, how do we use data from SAP HANA into MS Excel spreadsheets for analysis and reporting.
So, first of all, we will see how to establish a connection between MS Excel and SAP HANA, then we’ll learn how to create visualizations using the data from SAP HANA.
Integrate SAP HANA with MS Excel
As we know, SAP HANA is an efficient in-memory database technology which provides data to the users in the blink of an eye. On the other hand, MS Excel is one of the most widely used data representation, analysis and reporting software of all time.
Excel’s capabilities are extended by connecting it to SAP HANA which provides real-time data access and ad-hoc analysis on billions of data rows. MS Excel offers HANA support from the 2003 version to the current version.
Excel uses an OLAP connection to SAP HANA database and information layers which is a direct connection. The interaction language used is MDX and the connection driver required is ODBO driver.
Connecting MS Excel to SAP HANA
In this section, we will learn how to connect to SAP HANA from MS Excel.
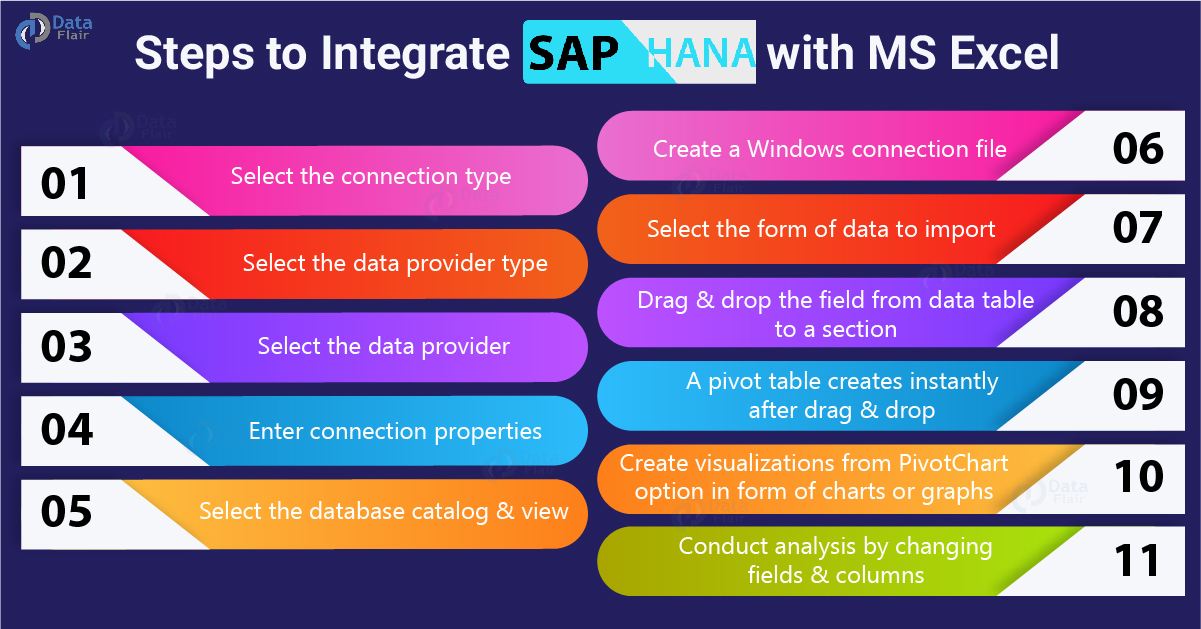
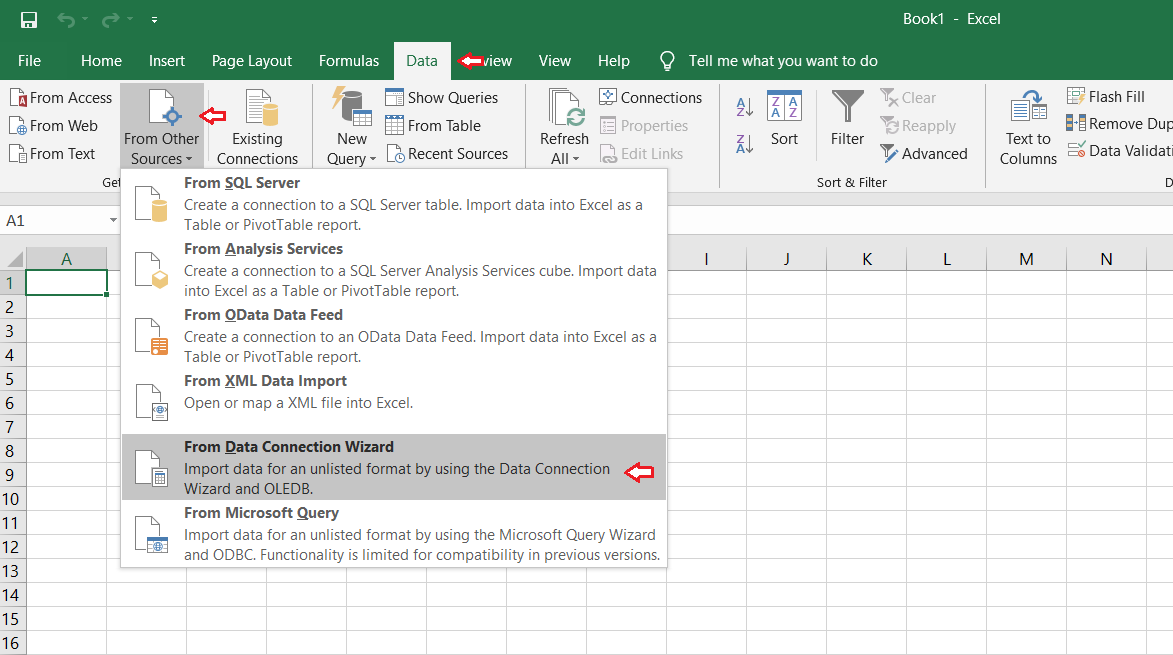
Step 1: Select the connection type
Open the MS Excel spreadsheet. Go to the Data tab. Then select From Other Sources option. From the drop-down list, select From Data Connection Wizard.
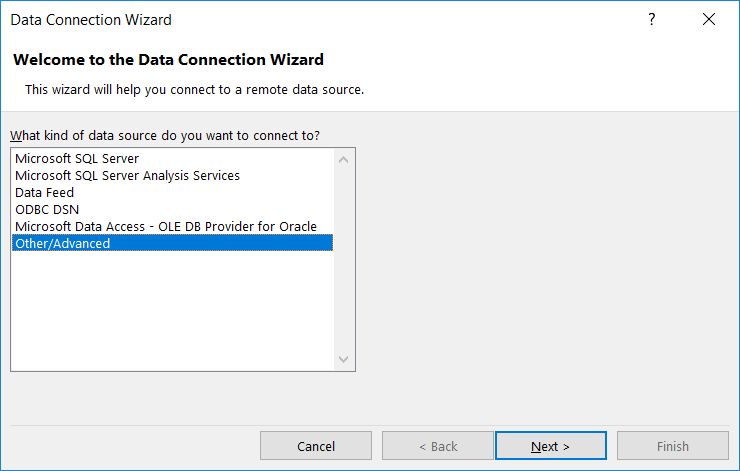
Step 2: Select the data provider type
Select Other/Advanced option from the Data Connection Wizard dialog and click Next.
Step 3: Select the data provider
Select the data provider as SAP HANA MDX Provider from the given list. Then, click on Next>>.
Step 4: Enter connection properties
Enter connection parameters specific to SAP HANA user account like Host name, Instance number, User name, Password, and Preferred language. You can instantly test a connection from this dialog by clicking on the Test Connection option.
A message will prompt confirming a successful connection that says, “Test Connection Succeeded”. Click on OK to continue.
Step 5: Select the database catalog and view
Next, we will select the schema or table/cube from the SAP HANA database as per our requirement. You can first select the database from Select the database that contains the data you want option. Then, select the schemas or tables within that database. Click on Next> to continue.
Step 6: Create a Windows connection file
Save the SAP HANA connection we just created and save the password for later use. You can also assign a Friendly Name for the connection file for the sake of easy recognition.
Along with this, you can write a description for the file, give a file name, specify search keywords and select Excel services. Then, click on Finish.
Using MS Excel with SAP HANA
Once we have created a connection to the SAP HANA system from MS Excel, now in the process to integrate SAP HANA with MS Excel, its time to learn how to perform analytical operations using the data we fetched from SAP HANA information views.
Step 1: Select the form of data to import
Select in what form, you want to import the data. You can select from a list of options like as a table, pivot table report, pivot chart, or only create the connection. Also, select the worksheet on which you want to import this data table or chart (Existing worksheet or New worksheet). Click on OK to continue.
Step 2: Drag & drop the data table field
You will see an empty pivot table template on the worksheet. You can drag and drop the field from the data table to the panel given in the right upper section naming PivotTable Field List.
Drag and drop the fields to one of the four sections given in the lower half section on the right (below the field list section). This section is named Drag Fields between areas below. The section is divided into four small sections; Report Filter, Column Labels, Row Labels, and Values.
If you want a field as a column in the table, drop it in the column section. Likewise, for rows, report filter, and value sections.
Step 3: Pivot table creates instantly after drag & drop
SAP HANA responds quickly to the drag and drop you do on the Excel spreadsheet and creates a Pivot table instantly. You can change the rows and columns as per your requirements from the field list. The changes will immediately reflect in the table on the spreadsheet.
Step 4: Create visualizations using the pivot table data
Now, to create some visualizations using the data in the pivot table, click on the PivotChart option (under the Options menu on the menu bar).
You can choose from a wide range of charts and graphs such as Columns, Line charts, Pie charts, Bar charts, Areas, Radar charts, etc. There are many options within a particular chart type as well.
Step 5: Conduct selections & analysis of table
The chart of your choice will be instantly made based on the data given in the table. You can make selections in the table which will reflect in the charts as well.
Also, you can conduct analysis as per your liking by changing the fields, columns, and rows and detect the patterns and trends in data.
We have completed the process to integrate SAP HANA with MS Excel.
Summary
This is all we need to know about using data from SAP HANA in MS Excel. SAP HANA is an efficient and quick tool that enable users to perform reporting on the data fetched from HANA in-memory from tools like MS Excel.
The in-memory data engine makes data processing many times faster than conventional databases.
Now, are you clear with the process to Integrate SAP HANA with MS Excel? If any queries, just enter in the comments section.
Your opinion matters
Please write your valuable feedback about DataFlair on Google


Really enjoyed your article as its highly informative