How to Connect Crystal Reports (2011/2013) with SAP HANA in 12 Steps
Expert-led Courses: Transform Your Career – Enroll Now
SAP Crystal Reports is a windows-based tool used for creating reports for the purpose of printouts and publishing such as sales invoice, sales orders report, etc.
In this tutorial, we will learn the process to directly connect SAP Crystal Reports with the SAP HANA database using appropriate drivers. Then, we will use the data in Crystal Reports to create our reports.
We assure you that by the end of this article, you will understand the process thoroughly and will become a master in connecting crystal reports with SAP HANA.
Crystal Reports and SAP HANA
SAP Crystal reports is popular because of its crystal clear and pixel perfect visuals. It uses JDBC/ODBC connectors and SQL as interaction language to connect to the SAP HANA database.
Now, let’s jump to the process to connect Crystal Reports 2011/2013/16 with SAP HANA. The nature of the connection is a direct OLAP connection.
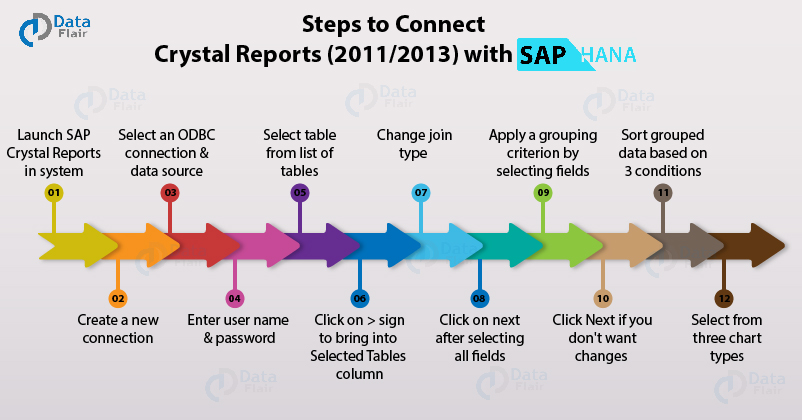
Steps to Connect Crystal Reports to SAP HANA
Step 1: Launch SAP Crystal Reports 2011/13/16 in your system.
The main page of SAP Crystal Reports will open.
Step 2: Now, you can either use an available connection to connect to SAP HANA or you can create a new connection. We will create a new one.
Creating Reports in Crystal Reports
Step 3: If you are creating a new connection, you can select from different connection options i.e. an ODBC connection, JDBC connection, OLAP, OLE DB, Excel, Salesforce.com or can connect through a Universe. Select your preferred connection method and click on Next.
In the next dialog, select the option “Select Data Source” and choose your data source from the drop-down list of Data Source Name. Click Next.
Step 4: Enter the User ID and password. Click on Finish.
Step 5: Data Sources
Once the connection is established, a Standard Report Creation Wizard will open.
Here, you will find a list of available data sources (schemas in SAP HANA) having tables, views, stored procedures from the selected data source.
Select the schema of your choice by clicking on its name. This will expand the node and show contents within that schema such as Tables, Views, Stored Procedures, etc.
If you want to select tables then open the Tables node and select the tables of your choice. Add them by clicking on the table name and then clicking on > icon.
This will add the tables in the Selected Tables section in the Standard Report Creation Wizard. Click Next when you have selected all the required tables and views from the schema.
You can select a table from the list of tables.
Step 6: Linking
Here, we see the fields of the tables and the nature of join between them.
You can also change the join type by clicking on the join made between the selected tables. A tab named Link Options will open from where you can select the Join Type, Link Type and the option of Enforced Join. Then click on OK.
Step 7: Fields Selection
Next, you have to select fields from the available table or the tables that you selected from the data source. The names of all the fields are provided under the Available Fields section.
Click on the fields that you want to add. Add them into Fields to Display section by using > icon. You can also rearrange the order of the fields from the up and down arrows.
Click on Next once you are done with selecting all the fields to be displayed.
Step 8: Grouping
Next, you can apply a grouping criterion on the selected fields. You can select a number of fields as the basis of grouping. Add the fields from Available Fields to Group By area using > icon.
You can also browse the data from the selected field and select whether to group and display the values in ascending or descending order.
Click on Next to continue.
Step 9: Summaries
The next window gives you a default list of summarized fields which are mostly integer fields. You can add or remove fields at this step.
Click Next if you don’t wish to make any changes.
Step 10: Group Sorting
You can sort your grouped data based on three conditions; None, Top 5 groups and Bottom 5 groups.
Also, you have an option for Comparing summary values for the Top or Bottom groups.
Step 11: Chart
In the final step, you get to select from three standard chart types in which you wish to visualize the data. The available chart types are line chart, pie chart and bar chart.
You can also go with No chart option. You also get to manage the chart from the options Chart title, On change of and Show summary.
Click on Finish.
Step 12: We finally have our report ready with the charts and tables we selected to be displayed. You can perform a range of manipulations and analytical operations on the dataset from the reporting interface.
You can apply more advanced features and make different types of visualizations using the data.
Summary
We hope our explanation to connect Crystal Reports with SAP HANA was helpful. In the next tutorial, we will discuss connecting Crystal Reports Enterprise 4.x to SAP HANA. If you have any queries or feedback for us, you can enter in the comment section.
If you are Happy with DataFlair, do not forget to make us happy with your positive feedback on Google


