JavaScript Debugging and Testing – Ultimate tutorial to grab major concepts
Full Stack Web Development Courses with Real-time projects Start Now!!
Every time you write new code, most probably you face an error of some kind. After everything we learned in JavaScript so far, you must be wondering if you can test your code. In our previous tutorial on JavaScript Errors, we discussed various errors you may encounter while programming. But how do you know where the error occurred? Because you can’t resolve any issue if you don’t recognize the reason for it. In a complex application, you need a sophisticated technique to test your code, improving its efficiency. That’s where JavaScript debugging comes in the picture.
The process of searching for the errors and finding them is called debugging. Debugging JavaScript code is difficult because the browser doesn’t show any error message or any indication to the location of the error. Fortunately, all modern browsers come with a built-in JavaScript debugger you can turn on and off. You can also set breakpoints and examine variables during the code execution. This tutorial explains different approaches to tackle the problem.
Debugging and Testing JavaScript
The console.log() method
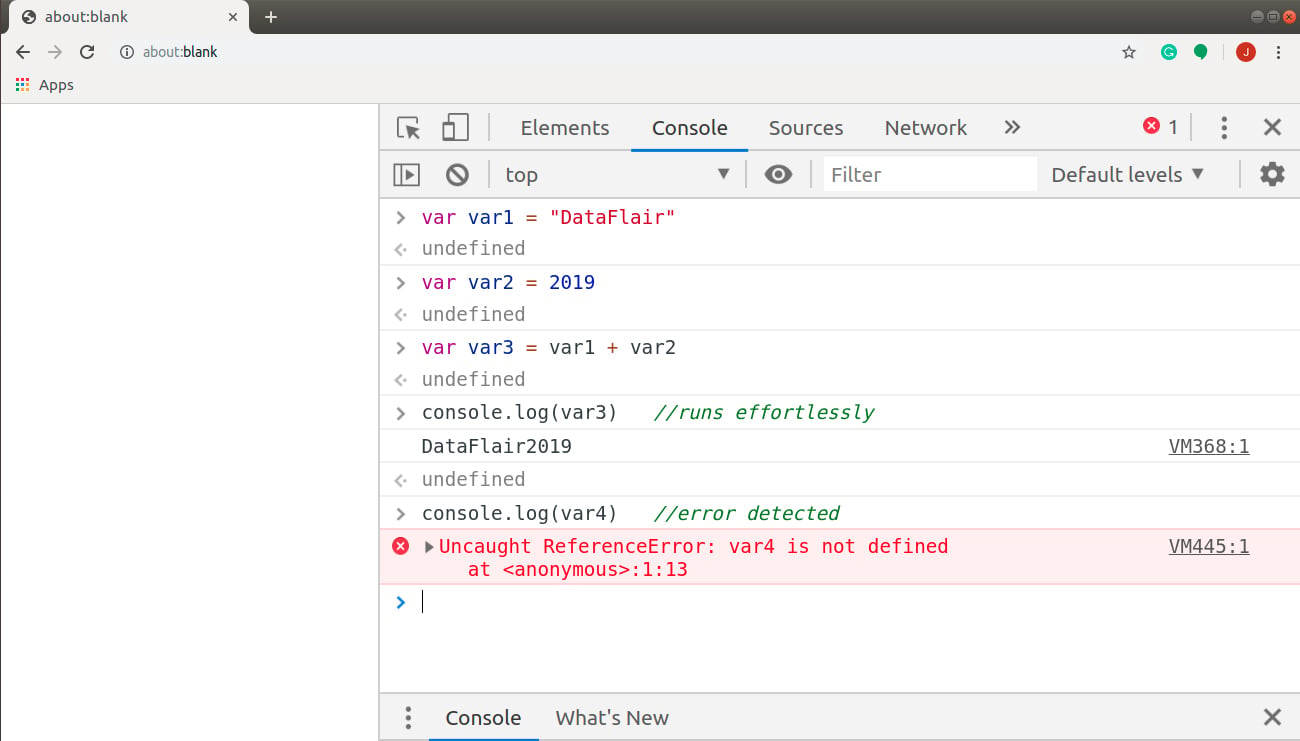
We used this method in many of our previous tutorials: working with the Browser Console. You can easily open the console by right-clicking on the page, then selecting the Inspect tab. Or you can use the shortcuts Ctrl+Shift+I or F12 for the same purpose. Let’s write a small program to get an overview of how a console works. Open a blank tab by typing about:blank in the address bar, open the console and start coding.
Code:
var var1 = "DataFlair"
var var2 = 2019
var var3 = var1 + var2
console.log(var3) //runs effortlessly
//DataFlair2019
undefined
console.log(var4) //error detected
/*Uncaught ReferenceError: var4 is not defined
    at <anonymous>:1:13*/
Output:
Setting Breakpoints
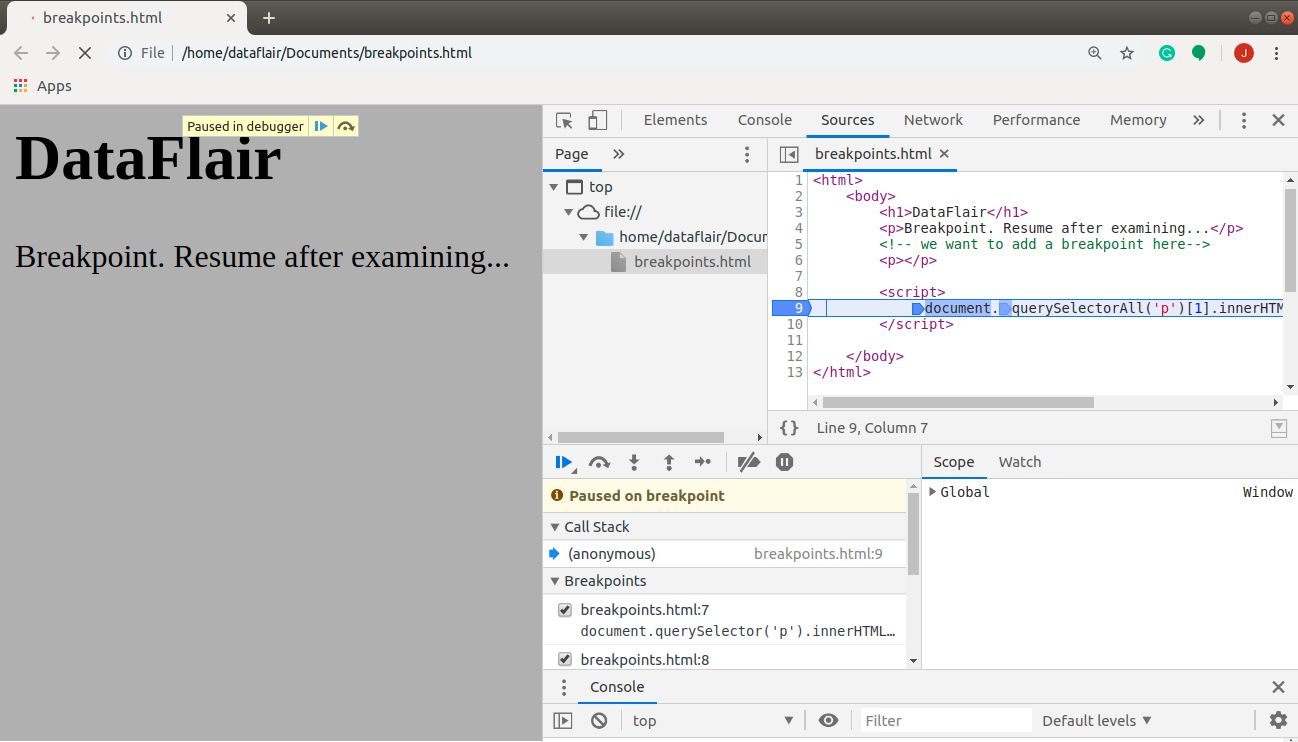
The above method is only practical if you are working on a small program. In a complicated program, it won’t be reliable. The alternate you have here is that you can set breakpoints to analyze your code. At each breakpoint, JavaScript stops executing, allowing you to examine the JavaScript values. You can resume execution after doing so (usually with a play button). The steps to add a breakpoint in a document is as follows:
- Open your HTML file in the browser and use any of the shortcuts discussed above.
- Click on the Source tab and open the file containing the line of code where you want to add a break.
- Go to the specific line of code. When you click on it or the line number column (on the left of the line of code), a blue icon appears on top of the line number column.
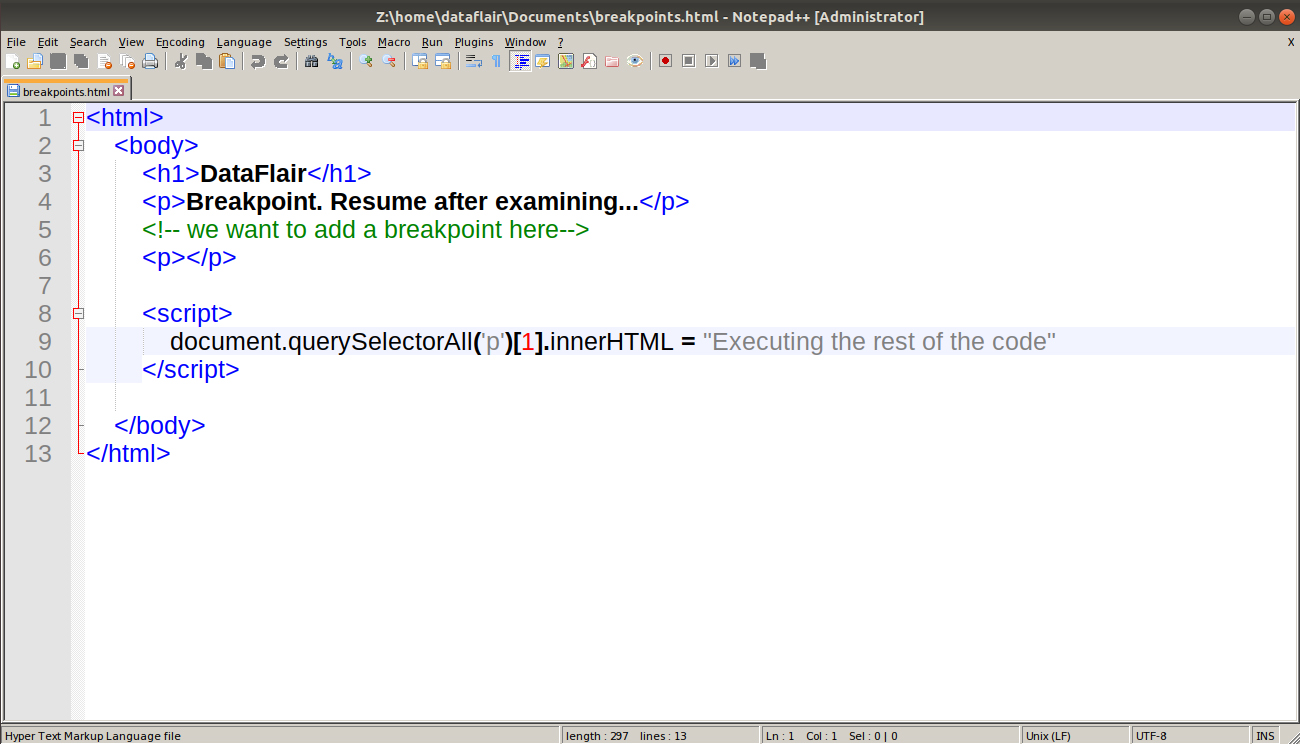
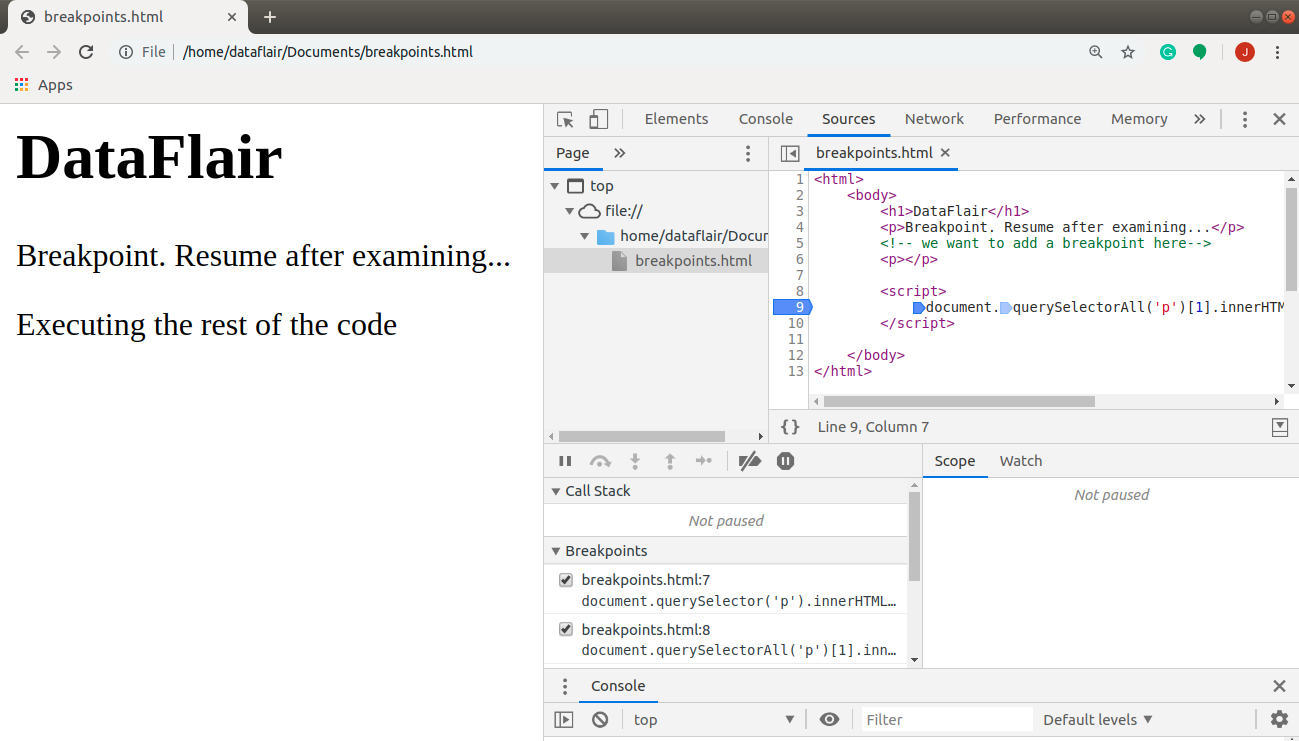
The code below sets a breakpoint in the code with this approach.
Code:
<html>
    <body>
        <h1>DataFlair</h1>
        <p>Breakpoint. Resume after examining...</p>
        <!-- we want to add a breakpoint here-->
        <p></p>

        <script>
document.querySelectorAll('p')[1].innerHTML = "Executing the rest of the code"
        </script>

    </body>
</html>
Screenshot:
Output (before continuing):
Output (after pressing F8 or clicking the play button):
The debugger keyword
In JavaScript, the debugger keyword stops the execution and if available, calls the debugging function. The keyword works the same way as setting a breakpoint. In the absence of debugging, the debugger statement has no effect. With the debugger turned on, this code stops executing when it encounters a debugger statement.
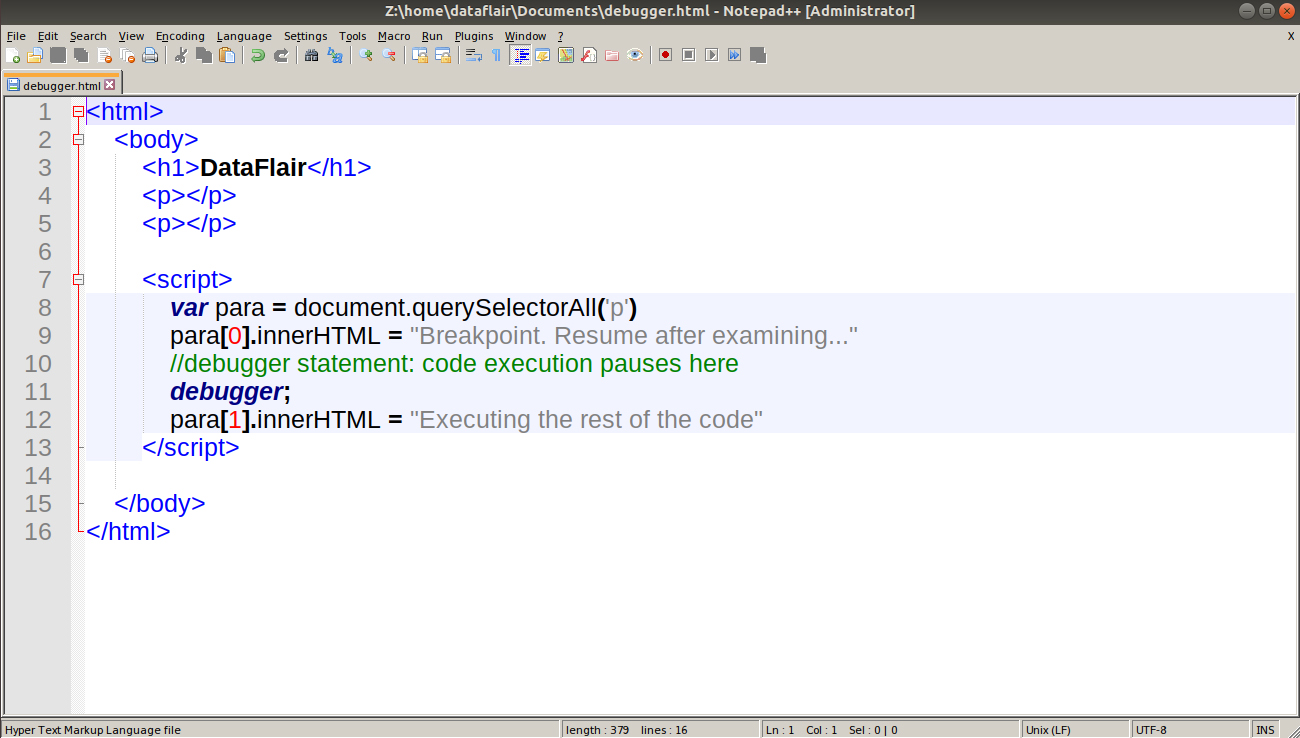
The following code generates the same result as the one above. The only noticeable difference is in the Source tab. Observe all the differences in the two approaches to understand how they work.
Code:
<html>
    <body>
        <h1>DataFlair</h1>
        <p></p>
        <p></p>

        <script>
        var para = document.querySelectorAll('p')
        para[0].innerHTML = "Breakpoint. Resume after examining..."
                //debugger statement: code execution pauses here
        debugger;
            para[1].innerHTML = "Executing the rest of the code"
        </script>

    </body>
</html>
Screenshot:
Output (before continuing):

Output (after pressing F8 or clicking the play button):
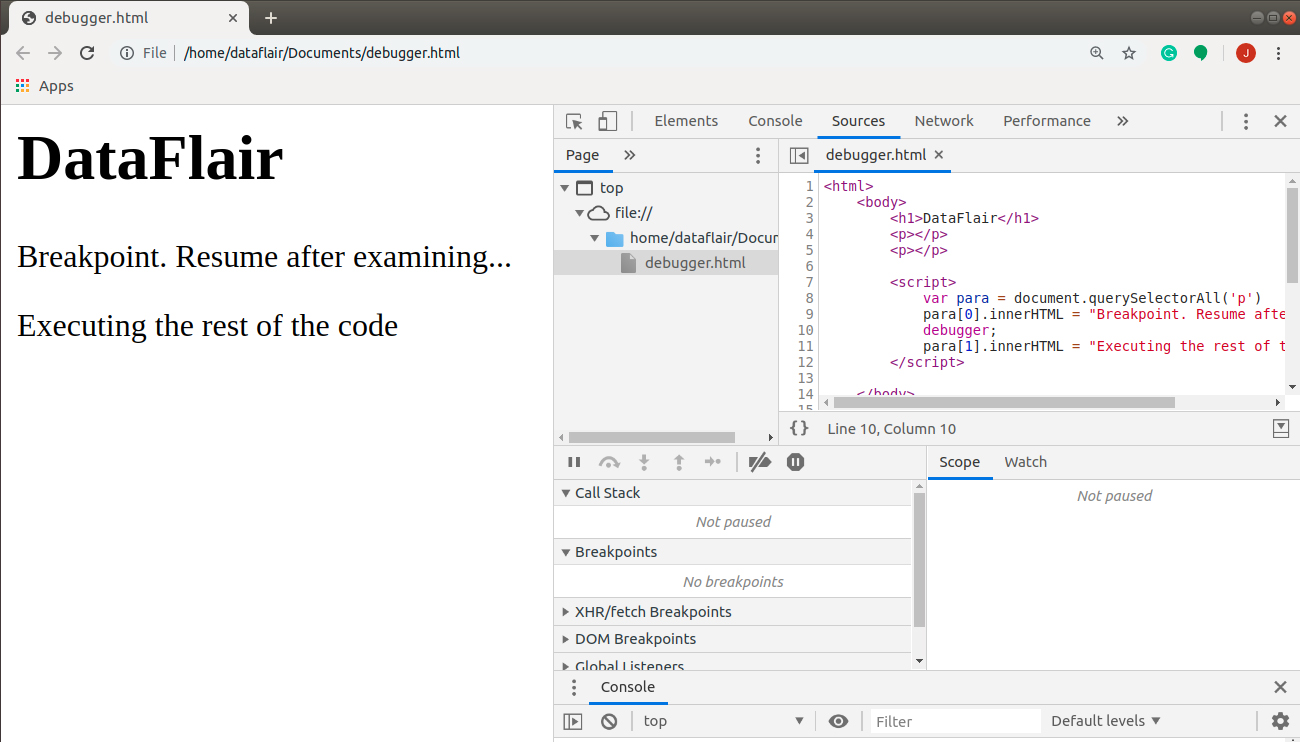
Note: The debugger will only pause the execution while working with the console. Thus, when you run the program in your browser, open the Browser Console, and then refresh the page.
Debugging Tools in JavaScript
Some of the most popular debugging tools available to the developers are as follows:
1. Cypress.io
This is a powerful open-source, front-end testing tool that allows us to debug JavaScript applications rather easily. This is the most straightforward tool to set up, write, run, and debug test codes in JavaScript. Cypress.io provides the developer with amazing features, including time travel (taking snapshots as tests run) and real-time reloading. This framework is easy to use, with polished documentation.
Learn about different types of JavaScript Applications in JavaScript Architecture Tutorial
2. Chrome DevTools
This is the tool we’ve been using in all our programs; we are familiar with it. Google Chrome DevTools is a set of profiling, web authoring, and debugging tools. You can use these tools to quickly and efficiently debug JavaScript code right from the Chrome browser (they are inbuilt). You get to interact with HTML, CSS, and JavaScript; all from the browser by merely clicking the Inspect Element button.
3. Mocha
It is a NodeJS dependent test framework for unit and integration testing. It is lightweight and easy to use, with numerous features like browser support, timeout support, etc. Being lightweight, it doesn’t demand extreme computer resources, boosting the speed of testing.
Summary
In this JavaScript tutorial, we discussed the various techniques for debugging and testing our JavaScript code. It is a crucial topic to learn if you want to develop new applications. The knowledge of this concept will help you in detecting the errors in your application. I suggest that you read this tutorial at least twice before moving on to the next one. Try all the codes explained in your browser and see what happens. Refer this JavaScript debugging tutorial or ask any query if you get stuck.
Did you checked our Latest JavaScript Project on To-do List
If you are Happy with DataFlair, do not forget to make us happy with your positive feedback on Google


