Kafka Monitoring | Methods & Tools for Kafka Monitoring
Kafka course with real-time projects Start Now!!
In our last Kafka Tutorial, we discussed Kafka Tools. Today, we will see Kafka Monitoring. In this, we will learn the concept of how to Monitor Apache Kafka.
Moreover, we will cover all possible/reasonable Kafka metrics that can help at the time of troubleshooting or Kafka Monitoring. Also, we will discuss audit and Kafka Monitoring tools such as Kafka Monitoring JMX.
So, let’s begin with Monitoring in Apache Kafka.
What is Kafka Monitoring?
As we know Kafka’s cluster-centric design offers strong durability and fault-tolerance. Also, topics are partitioned and replicated across multiple nodes, since Kafka is a distributed system.
Moreover, Kafka can be a highly attractive option for data integration, with meaningful performance monitoring and prompt alerting of issues. Basically, when there are troubleshooting Kafka issues application manager collects all performance metrics and alerts to those that require corrective action.
Let’s discuss Kafka Monitoring in detail –
Introduction to Kafka Monitoring
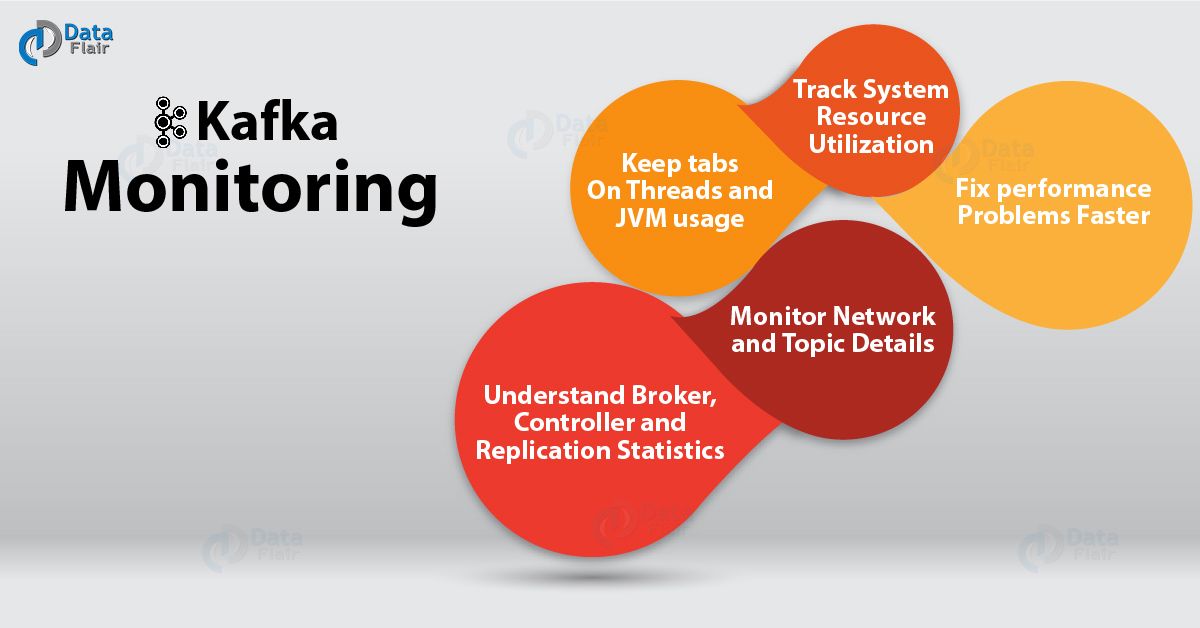
a. Track System Resource Utilization
To ensure you don’t run out of resources “Track System Resource Utilization” automatically discover Kafka servers, and also track the resource utilization details like memory, CPU and disk growth over time.
However, we ensure that your Apache Kafka server is up and continuously operating as expected. Hence, whenever there are sudden surges in resource consumption or unusual patterns, you can get notified quickly.
b. Keep Tabs on Threads and JVM usage
Kafka relies on Java garbage collection processes to free up memory, as it runs in the Java Virtual Machine (JVM). The more often the garbage collection will run, the more activity in your Kafka cluster occurs.
Make sure that started threads don’t overload the server’s memory, also ensure to track JVM heap sizes. Moreover, to prevent performance bottlenecks in your system, track thread usage with metrics like Daemon, Peak, and Live Thread Count.
c. Understand Broker, Controller and Replication Statistics
In a Kafka cluster, for managing the states of partitions and replicas and for performing administrative tasks like reassigning partitions, one of the brokers serves as the controller, that controller is responsible.
In order to see which Kafka broker was the controller when an issue occurred, monitor active controllers and to prevent service interruptions, offline partitions count.
Also, it monitors the broker’s Log flush latency – However, the longer it takes to flush log to disk, the more the pipeline breaks up. In addition, to know if replication is going as fast as configured, it tracks under-replicated partitions.
d. Monitor Network and Topic Details
Get the full picture of network usage on your host, track network throughput or aggregate incoming and outgoing byte rate on your broker topics for more information as to where potential bottlenecks lie. Make informed decisions.
e. Fix performance problems faster
If there are performance issues with the components of Apache Kafka, get instant notifications. Also, find out which application is causing the excessive load, and become aware of performance bottlenecks. Before your end users experience issues, take quick remedial actions.
Metrics and Alerts in Kafka Monitoring
Basically, our general rule of thumb is “collect all possible/reasonable metrics that can help when troubleshooting, alert only to those that require an action from you”.
a. Metrics on which we do graph and alerting
- Message in rate
MBEAN NAME: kafka.server:type=BrokerTopicMetrics,name=MessagesInPerSec
- A byte in rate from clients
MBEAN NAME: kafka.server:type=BrokerTopicMetrics,name=BytesInPerSec
- A byte in rate from other brokers
MBEAN NAME:kafka.server:type=BrokerTopicMetrics,name=ReplicationBytesInPerSec
- Request rate
MBEANNAME: kafka.network:type=RequestMetrics,name=RequestsPerSec,request={Produce|FetchConsumer|FetchFollower}- Error rate
MBEAN NAME: kafka.network:type=RequestMetrics,name=ErrorsPerSec,request=([-.\w]+),error=([-.\w]+)
NORMAL VALUE: Number of errors in responses counted per-request-type, per-error-code. If a response contains multiple errors, all are counted. error=NONE indicates successful responses.
- Request size in bytes
MBEAN NAME: kafka.network:type=RequestMetrics,name=RequestBytes,request=([-.\w]+)
NORMAL VALUE: Size of requests for each request type.
- Temporary memory size in bytes
MBEAN NAME: kafka.network:type=RequestMetrics,name=TemporaryMemoryBytes,request={Produce|Fetch}NORMAL VALUE: Temporary memory used for message format conversions and decompression.
- Message conversion time
MBEAN NAME: kafka.network:type=RequestMetrics,name=MessageConversionsTimeMs,request={Produce|Fetch}NORMAL VALUE: Time in milliseconds spent on message format conversions.
- Message conversion rate
MBEAN NAME: kafka.server:type=BrokerTopicMetrics,name={Produce|Fetch}MessageConversionsPerSec,topic=([-.\w]+)NORMAL VALUE: Number of records which required message format conversion.
- Byte out rate to clients
MBEAN NAME: kafka.server:type=BrokerTopicMetrics,name=BytesOutPerSec
- Byte out rate to other brokers
MBEAN NAME: kafka.server:type=BrokerTopicMetrics,name=ReplicationBytesOutPerSec
- Log flush rate and time
MBEAN NAME: kafka.log:type=LogFlushStats,name=LogFlushRateAndTimeMs
- # of under replicated partitions (|ISR| < |all replicas|)
MBEAN NAME: kafka.server:type=ReplicaManager,name=UnderReplicatedPartitions
NORMAL VALUE: 0
- # of under minIsr partitions (|ISR| < min.insync.replicas)
MBEAN NAME: kafka.server:type=ReplicaManager,name=UnderMinIsrPartitionCount
NORMAL VALUE: 0
- # of offline log directories
MBEAN NAME: kafka.log:type=LogManager,name=OfflineLogDirectoryCount
NORMAL VALUE: 0
- Is controller active on broker
MBEAN NAME: kafka.controller:type=KafkaController,name=ActiveControllerCount
NORMAL VALUE: only one broker in the cluster should have 1
- Leader election rate
MBEAN NAME: kafka.controller:type=ControllerStats,name=LeaderElectionRateAndTimeMs
NORMAL VALUE: non-zero when there are broker failures
- Unclean leader election rate
MBEAN NAME:kafka.controller:type=ControllerStats,name=UncleanLeaderElectionsPerSec
NORMAL VALUE:0
- Partition counts
MBEAN NAME: kafka.server:type=ReplicaManager,name=PartitionCount
NORMAL VALUE: mostly even across brokers
- Leader replica counts
MBEAN NAME: kafka.server:type=ReplicaManager,name=LeaderCount
NORMAL VALUE: mostly even across brokers
- ISR shrink rate
MBEAN NAME: kafka.server:type=ReplicaManager,name=IsrShrinksPerSec
NORMAL VALUE: If a broker goes down, ISR for some of the partitions will shrink. When that broker is up again, ISR will be expanded once the replicas are fully caught up. Other than that, the expected value for both ISR shrink rate and expansion rate is 0.
- ISR expansion rate
MBEAN NAME: kafka.server:type=ReplicaManager,name=IsrExpandsPerSec
NORMAL VALUE:
- Max lag in messages btw follower and leader replicas
MBEAN NAME: kafka.server:type=ReplicaFetcherManager,name=MaxLag,clientId=Replica
NORMAL VALUE: lag should be proportional to the maximum batch size of a produce request
- Lag in messages per follower replica
MBEAN NAME: kafka.server:type=FetcherLagMetrics,name=ConsumerLag,clientId=([-.\w]+),topic=([-.\w]+),partition=([0-9]+)
NORMAL VALUE: lag should be proportional to the maximum batch size of a produce request.
- Requests waiting in the producer purgatory
MBEAN NAME: kafka.server:type=DelayedOperationPurgatory,name=PurgatorySize,delayedOperation=Produce
NORMAL VALUE: non-zero if ack=-1 is used
- Requests waiting in the fetch purgatory
MBEAN NAME: kafka.server:type=DelayedOperationPurgatory,name=PurgatorySize,delayedOperation=Fetch
NORMAL VALUE: size depends on fetch.wait.max.ms in the consumer
- Request total timeSee also –
MBEAN NAME: kafka.network:type=RequestMetrics,name=TotalTimeMs,request={Produce|FetchConsumer|FetchFollower}NORMAL VALUE: broken into a queue, local, remote and response send time
- Time the request waits in the request queue
MBEAN NAME:kafka.network:type=RequestMetrics,name=RequestQueueTimeMs,request={Produce|FetchConsumer|FetchFollower}NORMAL VALUE:
- Time the request is processed at the leader
MBEAN NAME: kafka.network:type=RequestMetrics,name=LocalTimeMs,request={Produce|FetchConsumer|FetchFollower}NORMAL VALUE:
- Time the request waits for the follower
MBEAN NAME: kafka.network:type=RequestMetrics,name=RemoteTimeMs,request={Produce|FetchConsumer|FetchFollower}NORMAL VALUE: non-zero for produce requests when ack=-1
- Time the request waits in the response queue
MBEAN NAME: kafka.network:type=RequestMetrics,name=ResponseQueueTimeMs,request={Produce|FetchConsumer|FetchFollower}NORMAL VALUE:
- Time to send the response
MBEAN NAME: kafka.network:type=RequestMetrics,name=ResponseSendTimeMs,request={Produce|FetchConsumer|FetchFollower}NORMAL VALUE:
- A number of messages the consumer lags behind the producer. Published by the consumer, not broker.
MBEAN NAME: Old consumer:
kafka.consumer:type=ConsumerFetcherManager,name=MaxLag,clientId=([-.\w]+)
New consumer: kafka.consumer:type=consumer-fetch-manager-metrics,client-id={client-id} Attribute: records-lag-max
- The average fraction of time the network processors are idle
MBEAN NAME: kafka.network:type=SocketServer,name=NetworkProcessorAvgIdlePercent
NORMAL VALUE: between 0 and 1, ideally > 0.3
- The average fraction of time the request handler threads are idle
MBEAN NAME: kafka.server:type=KafkaRequestHandlerPool,name=RequestHandlerAvgIdlePercent
NORMAL VALUE: between 0 and 1, ideally > 0.3
- Bandwidth quota metrics per (user, client-id), user or client-id
MBEAN NAME: kafka.server:type={Produce|Fetch},user=([-.\w]+),client-id=([-.\w]+)NORMAL VALUE: Two attributes. throttle-time indicates the amount of time in ms the client was throttled. Ideally = 0. byte-rate indicates the data produce/consume rate of the client in bytes/sec.
For (user, client-id) quotas, both user and client-id are specified. If per-client-id quota is applied to the client, a user is not specified. If per-user quota is applied, client-id is not specified.
- Request quota metrics per (user, client-id), user or client-id
MBEAN NAME: kafka.server:type=Request,user=([-.\w]+),client-id=([-.\w]+)
NORMAL VALUE: Two attributes. throttle-time indicates the amount of time in ms the client was throttled. Ideally = 0. request-time indicates the percentage of time spent in broker network and I/O threads to process requests from client group.
For (user, client-id) quotas, both user and client-id are specified. If the per-client-id quota is applied to the client, the user is not specified. If the per-user quota is applied, client-id is not specified.
- Requests exempt from throttling
MBEAN NAME: kafka.server:type=Request
NORMAL VALUE: exempt-throttle-time indicates the percentage of time spent in broker network and I/O threads to process requests that are exempt from throttling.
- ZooKeeper client request latency
MBEAN NAME: kafka.server:type=ZooKeeperClientMetrics,name=ZooKeeperRequestLatencyMs
NORMAL VALUE: Latency in milliseconds for ZooKeeper requests from the broker.
- ZooKeeper connection status
MBEAN NAME: kafka.server:type=SessionExpireListener,name=SessionState
NORMAL VALUE: Connection status of broker’s ZooKeeper session which may be one of Disconnected|SyncConnected|AuthFailed|ConnectedReadOnly|SaslAuthenticated|Expired.
b. Common monitoring metrics for producer/consumer/connect/streams
- connection-close-rate
DESCRIPTION: Connections closed per second in the window.
MBEAN NAME: kafka.[producer|consumer|connect]:type=[producer|consumer|connect]-metrics,client-id=([-.\w]+)
- connection-creation-rate
DESCRIPTION: New connections established per second in the window.
MBEAN NAME: kafka.[producer|consumer|connect]:type=[producer|consumer|connect]-metrics,client-id=([-.\w]+)
- network-io-rate
DESCRIPTION: The average number of network operations (reads or writes) on all connections per second.
MBEAN NAME: kafka.[producer|consumer|connect]:type=[producer|consumer|connect]-metrics,client-id=([-.\w]+)
- outgoing-byte-rate
DESCRIPTION: The average number of outgoing bytes sent per second to all servers.
MBEAN NAME: kafka.[producer|consumer|connect]:type=[producer|consumer|connect]-metrics,client-id=([-.\w]+)
- request-rate
DESCRIPTION: The average number of requests sent per second.
MBEAN NAME: kafka.[producer|consumer|connect]:type=[producer|consumer|connect]-metrics,client-id=([-.\w]+)
- request-size-avg
DESCRIPTION: The average size of all requests in the window.
MBEAN NAME: kafka.[producer|consumer|connect]:type=[producer|consumer|connect]-metrics,client-id=([-.\w]+)
- request-size-max
DESCRIPTION: The maximum size of any request sent in the window.
MBEAN NAME: kafka.[producer|consumer|connect]:type=[producer|consumer|connect]-metrics,client-id=([-.\w]+)
- incoming-byte-rate
DESCRIPTION: Bytes/second read off all sockets.
MBEAN NAME: kafka.[producer|consumer|connect]:type=[producer|consumer|connect]-metrics,client-id=([-.\w]+)
- response-rate
DESCRIPTION: Responses received sent per second.
MBEAN NAME: kafka.[producer|consumer|connect]:type=[producer|consumer|connect]-metrics,client-id=([-.\w]+)
- select-rate
DESCRIPTION: Number of times the I/O layer checked for new I/O to perform per second.
MBEAN NAME: kafka.[producer|consumer|connect]:type=[producer|consumer|connect]-metrics,client-id=([-.\w]+)
- io-wait-time-ns-avg
DESCRIPTION: The average length of time the I/O thread spent waiting for a socket ready for reads or writes in nanoseconds.
MBEAN NAME: kafka.[producer|consumer|connect]:type=[producer|consumer|connect]-metrics,client-id=([-.\w]+)
- io-wait-ratio
DESCRIPTION: The fraction of time the I/O thread spent waiting.
MBEAN NAME: kafka.[producer|consumer|connect]:type=[producer|consumer|connect]-metrics,client-id=([-.\w]+)
- io-time-ns-avg
DESCRIPTION: The average length of time for I/O per select call in nanoseconds.
MBEAN NAME: kafka.[producer|consumer|connect]:type=[producer|consumer|connect]-metrics,client-id=([-.\w]+)
- io-ratio
DESCRIPTION: The fraction of time the I/O thread spent doing I/O.
MBEAN NAME: kafka.[producer|consumer|connect]:type=[producer|consumer|connect]-metrics,client-id=([-.\w]+)
- connection-count
DESCRIPTION: The current number of active connections.
MBEAN NAME: kafka.[producer|consumer|connect]:type=[producer|consumer|connect]-metrics,client-id=([-.\w]+)
- successful-authentication-rate
DESCRIPTION: Connections that were successfully authenticated using SASL or SSL.
MBEAN NAME: kafka.[producer|consumer|connect]:type=[producer|consumer|connect]-metrics,client-id=([-.\w]+)
- failed-authentication-rate
DESCRIPTION: Connections that failed authentication.
MBEAN NAME: kafka.[producer|consumer|connect]:type=[producer|consumer|connect]-metrics,client-id=([-.\w]+)
c. Common Per-broker metrics for producer/consumer/connect/streams
- outgoing-byte-rate
DESCRIPTION: The average number of outgoing bytes sent per second for a node.
MBEAN NAME: kafka.producer:type=[consumer|producer|connect]-node-metrics,client-id=([-.\w]+),node-id=([0-9]+)
- request-rate
DESCRIPTION: The average number of requests sent per second for a node.
MBEAN NAME: kafka.producer:type=[consumer|producer|connect]-node-metrics,client-id=([-.\w]+),node-id=([0-9]+)
- request-size-avg
DESCRIPTION: The average size of all requests in the window for a node.
MBEAN NAME: kafka.producer:type=[consumer|producer|connect]-node-metrics,client-id=([-.\w]+),node-id=([0-9]+)
- request-size-max
DESCRIPTION: The maximum size of any request sent in the window for a node.
MBEAN NAME: kafka.producer:type=[consumer|producer|connect]-node-metrics,client-id=([-.\w]+),node-id=([0-9]+)
kafka.producer:type=[consumer|producer|connect]-node-metrics,client-id=([-.\w]+),node-id=([0-9]+)
- incoming-byte-rate
DESCRIPTION: The average number of responses received per second for a node.
MBEAN NAME: kafka.producer:type=[consumer|producer|connect]-node-metrics,client-id=([-.\w]+),node-id=([0-9]+)
- request-latency-avg
DESCRIPTION: The average request latency in ms for a node.
MBEAN NAME: kafka.producer:type=[consumer|producer|connect]-node-metrics,client-id=([-.\w]+),node-id=([0-9]+)
- request-latency-max
DESCRIPTION: The maximum request latency in ms for a node.
MBEAN NAME: kafka.producer:type=[consumer|producer|connect]-node-metrics,client-id=([-.\w]+),node-id=([0-9]+)
- response-rate
DESCRIPTION: Responses received sent per second for a node.
MBEAN NAME: kafka.producer:type=[consumer|producer|connect]-node-metrics,client-id=([-.\w]+),node-id=([0-9]+)
Others – Kafka Monitoring
Also, it is highly recommended to monitor GC time and other stats and various server stats like CPU utilization, I/O service time, etc.
Also, it is recommended to monitor the message/byte rate (global and per topic), request rate/size/time, and on the consumer side, max lag in messages among all partitions and min fetch request rate, on the client side.
Audit in Kafka Monitoring
However, the final alerting is correctness of the data delivery. An audit that every message that is sent is consumed by all consumers and measure the lag for this to occur. Moreover, for important topics alert if a certain completeness is not achieved in a certain time period.
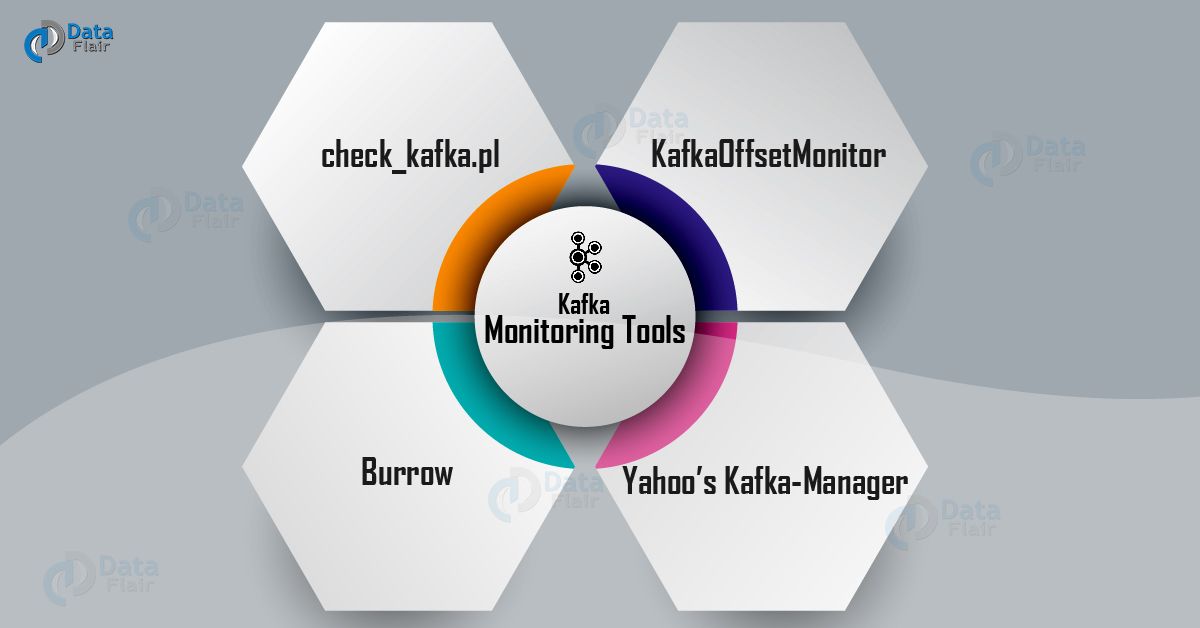
Kafka Monitoring Tools
Basically, monitoring tools with JMX support should be able to monitor a Kafka cluster. Some of them are:
Kafka Monitoring Tools
a. check_kafka.pl
This Kafka Monitoring tool performs a complete end to end test, i.e. it inserts a message in Kafka as a producer and then extracts it as a consumer. Hence, we can say, while measuring service times, this makes our life easier.
b. KafkaOffsetMonitor
This Apache Kafka Monitoring tool helps to monitor Kafka consumers and their position (offset) in the queue. It boosts our understanding of how our queue grows and also tells which consumers groups are lagging behind.
c. Burrow
The smartest tool out there IS Burrow, it has developed by the LinkedIn folks. This tool analyzes consumer offsets and lags over a window of time and determines the consumer status. So, we can retrieve this status over an HTTP endpoint and then plug it into our favourite monitoring tool.
d. Yahoo’s Kafka-Manager
However, it performs some basic monitoring, it is more of a management tool.
So, this was all about Apache Kafka Monitoring. Hope you like our explanation.
Conclusion – Apache Kafka Monitoring
Hence, we have seen the concept of how to Monitor Apache Kafka in detail. Along with this, we discussed different Kafka Monitoring tools.
Moreover, we studied Kafka Metrics and alerts. In addition, we saw Audit Kafka Monitoring. Still, if any doubt occurs regarding Kafka Monitoring, feel free to ask in the comment section.
We work very hard to provide you quality material
Could you take 15 seconds and share your happy experience on Google


