Learn JVM Tutorial – Architecture & Working of Java Virtual Machine
Get Job-ready: Java Course with 45+ Real-time Projects! - Learn Java
In this JVM tutorial, we are going to study one of the most important aspects of Java Programming that is the JVM (Java Virtual Machine). Moreover, we are going to learn JVM architecture and its subsystems. In addition, we will look at a brief of what the Java Virtual Machine is and also how the Java Virtual Machine works. Moreover, we will discuss Java Classloader, an executive engine in Java, Java Memory Model, and the JVM screen in detail.
So, let’s start the Java Virtual Machine Tutorial.
Learn JVM Tutorial – Architecture & Working of Java Virtual Machine
What is a JVM?
Java Virtual Machine (JVM) is an execution environment for Java applications. In the general sense, the JVM, an abstract computing machine characterized by a particular, it intends to decipher bytecode that is assembled from Java source code. More regularly, the JVM alludes to the solid execution of this particular with a strict instrument set and a comprehensive memory model. The essential reference usage of the JVM is HotSpot.
Do you know the Difference Between JDK vs JRE vs Java Virtual Machine?
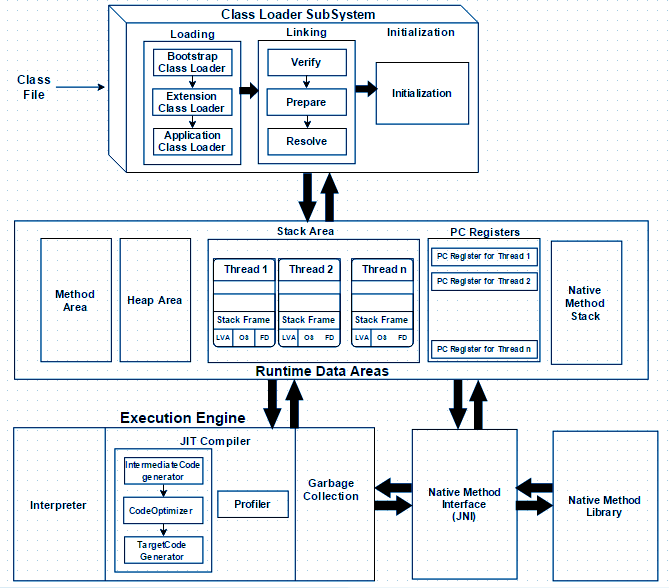
JVM Architecture in Java
JVM Architecture in Java has three main subsystems –
- Java ClassLoader Subsystem
- Runtime Data Area
- Execution Engine
Java ClassLoader – In charge of parsing Java source code and loading classes into the information territories.
Execution Engine in Java – In charge of executing guidelines from the information zones.
Java ClassLoader
JVM utilizes distinctive Java ClassLoaders sorted out into the following hierarchy:
- The bootstrap ClassLoader in Java is the parent for different ClassLoaders. It stacks the core Java libraries and a single written in local code.
- The augmentation Java ClassLoader is an offspring of the bootstrap ClassLoader. It stacks the augmentation libraries.
- The framework ClassLoader in Java is an offspring of the augmentation ClassLoader. It stacks the application class records found in the classpath.
- A user-characterized Java ClassLoader is an offspring of the framework ClassLoader or another client-characterized ClassLoader.
At the point when a ClassLoader gets a demand to load a class, it checks the cache to check whether the class has already been stacked, at that point it delegates the demand to the parent. If the parent neglects to stack the class, at that point the youngster endeavours to stack the class itself. A youngster Java ClassLoader can check the store of the parent ClassLoader, yet the parent can’t see classes loaded by the tyke. However, the outline is such in light of the fact that a kid ClassLoader ought not to be permitted to stack classes that are now stacked by its parent.
Let’s revise Java Class and Object to Learn OOPs in Java
Execution Engine in Java
The Java Execution Engine executes instructions from the bytecode stacked into the information regions one by one. To make the bytecode orders decipherable to the machine, the execution motor uses two strategies.
- Understanding: The execution motor changes each order to the machine language as it has experience.
- Just In Time (JIT) Compiling: On the off chance that a technique is utilized as often as possible, the execution motor orders it to local code and stores it in the reserve. From that point forward, all charges related to this technique are executed straightforwardly without understanding.
In spite of the fact that JIT aggregation takes more time than translation, it is done once for a technique that may get called a large number of times. Running such a strategy as local code spares a great deal of execution time compared to deciphering each charge one by one each time it is experienced.
JIT assemblage isn’t a necessity of the JVM detail, and it isn’t the main method that is utilized to enhance JVM execution. The determination characterizes just which bytecode orders identify with which local code; it is up to the user to characterize how the execution motor really plays out this change.
Learn Decision Making in Java Programming
Java Memory Model
The Java memory model display is based on the idea of programmed memory administration. At the point when an application never again refers to an object, a trash collector disposes of it, and this arranges for memory. This is not the same as numerous other programming languages, where you need to physically empty the question from memory.
The JVM distributes memory from the basic OS and isolates it into the accompanying territories.
- Heap Space: This is a mutual memory territory used to hold the articles that a trash specialist filters. It contains the memory area allocated to instance variables and objects.
- Method Area: It is the space where all class information is stored. It also keeps the data of methods like method variables, parameters used, their return type, etc.
- Stack Area: It creates separate stacks for each thread. It works on the concept of Last In, First Out. It is mainly used for storing local variables and references to objects.
- Technique Area: This territory was already known as the permanent age where stacked classes were put away. It has as of late been expelled from the JVM, and classes are currently stored as metadata in the local memory of the basic OS.
Java Virtual Machine- Java Memory Model
- Native Area: It holds the reference for the data types that are negative.
Let’s Learn How to Detect & Reduce Java Deadlock
JVM Screen in Java
1. Total Memory Utilization (MB)
The measure of memory that the JVM employs. This metric can influence the general execution of the hidden OS if the JVM devours all accessible memory.
2. Heap Memory Utilization (MB)
The measure of memory that the JVM apportions for objects utilized by the running Java application. Trash specialists consistently sort out unused items from the load. On the off chance that this metric develops, it can demonstrate that your application isn’t expelling references for unused items, or that you have to design the city worker appropriately.
3. Non-Heap Memory Use (MB)
The measure of memory assigned to the method zone and the code reserve. The technique region utilizes to store references to stacked classes. On the off chance that these references are not evacuated appropriately, the lasting age pool can build each time the application redeploys, prompting a non-load memory spill. It can likewise demonstrate a thread creation spill.
4. Total Pool Memory Utilization (MB)
All the memory utilized by the different memory pools designated by the JVM (that is, the aggregate memory without the code reserve territory). Therefore, this can give you a thought of how much memory your application expands without the JVM overhead.
5. Strings
The number of dynamic strings in the JVM. For instance, each demand to a Tomcat server is prepared in a different string, so this metric can give you a thought of the number of solicitations that are presently served, and whether it influences the foundation tasks that are running in strings set to a lower priority.
Let’s revise the Java String, Methods And Constructor
- Classes: The number of stacked classes. On the off chance that your application progressively makes a considerable amount of classes, this can be a source of a serious memory leak.
So, this was all about the Java Virtual Machine (JVM). Hope you like our explanation.
Garbage Collection’s Effect on JVM Performance
An essential JVM function that automatically recovers memory taken up by unneeded objects is garbage collection. Although garbage collection guarantees effective memory management, the process itself can affect Java Virtual Machine (JVM) performance. Hence, Various garbage collection algorithms exist, each with trade-offs related to memory consumption and execution time.
Therefore, you can greatly increase the performance of your application by selecting the best garbage collection algorithm. The size and lifetime of the objects in your application, along with the ideal trade-off between memory consumption and performance, should all be taken into account when choosing a garbage collection algorithm. “‘ – new paragraph
Just-In-Time (JIT) Gathering and Enhancement of Performance
An essential part of the JVM’s execution engine that tailors bytecode to the particular underlying hardware is the JIT compiler. Your Java applications’ performance can be greatly enhanced by the JIT compiler, which translates bytecode into machine code at runtime. But there may be some overhead from the initial compilation procedure.
Furthermore, the workload of your application and the complexity of your code can affect how effective JIT compilation is. You can write code that takes full advantage of this optimization technique by having a better understanding of how JIT compilation operates and the factors that affect its effectiveness.
Conclusion
In this JVM tutorial, we learned about the Java Virtual Machine in detail. Moreover, we look at JVM architecture and its subtypes. Along with this, we saw Java ClassLoader, the execution engine in Java, the Java memory model, and the JVM Screen. Furthermore, if you have any queries, feel free to ask in the comments section.
See also- Java Character Class Methods
Did you like this article? If Yes, please give DataFlair 5 Stars on Google


